Name
AlphaTrend双向跟踪策略AlphaTrend-Dual-Tracking-Strategy
Author
ChaoZhang
Strategy Description
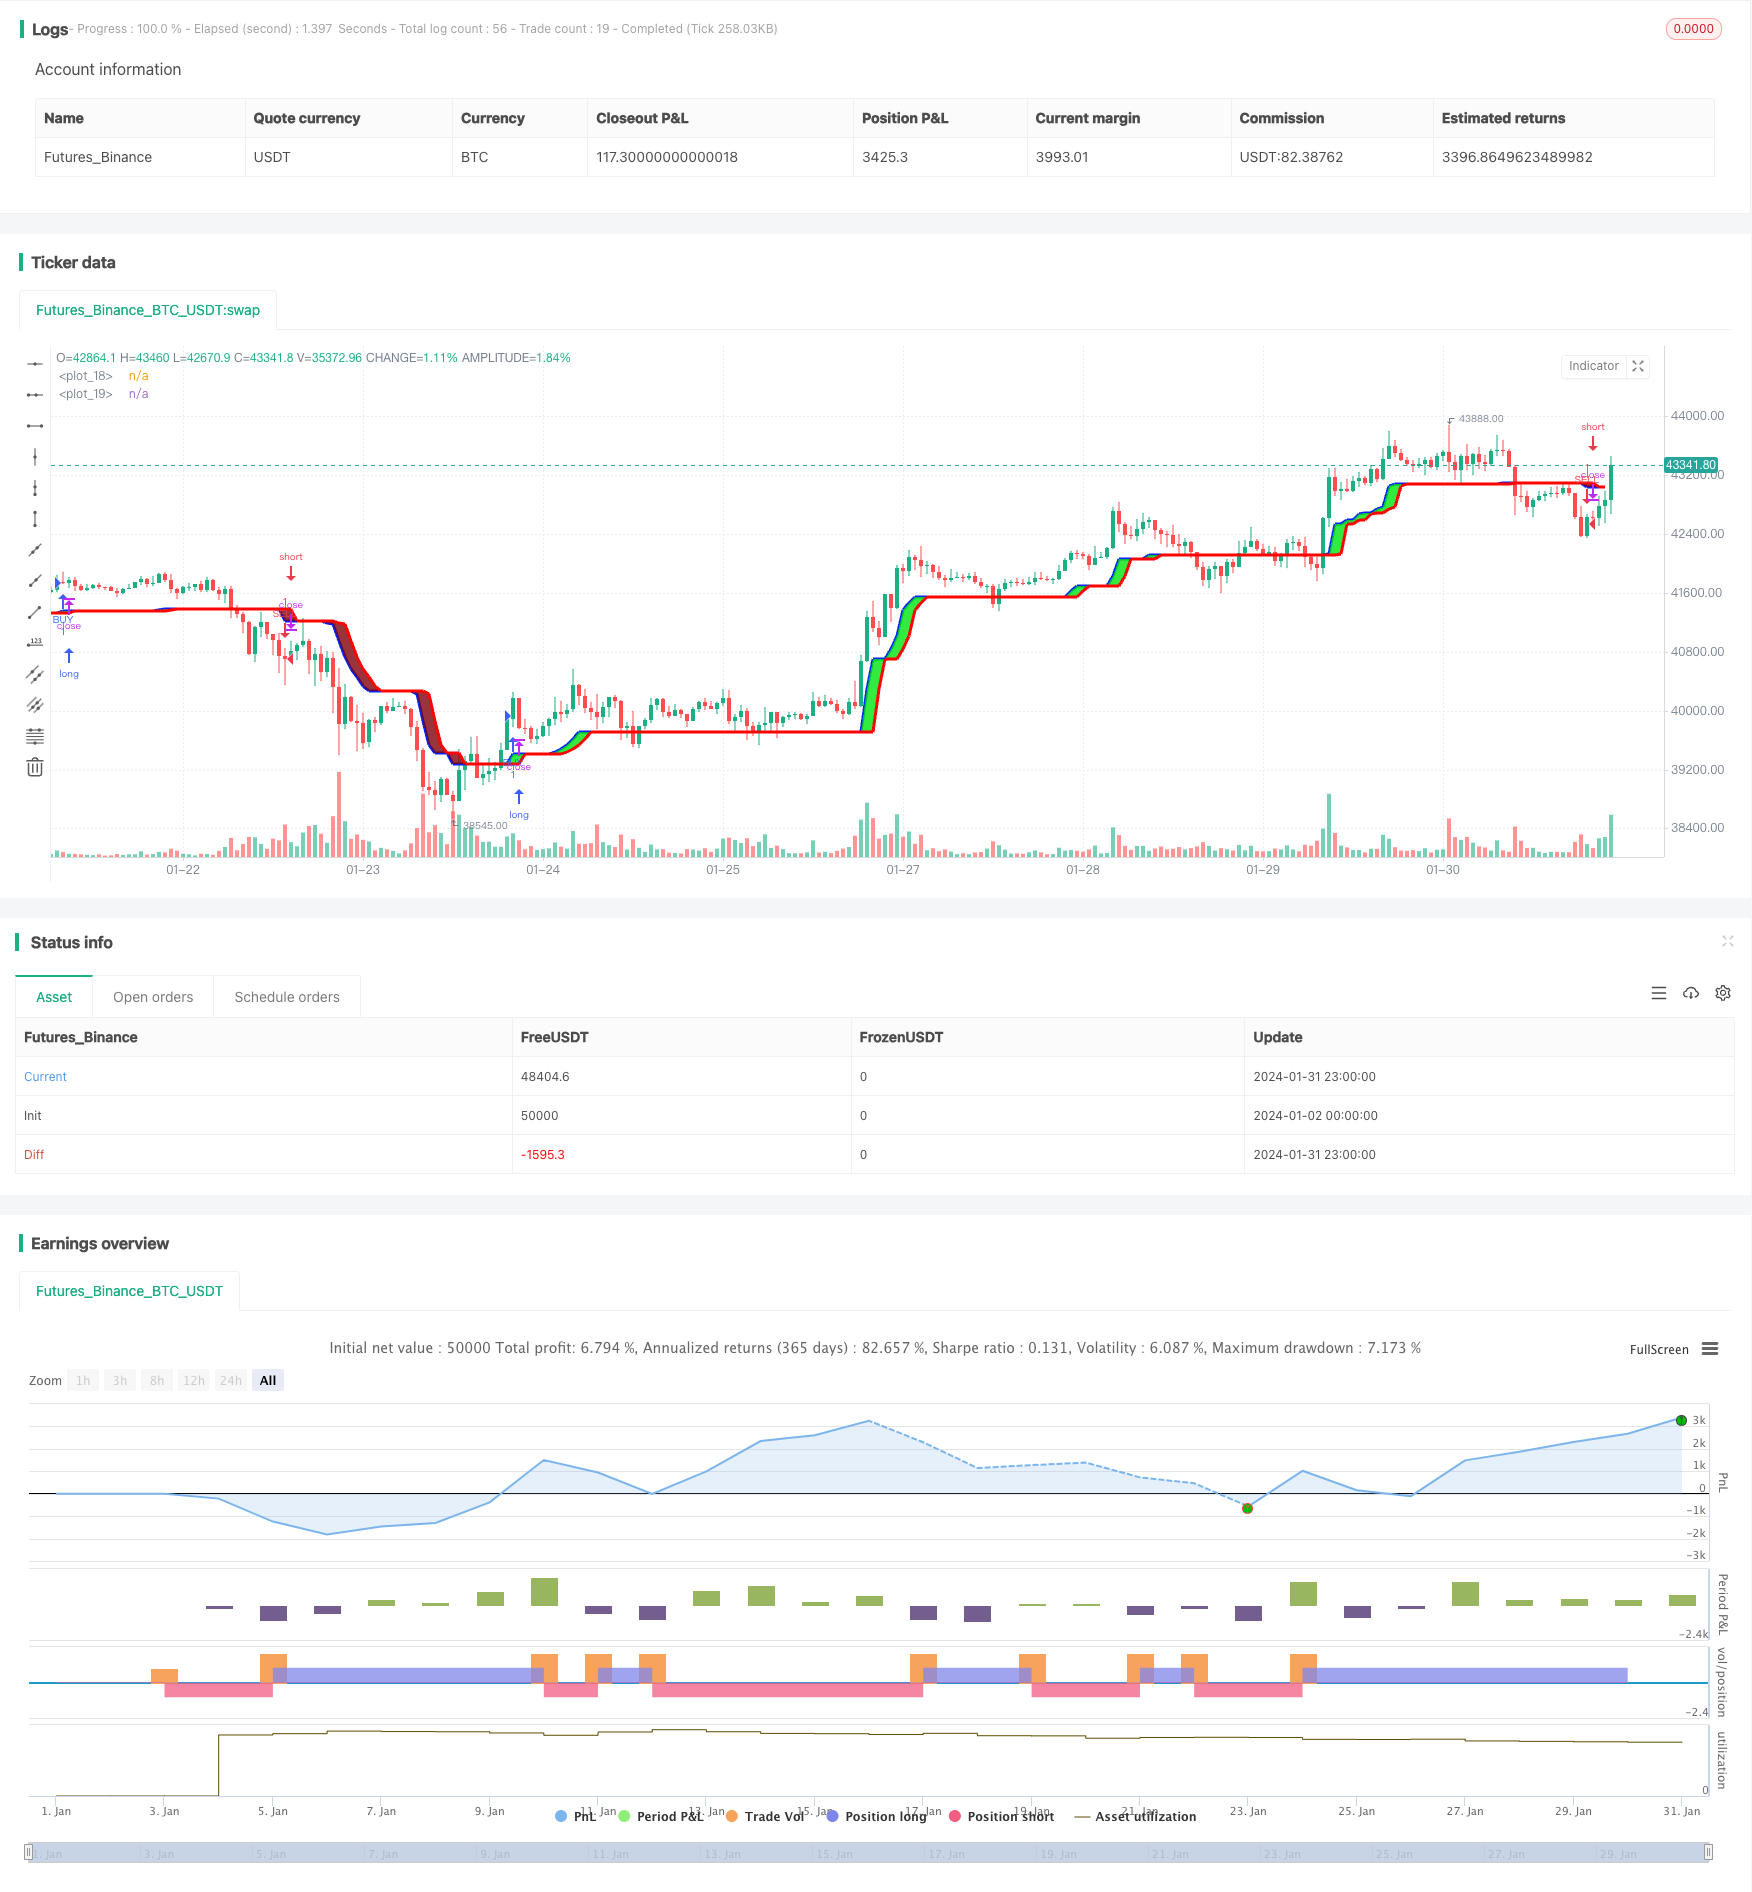
AlphaTrend双向跟踪策略是根据AlphaTrend指标的买入和卖出信号来进行交易的策略。该策略可以在AlphaTrend指标产生买入和卖出信号的区域打开多头和空头仓位。
AlphaTrend双向跟踪策略的核心是AlphaTrend指标。AlphaTrend指标基于自适应平均真实波幅(ATR)和价格(收盘价或成交量加权平均价)的组合来计算上轨和下轨。具体计算方法是:
上轨 = 最低价 - ATR * 系数 下轨 = 最高价 + ATR * 系数
其中ATR是过去一定周期的平均真实波幅,系数是可调参数。当价格高于上轨时,指标线接近上轨;当价格低于下轨时,指标线接近下轨。这样AlphaTrend指标就形成了一个自适应的通道。
AlphaTrend双向跟踪策略则是基于AlphaTrend指标的信号来建立多头和空头仓位。具体逻辑是:
- 当价格上穿AlphaTrend指标时,做多;
- 当价格下穿AlphaTrend指标时,做空。
这样就完成了基于AlphaTrend指标动态通道的双向跟踪交易。
AlphaTrend双向跟踪策略最大的优势在于能够跟踪市场趋势的变化。自适应ATR能够根据市场波动率的变化调整通道范围,避免了传统布林带等指标容易因波动率扩大而失效的问题。
另外,AlphaTrend指标同时结合价格和成交量(或势能),能够过滤掉一些假突破。这也提高了策略信号的质量。
AlphaTrend双向跟踪策略的主要风险来自于巨大行情震荡对指标通道的冲击。当市场出现异常波动时,停损点有可能被突破,导致较大亏损。这需要通过适当调整ATR参数和停损点来控制风险。
此外,ALPHA指标本身会有一定滞后。所以在行情转折点附近也会产生错误信号。这需要辅助其他指标来确认。
AlphaTrend双向跟踪策略可以从以下几个方面进行优化:
- 结合趋势指标判断市场主要趋势,避免逆势交易;
- 增加成交量限制,避免低量的假突破带来损失;
- 优化指标参数,使通道范围更加符合不同品种的特点;
- 增加机器学习算法,使通道更加智能化。
通过以上几点优化,可以进一步提高AlphaTrend策略的稳定性和盈利能力。
AlphaTrend双向跟踪策略整体来说是一种跟踪市场变化的有效策略。它解决了传统技术指标容易失效的问题,也结合了成交量来过滤信号。通过适当优化,该策略可以成为量化交易体系中的有力工具。
||
The AlphaTrend dual tracking strategy trades based on the buy and sell signals generated by the AlphaTrend indicator. It opens long and short positions in the areas where AlphaTrend produces buy and sell signals.
The core of the AlphaTrend dual tracking strategy is the AlphaTrend indicator. The AlphaTrend indicator calculates the upper and lower bands based on the adaptive ATR and price (close price or volume weighted average price). The specific calculation method is:
Upper Band = Lowest Low - ATR * Multiplier Lower Band = Highest High + ATR * Multiplier
Where ATR is the average true range over a certain period and multiplier is an adjustable parameter. When price is above the upper band, the indicator line approaches the upper band. When price is below the lower band, the indicator line approaches the lower band. Thus AlphaTrend forms an adaptive channel.
The AlphaTrend dual tracking strategy establishes long and short positions based on the signals generated by AlphaTrend. The specific logic is:
- Go long when price crosses above AlphaTrend;
- Go short when price crosses below AlphaTrend.
This completes the dual-directional tracking trading based on the dynamic AlphaTrend channel.
The biggest advantage of AlphaTrend dual tracking strategy is that it can track changes in market trends. The adaptive ATR can adjust the channel range according to changes in market volatility, avoiding the problem of traditional Bollinger Bands losing effectiveness due to volatility expansion.
In addition, AlphaTrend combines both price and volume (or momentum) information, which helps filter out some false breakouts, improving the quality of trading signals.
The main risk of the AlphaTrend dual tracking strategy comes from huge market fluctuations that could hit the stop loss points. When there is abnormal market movement, the stop loss points may be broken, leading to large losses. This needs to be controlled by properly adjusting ATR parameters and stop loss points.
In addition, ALPHA itself has some lagging. It may also generate incorrect signals around market turning points. Other indicators should be used to confirm the signals.
The AlphaTrend dual tracking strategy can be optimized in the following aspects:
- Combine with trend indicators to determine the major market trend to avoid trading against the trend;
- Increase volume filter to avoid losses caused by low volume false breakouts;
- Optimize indicator parameters to make the channel range more suitable for different products;
- Increase machine learning algorithms to make the channel more intelligent.
Through the above optimizations, the stability and profitability of the AlphaTrend strategy can be further improved.
In summary, the AlphaTrend dual tracking strategy is an effective way to track market changes. It solves the problem of traditional technical indicators losing effectiveness and also incorporates volume information to filter signals. With proper optimizations, this strategy can become a powerful tool in quantitative trading systems.
[/trans]
Strategy Arguments
| Argument | Default | Description |
|---|---|---|
| v_input_float_1 | true | Multiplier |
| v_input_1 | 14 | Common Period |
| v_input_2_close | 0 | src: close |
| v_input_3 | true | Show Signals? |
| v_input_4 | false | Change calculation (no volume data)? |
Source (PineScript)
/*backtest
start: 2024-01-02 00:00:00
end: 2024-02-01 00:00:00
period: 1h
basePeriod: 15m
exchanges: [{"eid":"Futures_Binance","currency":"BTC_USDT"}]
*/

// This source code is subject to the terms of the Mozilla Public License 2.0 at https://mozilla.org/MPL/2.0/
// author © KivancOzbilgic
// developer © KivancOzbilgic
//@version=5
strategy('AlphaTrend', shorttitle='AT', overlay=true, format=format.price, precision=2)
coeff = input.float(1, 'Multiplier', step=0.1)
AP = input(14, 'Common Period')
ATR = ta.sma(ta.tr, AP)
src = input(close)
showsignalsk = input(title='Show Signals?', defval=true)
novolumedata = input(title='Change calculation (no volume data)?', defval=false)
upT = low - ATR * coeff
downT = high + ATR * coeff
AlphaTrend = 0.0
AlphaTrend := (novolumedata ? ta.rsi(src, AP) >= 50 : ta.mfi(hlc3, AP) >= 50) ? upT < nz(AlphaTrend[1]) ? nz(AlphaTrend[1]) : upT : downT > nz(AlphaTrend[1]) ? nz(AlphaTrend[1]) : downT

color1 = AlphaTrend > AlphaTrend[2] ? #00E60F : AlphaTrend < AlphaTrend[2] ? #80000B : AlphaTrend[1] > AlphaTrend[3] ? #00E60F : #80000B
k1 = plot(AlphaTrend, color=color.new(#0022FC, 0), linewidth=3)
k2 = plot(AlphaTrend[2], color=color.new(#FC0400, 0), linewidth=3)

fill(k1, k2, color=color1)

buySignalk = ta.crossover(AlphaTrend, AlphaTrend[2])
sellSignalk = ta.crossunder(AlphaTrend, AlphaTrend[2])


K1 = ta.barssince(buySignalk)
K2 = ta.barssince(sellSignalk)
O1 = ta.barssince(buySignalk[1])
O2 = ta.barssince(sellSignalk[1])

//plotshape(buySignalk and showsignalsk and O1 > K2 ? AlphaTrend[2] * 0.9999 : na, title='BUY', text='BUY', location=location.absolute, style=shape.labelup, size=size.tiny, color=color.new(#0022FC, 0), textcolor=color.new(color.white, 0))

//plotshape(sellSignalk and showsignalsk and O2 > K1 ? AlphaTrend[2] * 1.0001 : na, title='SELL', text='SELL', location=location.absolute, style=shape.labeldown, size=size.tiny, color=color.new(color.maroon, 0), textcolor=color.new(color.white, 0))


longCondition = buySignalk and showsignalsk and O1 > K2
if (longCondition)

    strategy.entry("BUY", strategy.long, comment = "BUY ENTRY")

shortCondition = sellSignalk and showsignalsk and O2 > K1
if (shortCondition )

    strategy.entry("SELL", strategy.short, comment = "SELL ENTRY")


// alertcondition(buySignalk and O1 > K2, title='Potential BUY Alarm', message='BUY SIGNAL!')
// alertcondition(sellSignalk and O2 > K1, title='Potential SELL Alarm', message='SELL SIGNAL!')

// alertcondition(buySignalk[1] and O1[1] > K2, title='Confirmed BUY Alarm', message='BUY SIGNAL APPROVED!')
// alertcondition(sellSignalk[1] and O2[1] > K1, title='Confirmed SELL Alarm', message='SELL SIGNAL APPROVED!')


// alertcondition(ta.cross(close, AlphaTrend), title='Price Cross Alert', message='Price - AlphaTrend Crossing!')
// alertcondition(ta.crossover(low, AlphaTrend), title='Candle CrossOver Alarm', message='LAST BAR is ABOVE ALPHATREND')
// alertcondition(ta.crossunder(high, AlphaTrend), title='Candle CrossUnder Alarm', message='LAST BAR is BELOW ALPHATREND!')

// alertcondition(ta.cross(close[1], AlphaTrend[1]), title='Price Cross Alert After Bar Close', message='Price - AlphaTrend Crossing!')
// alertcondition(ta.crossover(low[1], AlphaTrend[1]), title='Candle CrossOver Alarm After Bar Close', message='LAST BAR is ABOVE ALPHATREND!')
// alertcondition(ta.crossunder(high[1], AlphaTrend[1]), title='Candle CrossUnder Alarm After Bar Close', message='LAST BAR is BELOW ALPHATREND!')
Detail
https://www.fmz.com/strategy/440836
Last Modified
2024-02-02 15:17:01
