Name
一目均衡策略Ichimoku-Equilibrium-Strategy
Author
ChaoZhang
Strategy Description
[trans]
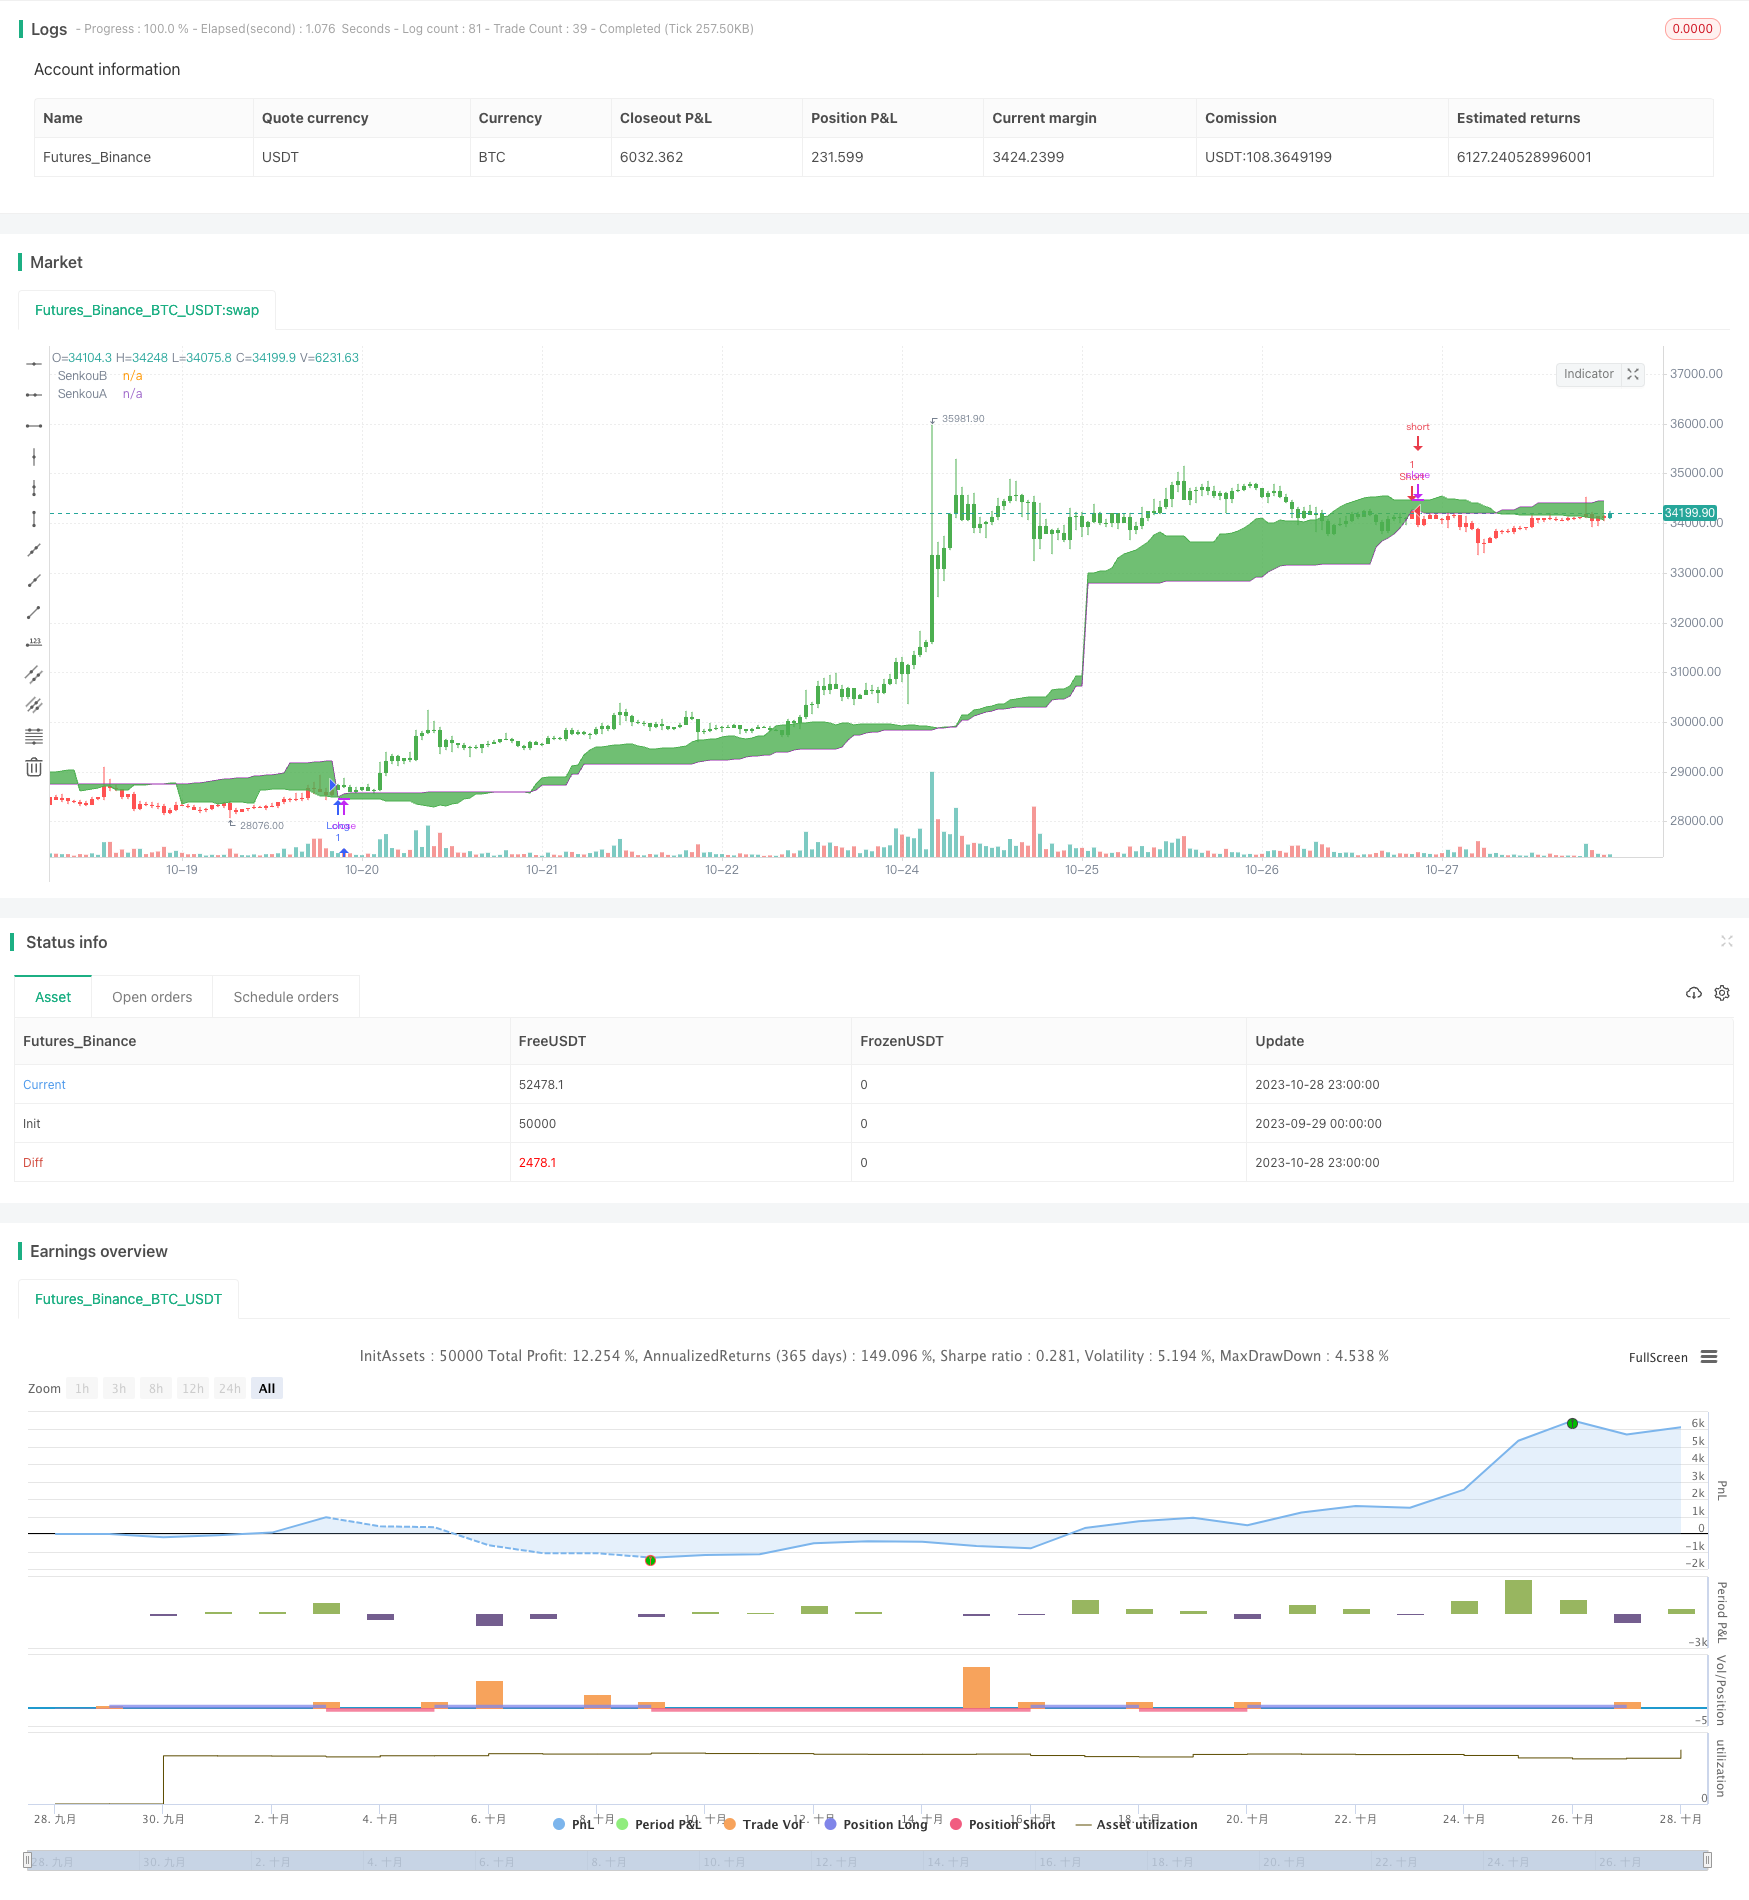
一目均衡策略基于Ichimoku技术指标,结合均线系统进行交易信号生成。该策略运用Tenkan、Kijun和Senkou线,判断价格动向和趋势,产生买入和卖出信号。
该策略使用middleDonchian函数计算Tenkan和Kijun两条均线。Tenkan线计算过去9根K线的最高价和最低价的平均值,代表短期均衡价。Kijun线计算过去26根K线的最高价和最低价的平均值,代表中期均衡价。
Senkou A线计算过去52根K线的最高价和最低价的平均值,再向后平移26根K线,代表长期未来先导。Senkou B线计算Tenkan线和Kijun线的平均值,代表当前价值中枢。
策略以close价格与Senkou A和Senkou B的关系判断价格相对强弱。当close价格上穿Senkou A线时为买入信号,下穿Senkou B线时为卖出信号。
pos变量记录当前持仓方向。possig变量根据reverse输入参数调整信号方向。最后根据pos和possig的值判断入场和出场。
-
使用两组不同参数长度的均线组合,捕捉不同时间周期上的趋势变化。
-
Senkou A线提前反映长期趋势变化,Senkou B线捕捉当下均衡点位移,形成先导系统。
-
根据price突破云图上下边界判断趋势明显转折点。
-
可适应趋势和震荡市场。reverse参数可快速适应多空切换。
-
云图/-/两线叉离散现象,可过滤假突破信号。
-
长短周期均线交叉时,可能产生错误信号。
-
震荡盘整理时,上下穿越云图边界可能频繁打开头寸。
-
云图叉离散导致的突破失效风险。
-
趋势 marketplace,追高买入/追低卖出风险。
-
反向操作需谨慎,应考虑大周期趋势方向。
可以通过调整均线参数组合、添加过滤条件等方式来优化,减少不必要的交易频率,避免被套。
-
优化均线参数组合,寻找最佳平衡点。
-
添加 VOL 指标过滤,避免低量的假突破。
-
结合别的指标作为辅助判断。如MACD, KDJ等。
-
优化入场时机。如突破云图时,再观察收盘价是否突破加强突破有效性。
-
优化止损方式。如追踪止损、间隔止损等。
-
优化反向交易策略。可根据大周期趋势决定反向空间。
一目均衡策略整合均线交易和云图分析的优势,在判断趋势转折点上具有独特优势。策略简单实用,适用于趋势及震荡市场,可通过参数优化适应不同品种和交易风格。但操作时需警惕假突破风险,应结合大周期分析确定操作方向。通过持续优化,可打造出稳定收益的指数化策略。
||
The Ichimoku Equilibrium strategy is based on the Ichimoku indicator and combines moving average systems to generate trading signals. It utilizes the Tenkan, Kijun and Senkou lines to determine price direction and trends, generating buy and sell signals.
The strategy uses the middleDonchian function to calculate the Tenkan and Kijun lines. The Tenkan line calculates the average of the highest and lowest prices over the past 9 bars, representing the short-term equilibrium price. The Kijun line calculates the average of the highest and lowest prices over the past 26 bars, representing the medium-term equilibrium price.
The Senkou A line calculates the average of the highest and lowest prices over the past 52 bars, then shifts forwards 26 bars, representing long-term future leading. The Senkou B line calculates the average of the Tenkan and Kijun lines, representing the current value midpoint.
The strategy judges the relative strength of prices by the relationship between the close price and the Senkou A and Senkou B lines. A close price breakout above the Senkou A line is a buy signal, while a breakout below the Senkou B line is a sell signal.
The pos variable tracks the current position direction. The possig variable adjusts the signal direction based on the reverse input parameter. Finally, entry and exit are determined according to the values of pos and possig.
-
Uses two sets of moving averages with different parameter lengths to capture trend changes across different timeframes.
-
Senkou A line reflects long-term trend changes in advance. Senkou B line captures current midpoint shifts, forming a leading system.
-
Identifies significant trend reversal points by price breakouts of the cloud boundaries.
-
Applicable to trending and ranging markets. The reverse parameter allows quick adaptation to long/short switching.
-
Cloud twist visuals filter out false breakouts.
-
Potential false signals when long and short moving averages cross over.
-
Frequent opening of positions when prices oscillate around cloud boundaries during consolidations.
-
Failed breakout risk due to cloud twists.
-
Chasing high purchases and low sales in trending markets.
-
Reversals require caution and consideration of major trends.
Optimization via adjusting moving average combinations, adding filters etc can reduce unnecessary trading frequency and avoid being trapped.
-
Optimize moving average combinations to find the best equilibrium point.
-
Add volume filter to avoid low volume false breakouts.
-
Incorporate other indicators for additional confirmation, e.g. MACD, KDJ etc.
-
Optimize entry timing, e.g. requiring close to also breakout after cloud breakout.
-
Optimize stop loss methods, e.g. trailing stop, staggered stop etc.
-
Optimize reverse trading rules based on major trends.
The Ichimoku Equilibrium strategy combines the strengths of moving average trading and cloud analysis for unique trend reversal identification. Simple and practical for trending and ranging markets, it can be adapted via optimization for different instruments and trading styles. But false breakout risks remain, so major trend analysis is key for determining direction. With continuous optimization, it can generate stable returns as a systematic strategy.
[/trans]
Strategy Arguments
| Argument | Default | Description |
|---|---|---|
| v_input_1 | 9 | conversionPeriods |
| v_input_2 | 26 | basePeriods |
| v_input_3 | 52 | laggingSpan2Periods |
| v_input_4 | 26 | displacement |
| v_input_5 | false | Trade reverse |
Source (PineScript)
/*backtest
start: 2023-09-29 00:00:00
end: 2023-10-29 00:00:00
period: 1h
basePeriod: 15m
exchanges: [{"eid":"Futures_Binance","currency":"BTC_USDT"}]
*/

//@version=2
////////////////////////////////////////////////////////////
//  Copyright by HPotter v1.0 26/09/2018
//  Ichimoku Strategy
//
// You can change long to short in the Input Settings
// WARNING:
// - For purpose educate only
// - This script to change bars colors.
////////////////////////////////////////////////////////////
middleDonchian(Length) =>
    lower = lowest(Length)
    upper = highest(Length)
    avg(upper, lower)

strategy(title="Ichimoku2c Backtest", shorttitle="Ichimoku2c", overlay = true)
conversionPeriods = input(9, minval=1),
basePeriods = input(26, minval=1)
laggingSpan2Periods = input(52, minval=1),
displacement = input(26, minval=1)
reverse = input(false, title="Trade reverse")
Tenkan = middleDonchian(conversionPeriods)
Kijun =  middleDonchian(basePeriods)
xChikou = close
SenkouA = middleDonchian(laggingSpan2Periods)
SenkouB = (Tenkan[basePeriods] + Kijun[basePeriods]) / 2
A = plot(SenkouA[displacement], color=purple, title="SenkouA")
B = plot(SenkouB, color=green, title="SenkouB")
pos = iff(close < SenkouA[displacement], -1,
       iff(close > SenkouB, 1, nz(pos[1], 0)))
possig = iff(reverse and pos == 1, -1,
          iff(reverse and pos == -1, 1, pos))
if (possig == 1)
    strategy.entry("Long", strategy.long)
if (possig == -1)
    strategy.entry("Short", strategy.short)
barcolor(possig == -1 ? red: possig == 1 ? green : blue )
fill(A, B, color=green)
Detail
https://www.fmz.com/strategy/430570
Last Modified
2023-10-30 14:45:40
