Name
一种基于移动平均线的趋势跟踪策略Golden-Cross-Moving-Average-Strategy
Author
ChaoZhang
Strategy Description
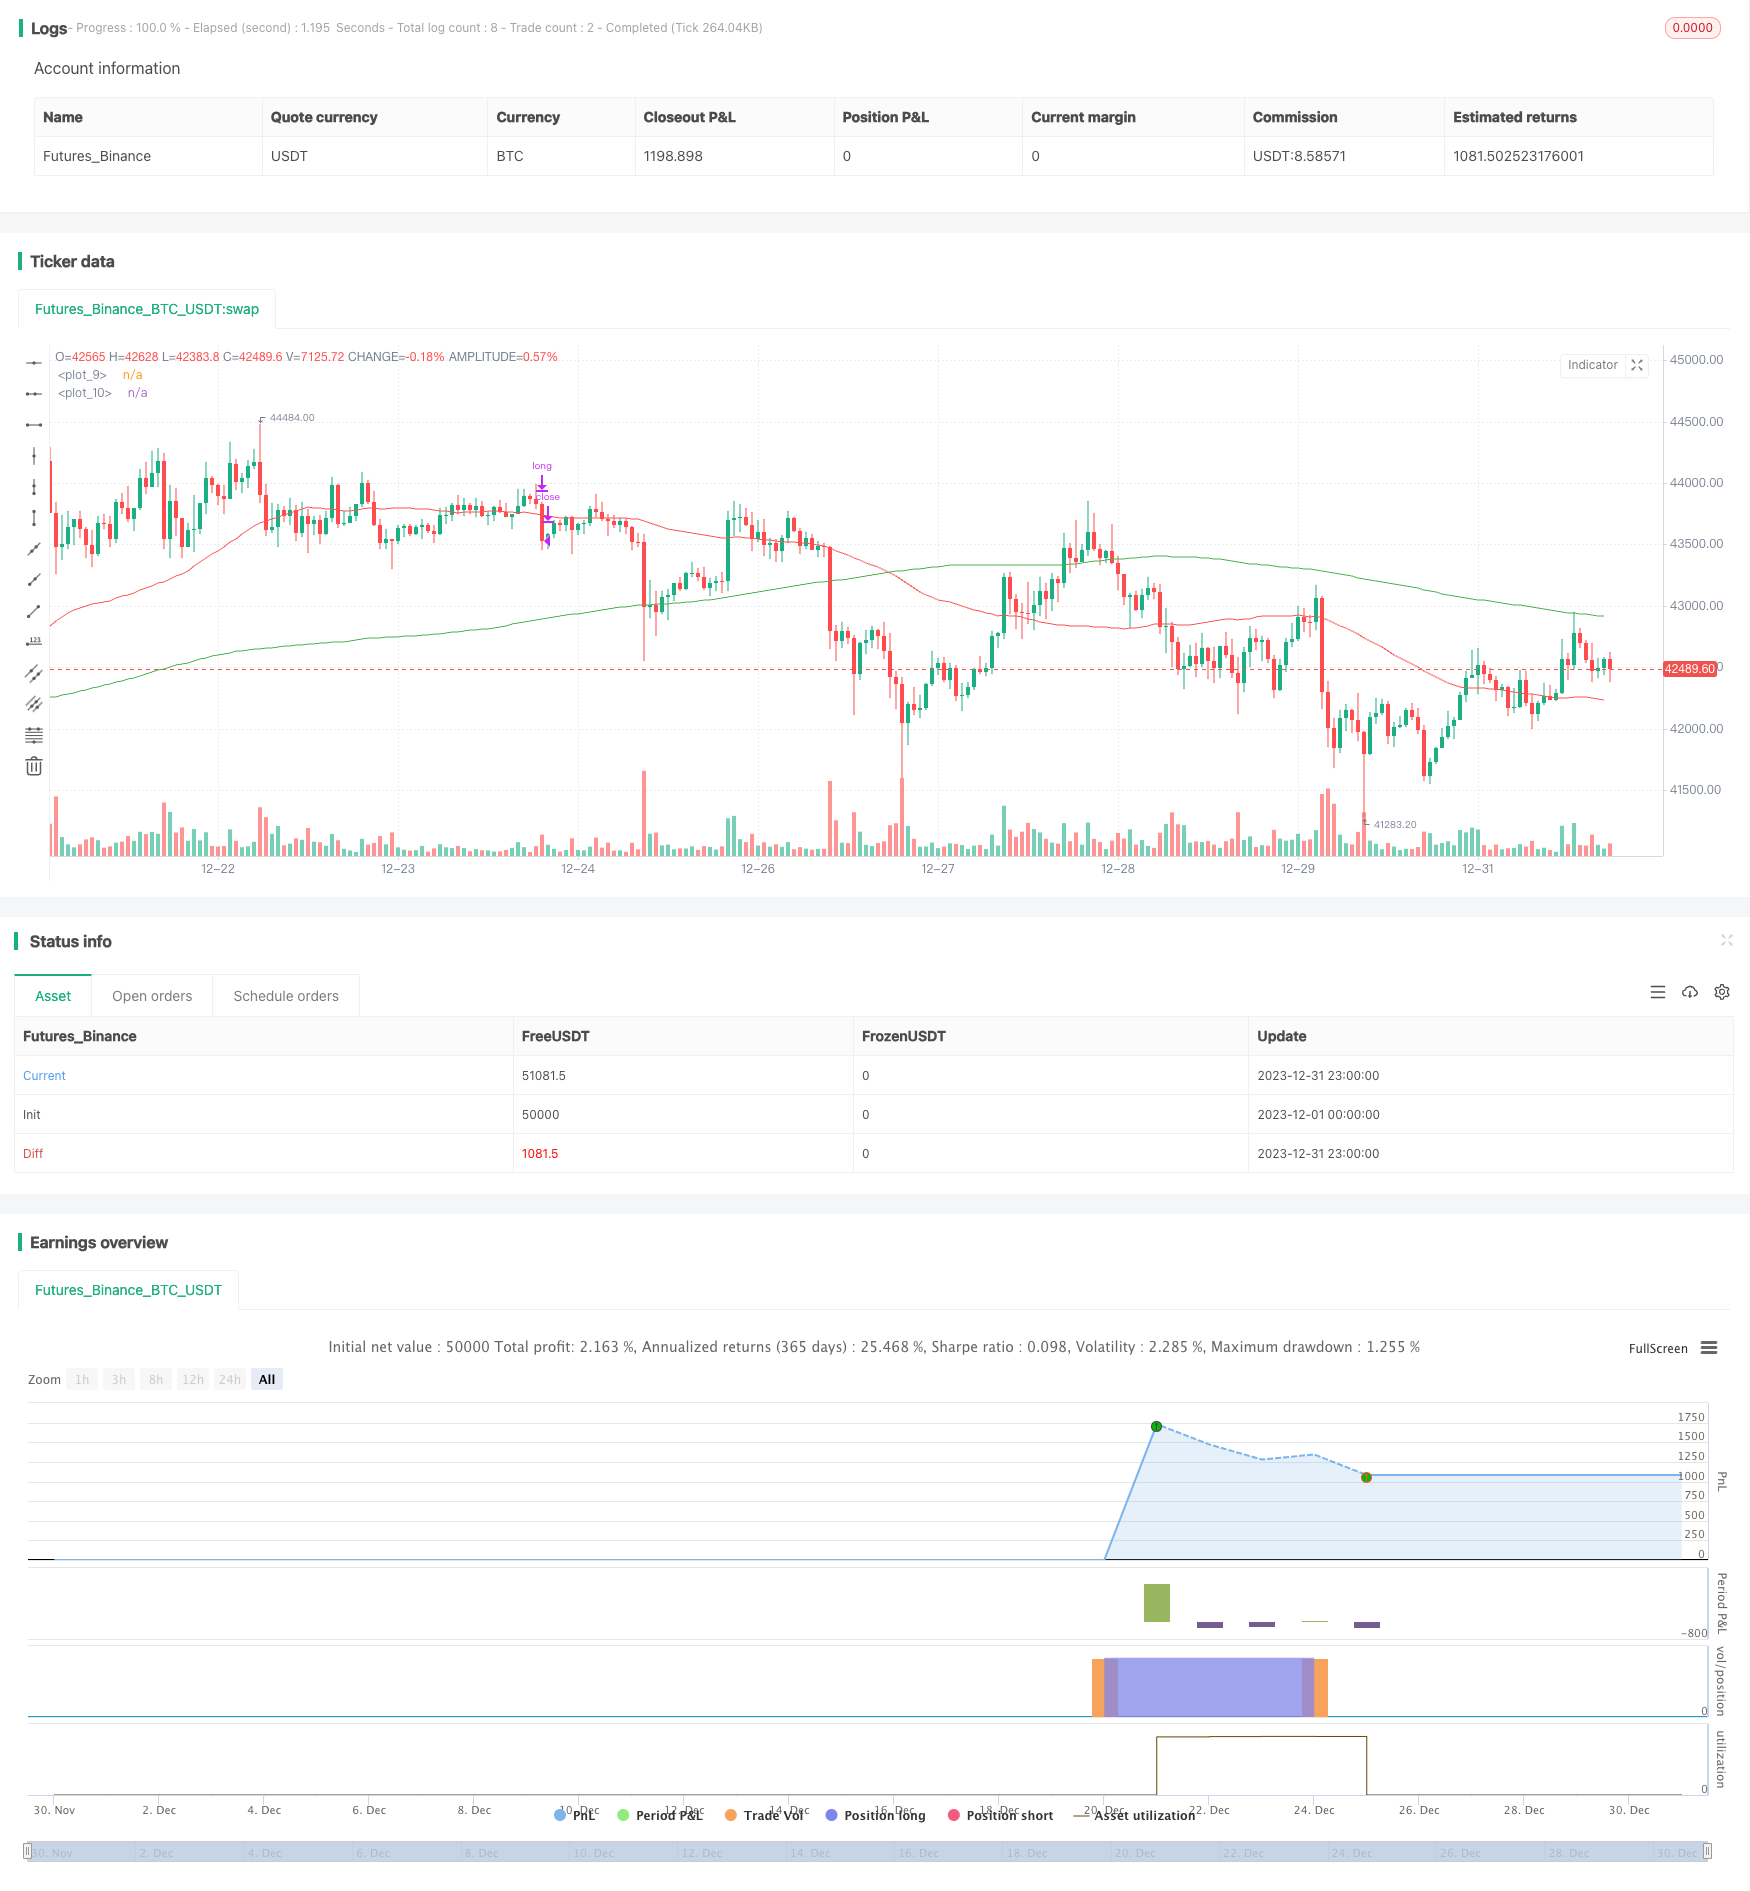
黄金交叉移动平均线策略是一种基于移动平均线的趋势跟踪策略。该策略通过计算不同周期的移动平均线,判断市场的趋势方向,并据此产生交易信号。具体来说,该策略计算50日线、100日线和200日线这三条移动平均线,当短期均线从下向上突破长期均线时,产生买入信号;当短期均线从上向下跌破长期均线时,产生卖出信号。
该策略的核心信号来自移动平均线的黄金交叉。所谓黄金交叉,是指短期移动平均线从下向上突破长期移动平均线,表明市场步入多头趋势的信号。该策略以50日线为短期均线,200日线为长期均线,等待两条均线发生黄金交叉时买入;以50日线为短期均线,100日线为长期均线,等待短期均线下穿长期均线时卖出,完成一次交易周期。
通过设置不同参数的移动平均线,可以更好地捕捉市场趋势的转折点。短期均线能更快地响应价格变化,反映最近期价格行情;长期均线对短期波动不敏感,可以确定主要趋势方向。两条均线间形成黄金交叉,可以有效确认趋势转折,产生交易信号。
该策略具有以下优势:
-
趋势跟踪能力强。双移动平均线策略可以顺应市场主要趋势,避免被短期市场噪音干扰,具有较强的趋势跟踪能力。
-
交易信号明确。策略完全依赖移动平均线的关系形成交易信号,信号产生和解释非常明确直接,避免主观判断错误。
-
容易实施回测。作为一种典型的趋势跟踪策略,该策略可以快速实施回测,评估策略效果。
-
可扩展空间大。移动平均线参数、交易品种、时间周期等都可以优化扩展,寻找更好的参数组合。
该策略也存在一些风险:
-
错过转折点。移动平均线本质具有滞后性,不能准确定位重要转折点,可能错过最佳买入时机。
-
产生多头假信号。短期内可能出现多次黄金交叉假信号,使投资者产生误判。
-
突发事件风险。重大突发事件可能导致市场产生剧烈波动,移动平均线策略难以应对这类异常情况。
-
大盘震荡风险。当市场长期处于宽幅震荡状态时,该策略可能产生过多无效信号,导致操作频繁但总体收益微弱。
这些风险可以通过调整移动平均线参数,设置止损策略,或与其他指标组合使用来规避。
该策略可以从以下几个方面进行优化:
-
优化移动平均线参数,找到最佳参数组合。可以测试更多周期参数,也可以引入三指数移动平均线等自适应均线。
-
增加止损策略,以控制单笔损失。移动止损或比例止损都可以避免损失进一步扩大。
-
结合其他指标过滤信号。双移动平均线信号可与成交量、波动率等指标组合,确保只在趋势性强的情况下产生交易。
-
利用机器学习技术进行策略优化。通过算法自动搜索更优的参数组合和交易规则,不断迭代提高策略收益率。
黄金交叉移动平均线策略通过计算双移动平均线的关系,判断市场主要趋势方向,以捕捉中长线趋势机会。该策略优点是信号判断规则清晰,容易实施和优化,适合中长线投资者使用。我们也应注意该策略的滞后性和可能产生的假信号,采取组合和优化措施来规避潜在风险。
||
The Golden Cross Moving Average strategy is a trend-following strategy based on moving averages. It determines the market trend direction by calculating moving averages of different periods and generates trading signals accordingly. Specifically, it calculates the 50-day, 100-day, and 200-day moving averages. When the short-term moving average crosses above the long-term moving average, a buy signal is generated. When the short-term moving average crosses below the long-term moving average, a sell signal is generated.
The core signal of this strategy comes from the golden cross of moving averages. The so-called golden cross refers to the short-term moving average crossing above the long-term moving average, indicating the market is entering a bullish trend. This strategy uses the 50-day moving average as the short-term MA and the 200-day moving average as the long-term MA. It buys when the two MAs form a golden cross and sells when the 50-day MA crosses below the 100-day MA to complete a trading cycle.
By setting moving averages of different periods, we can better capture the inflection points of market trends. The short-term MA responds faster to price changes and reflects recent price movements. The long-term MA is insensitive to short-term fluctuations and can determine the primary trend direction. The golden cross formed between the two MAs can effectively confirm the trend reversal and generate trading signals.
The advantages of this strategy are:
-
Strong trend following capability. The dual moving average strategy can follow the primary market trend, avoid being disturbed by short-term market noise, and has strong trend-following capability.
-
Clear trading signals. The strategy relies entirely on the relationship between moving averages to generate trading signals, making signal generation and interpretation very direct and unambiguous, avoiding subjective judgment errors.
-
Easy backtesting implementation. As a typical trend-following strategy, it can be quickly implemented for backtesting to evaluate the strategy's effectiveness.
-
Great scalability. Parameters like moving average periods, trading products, and time frames can all be optimized and expanded to find better parameter combinations.
The strategy also has some risks:
-
Missing inflection points. The inherent lagging of moving averages cannot accurately locate important inflection points and may miss the best buying opportunities.
-
Generating false bullish signals. There may be multiple golden crosses forming false signals in the short term, causing investors to make wrong judgements.
-
Risks of sudden events. Major sudden events can cause drastic market fluctuations that moving average strategies may fail to cope with.
-
Risks of range-bound markets. When the market is range-bound for an extended period, the strategy may generate excessive invalid signals, resulting in frequent trading but overall meager profitability.
These risks can be mitigated by adjusting moving average parameters, setting stop losses, or combining with other indicators.
The strategy can be optimized in the following aspects:
-
Optimize moving average parameters to find the best combinations. More cycle parameters can be tested. Adaptive moving averages like triple exponential moving averages can also be introduced.
-
Add stop loss strategies to control single loss. Both trailing stop loss and proportional stop loss can avoid further loss expansion.
-
Combine other indicators to filter signals. Dual moving average signals can be combined with indicators like volume and volatility to ensure signals are only generated when the trend is strong.
-
Utilize machine learning techniques to optimize the strategy. The algorithms can automatically search for more optimal parameter sets and trading rules to continuously improve the strategy's profitability.
The Golden Cross Moving Average strategy determines the primary market trend direction by calculating the relationship between dual moving averages, trying to capture mid-to-long term trend opportunities. The advantages are clear signal rules that are easy to implement and optimize. It is suitable for mid-to-long term investors. We should also note the lagging limitation and possible false signals of this strategy and take combination and optimization measures to mitigate potential risks.
[/trans]
Source (PineScript)
/*backtest
start: 2023-12-01 00:00:00
end: 2023-12-31 23:59:59
period: 1h
basePeriod: 15m
exchanges: [{"eid":"Futures_Binance","currency":"BTC_USDT"}]
*/

//@version=4
strategy(title="MA Cross", overlay=true)
short = sma(close, 50)
short1 = sma(close[5], 50)
medium = sma(close, 100)
long = sma(close, 200)
long1 = sma(close[5], 200)

plot(short, color = color.red)
plot(long, color = color.green)
trendUp = (cross(short, long) and (long1 > short1) ? true : false)
x = if (trendUp)
    (long1 - short1)*5
else
    0

//start     = timestamp(2000, 01, 01, 00, 00)        // backtest start window
//finish    = timestamp(2020, 02, 09, 23, 59)        // backtest finish window
//window()  => time >= start and time <= finish ? true : false

//strategy.entry("long", true, 1000, limit = high, when = window() and trendUp)
//strategy.close("long", when = window() and close < medium)

strategy.entry("long", true, 1, limit = high, when = trendUp)
strategy.close("long", when = close < medium)
Detail
https://www.fmz.com/strategy/440074
Last Modified
2024-01-26 14:23:55
