Name
三均线交叉动量策略Three-SMA-Crossover-Momentum-Strategy
Author
ChaoZhang
Strategy Description
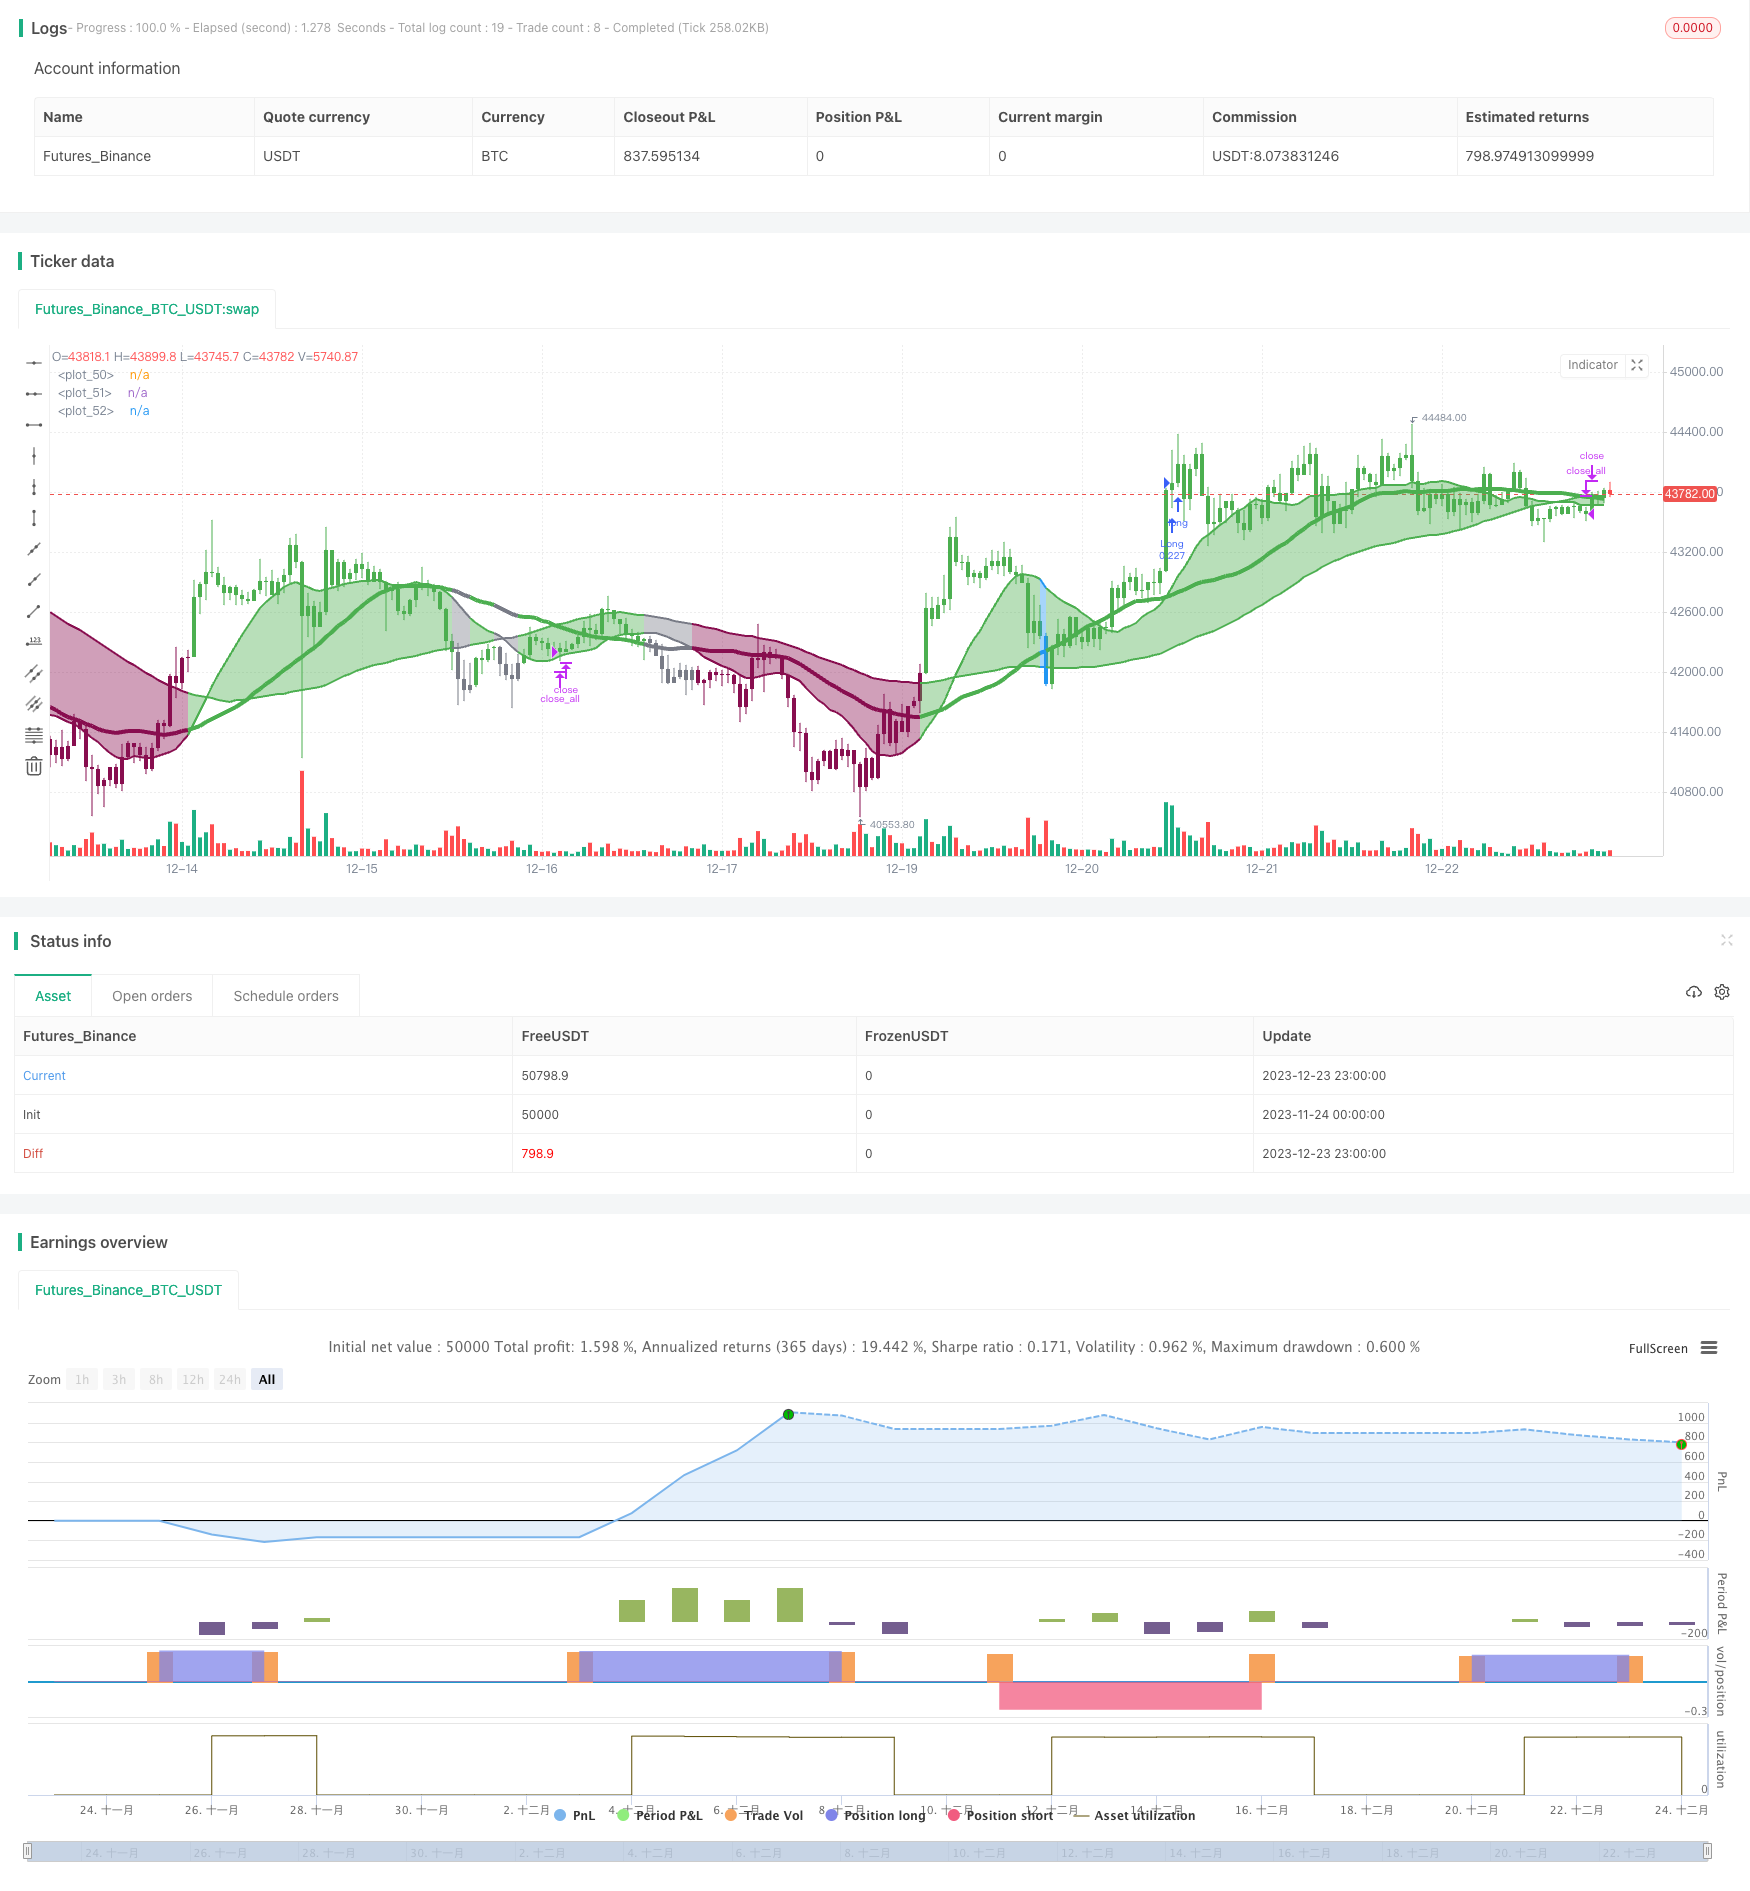
三均线交叉动量策略是一种典型的跟踪市场趋势的技术指标策略。它结合了16周期、36周期和72周期的三条简单移动平均线,通过它们的多头交叉和空头交叉来判断市场趋势,并结合考夫曼自适应移动平均线作为过滤器,在趋势方向比较明确时,采取做多或做空的操作。
该策略的核心指标是16周期、36周期和72周期三条简单移动平均线。当短周期均线上穿较长周期的均线时,表明市场进入多头趋势;当短周期均线下穿较长周期均线时,表明市场进入空头趋势。例如,16均线上穿36均线和72均线时,为多头信号;16均线下穿36均线和72均线时,为空头信号。
考夫曼自适应移动平均线(KAMA)被用作过滤器,来避免在趋势不明确的情况下出现错误信号。只有在KAMA处于非加速或非减速模式下(即线性段落),均线交叉信号才会被激活执行。
策略通过跟踪均线的交叉情况,在趋势较为明朗时,采取做多或做空的操作。做多条件是16均线上穿36均线和72均线,且KAMA线性(非加速);做空条件是16均线下穿36均线和72均线,且KAMA线性(非减速)。
该策略具有如下优势:
- 结合多时间段均线,可以有效跟踪市场中长线趋势
- 引入自适应移动平均线作为过滤器,可以减少趋势不明确时的错误信号
- 操作简单,容易实施,适合自动或程序化交易
该策略也存在一些风险:
- 在震荡行情中,均线交叉可能频繁出现,会产生过多无效信号
- 没有设置止损,亏损可能扩大
- 针对加密货币等高波动市场设计,波动小的市场效果可能不佳
可以通过适当调整均线参数,设置止损约束,或只在波动较大的市场使用该策略来降低风险。
该策略可以通过以下方式进行优化:
- 测试不同的均线参数组合,找到最优参数
- 增加成交量或波动率指标作为辅助过滤条件
- 设置止损机制
- 结合其他指标判断进场时机
- 优化仓位管理,通过逐步加仓和减仓调整风险
三均线交叉动量策略整体来说是一个较为经典和实用的跟踪趋势型策略。它通过多时间段均线的交叉来判断市场中长线走势,并有效过滤了部分噪音。可以作为选时交易的参考指标之一。但该策略也存在一定弱点,需要进一步扩展和优化,才能在更广泛的市场中立足。
||
The Three SMA Crossover Momentum strategy is a typical technical indicator strategy that tracks market trends. It combines 16-, 36- and 72-period simple moving averages and uses their bullish and bearish crossovers to determine market trends, together with the Kaufman Adaptive Moving Average (KAMA) as a filter to take long or short positions when the trend direction is relatively clear.
The core indicators of this strategy are the 16-, 36-, and 72-period simple moving averages. When the shorter-period SMA crosses over the longer-period one upwards, it signals that the market is entering an uptrend. When the shorter-period SMA crosses below the longer-period one downwards, it signals that the market is entering a downtrend. For example, when the 16-SMA crosses over the 36-SMA and 72-SMA, it is a bullish signal. And when the 16-SMA crosses below the 36-SMA and 72-SMA, it is a bearish signal.
The Kaufman Adaptive Moving Average (KAMA) serves as a filter to avoid wrong signals when the trend is unclear. The SMA crossover signals are only triggered when KAMA is in a non-accelerating or non-decelerating mode (linear phase).
The strategy tracks the SMA crossover situations to take long or short positions when the trend is relatively clear. The long condition is 16-SMA crossing over 36-SMA and 72-SMA with linear KAMA. The short condition is 16-SMA crossing below 36-SMA and 72-SMA with linear KAMA.
The advantages of this strategy are:
- Combining multi-period SMAs can effectively track medium- and long-term market trends
- Introducing adaptive moving average as a filter can reduce wrong signals when the trend is unclear
- Simple to implement, suitable for automated or program trading
There are also some risks with this strategy:
- Frequent ineffective signals may occur in ranging markets due to frequent SMA crossovers
- No stop loss is set, losses may expand
- Designed for high volatile crypto markets, may underperform in less volatile markets
The risks could be reduced by tuning SMA parameters, setting stop loss constraints, or only applying to highly volatile markets.
The strategy can be optimized in the following ways:
- Test different combinations of SMA parameters to find the optimal
- Add trading volume or volatility indicators as supplementary filter conditions
- Set up stop loss mechanisms
- Combine other indicators to determine entry timing
- Optimize position sizing, adjust risks through gradual adding and reducing positions
The Three SMA Crossover Momentum strategy is a rather classic and practical trend-following strategy overall. It judges medium- and long-term market trends effectively through multi-period SMA crossovers and filters out some noise. It can serve as one of the timing reference indicators for positional trading. But this strategy also has some weaknesses, requiring further enhancements and optimizations to stand in more diverse markets.
[/trans]
Strategy Arguments
| Argument | Default | Description |
|---|---|---|
| v_input_int_4 | 100 | Trend SMA |
| v_input_int_5 | 50 | KAMA Lenght |
| v_input_bool_1 | true | Self Powered |
| v_input_int_1 | 16 | (?SMA) 1-SMA Lenght |
| v_input_int_2 | 36 | 2-SMA Lenght |
| v_input_int_3 | 72 | 3-SMA Lenght |
Source (PineScript)
/*backtest
start: 2023-11-24 00:00:00
end: 2023-12-24 00:00:00
period: 1h
basePeriod: 15m
exchanges: [{"eid":"Futures_Binance","currency":"BTC_USDT"}]
*/

// This source code is subject to the terms of the Mozilla Public License 2.0 at https://mozilla.org/MPL/2.0/
// © Wielkieef


//@version=5
strategy(title='Three SMA-crossover strategy [30min] ', overlay=true, pyramiding=1, initial_capital=10000, default_qty_type=strategy.cash, default_qty_value=10000, calc_on_order_fills=false, slippage=0, commission_type=strategy.commission.percent, commission_value=0.03)

src = close

Length1 = input.int(16, title='  1-SMA Lenght', minval=1, group='SMA')
Length2 = input.int(36, title='  2-SMA Lenght', minval=1, group='SMA')
Length3 = input.int(72, title='  3-SMA Lenght', minval=1, group='SMA')
SMA1 = ta.sma(close, Length1)
SMA2 = ta.sma(close, Length2)
SMA3 = ta.sma(close, Length3)

Long_ma = SMA1 > SMA2 and SMA2 > SMA3
Short_ma = SMA1 < SMA2 and SMA2 < SMA3

LengthMainSMA = input.int(100, title='  Trend SMA ', minval=1)

SMAas = ta.sma(src, LengthMainSMA)

//  Powered Kaufman Adaptive Moving Average by alexgrover (modificated by Wielkieef)
lengthas = input.int(50, title='   KAMA Lenght')
sp = input.bool(true, title='  Self Powered')

er = math.abs(ta.change(close, lengthas)) / math.sum(math.abs(ta.change(close)), lengthas)
pow = sp ? 1 / er : 2
per = math.pow(math.abs(ta.change(close, lengthas)) / math.sum(math.abs(ta.change(close)), lengthas), pow)
a = 0.
a := per * src + (1 - per) * nz(a[1], src)
mad4h = 0.
a_f = a / a[1] > .999 and a / a[1] < 1.001

///.

Bar_color = close > SMAas ? color.green : Long_ma ? color.blue : Short_ma ? color.maroon : color.gray

barcolor(color=Bar_color)

long_cond = Long_ma and SMAas < close and not a_f and close > a

short_cond = Short_ma and SMAas > close and not a_f and close < a

long_stop = Short_ma and SMAas < close

short_stop = Long_ma and SMAas > close

SMA1plot = plot(SMA1, color=Bar_color, linewidth=2)
SMA2plot = plot(SMA2, color=Bar_color, linewidth=4)
SMA3plot = plot(SMA3, color=Bar_color, linewidth=2)

fill(SMA1plot,SMA3plot,title="RANGE " ,color = color.new(Bar_color, 50))


if  long_cond
    strategy.entry('Long', strategy.long)

if  short_cond
    strategy.entry('Short', strategy.short)

strategy.close_all(when=long_stop or short_stop)


//by wielkieef
Detail
https://www.fmz.com/strategy/436491
Last Modified
2023-12-25 12:06:36
