Name
三平滑移动平均线策略Triple-Moving-Average-Crossover-Strategy
Author
ChaoZhang
Strategy Description
[trans]
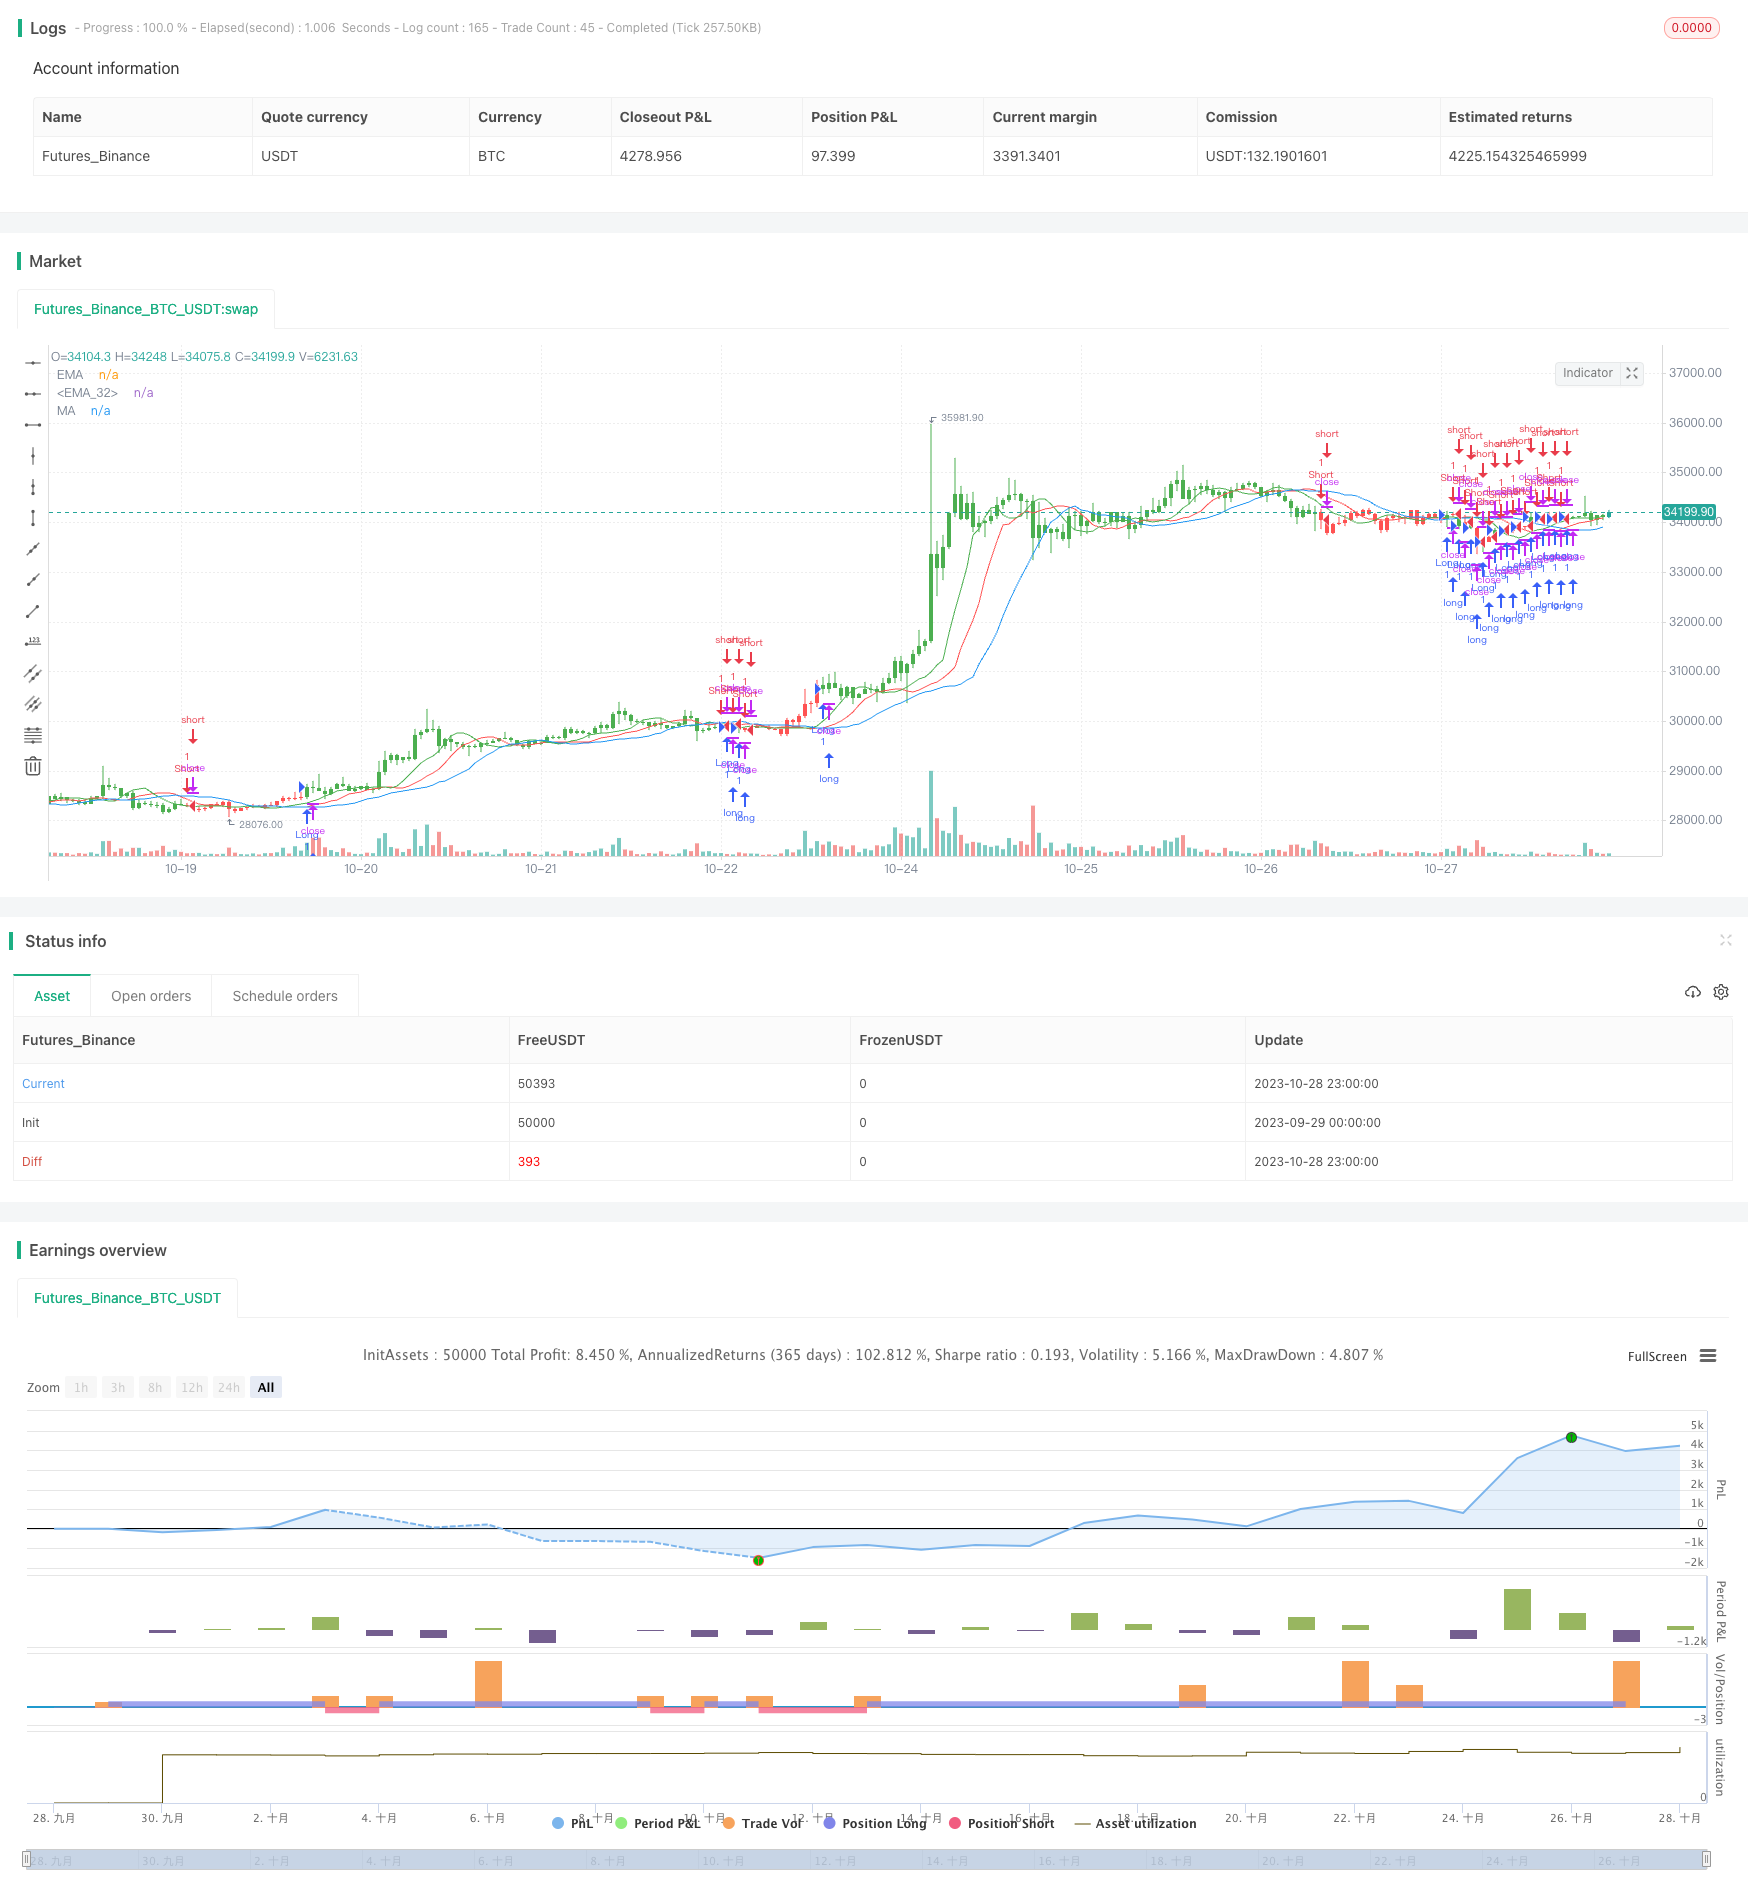
该策略运用三条不同参数设置的平滑移动平均线,实现对价格趋势的判断和跟踪。当短期移动平均线上穿中期线,中期线上穿长期线时做多;当短期移动平均线下穿中期线,中期线下穿长期线时做空。
-
计算三条平滑移动平均线:长期线长度13周期,位移8周期;中期线长度8周期,位移5周期;短期线长度5周期,位移3周期。均使用收盘价的中值计算。
-
比较三线的大小关系:当短期线上穿中期线,中期线上穿长期线时,做多;当短期线下穿中期线,中期线下穿长期线时,做空。
-
可选择反向交易。
-
绘图显示三条移动平均线。
-
使用三条移动平均线,能对趋势进行多层判定,提高信号的可靠性。
-
不同周期线的组合,既考虑了短期动量,也兼顾了中长期趋势。
-
采用收盘价中值计算移动平均线,能减少假突破。
-
线的位移设置区分突破的力度,避免 Whipsaws。
-
可选择反向交易,适应不同市场环境。
-
多条移动平均线组合使用需要参数优化,不当设置可能降低信号质量。
-
短线上穿中线不一定代表趋势转折,需要进一步确认。
-
三线交叉信号可能滞后,需要结合其他指标判断入场时机。
-
反向交易时,需要警惕止损位置,降低风险。
-
优化移动平均线的长度和位移参数,使其更符合不同周期行情。
-
增加其他指标过滤,如交易量能量指标,提高信号的可靠性。
-
优化止损策略,设置合理的止损位置。
-
结合趋势线和支撑阻力位辅助判断。
该策略通过三条不同长度和位移的移动平均线组合,实现对趋势转折的判断。使用多条移动平均线能提高信号质量,不同周期线的配合兼顾短中长期特征。参数优化、指标过滤、止损策略等都能进一步增强策略的稳定性和实战效果。
||
This strategy uses three moving average lines with different parameter settings to determine and follow price trends. It goes long when the short period MA crosses over the medium period MA and the medium period MA crosses over the long period MA, and goes short when the opposite crosses occur.
-
Calculate three smoothed moving average lines: long period of 13 bars with displacement of 8 bars; medium period of 8 bars with displacement of 5 bars; short period of 5 bars with displacement of 3 bars. All use the median of close prices.
-
Compare the relationship between the three lines: go long when short MA crosses over medium MA and medium MA crosses over long MA; go short when opposite crosses occur.
-
Option to trade in reverse direction.
-
Plot the three moving average lines.
-
Using three MAs provides multi-layer trend determination and improves signal reliability.
-
Combination of different period lines considers both short-term momentum and mid-long term trends.
-
Median price reduces false breakouts.
-
Line displacements distinguish breakout strength and avoid whipsaws.
-
Option for reverse trading adapts to different market regimes.
-
Multiple MA combinations require parameter optimization, improper settings may degrade signal quality.
-
Short MA crossovers do not certainly imply trend changes. Further confirmation needed.
-
Crossover signals may lag, other indicators should assist in timing entry.
-
Reverse trading requires caution on stop loss to limit risks.
-
Optimize MA lengths and displacements to fit different period cycles.
-
Add other indicators like volume for signal filtering and reliability.
-
Optimize stop loss strategies with proper positioning.
-
Incorporate trendlines and support/resistance for additional context.
This strategy determines trend reversals using a combination of MAs of varying lengths and displacements. Using multiple MAs improves signal quality, while different period MAs incorporate short, medium and long term features. Parameter optimization, signal filtering, stop loss and other enhancements can further improve robustness and real-world performance.
[/trans]
Strategy Arguments
| Argument | Default | Description |
|---|---|---|
| v_input_1 | 13 | LLength |
| v_input_2 | 8 | MLength |
| v_input_3 | 5 | SLength |
| v_input_4 | 8 | LOffset |
| v_input_5 | 5 | MOffset |
| v_input_6 | 3 | SOffset |
| v_input_7 | false | Trade reverse |
Source (PineScript)
/*backtest
start: 2023-09-29 00:00:00
end: 2023-10-29 00:00:00
period: 1h
basePeriod: 15m
exchanges: [{"eid":"Futures_Binance","currency":"BTC_USDT"}]
*/

//@version=2
////////////////////////////////////////////////////////////
//  Copyright by HPotter v1.0 01/02/2017
// This indicator calculates 3 Moving Averages for default values of
// 13, 8 and 5 days, with displacement 8, 5 and 3 days: Median Price (High+Low/2).
// The most popular method of interpreting a moving average is to compare
// the relationship between a moving average of the security's price with
// the security's price itself (or between several moving averages).
////////////////////////////////////////////////////////////
strategy(title="Bill Williams Averages. 3Lines", shorttitle="3 Lines", overlay = true)
LLength = input(13, minval=1)
MLength = input(8,minval=1)
SLength = input(5,minval=1)
LOffset = input(8,minval=1)
MOffset = input(5,minval=1)
SOffset = input(3,minval=1)
reverse = input(false, title="Trade reverse")
xLSma = sma(hl2, LLength)[LOffset]
xMSma = sma(hl2, MLength)[MOffset]
xSSma = sma(hl2, SLength)[SOffset]
pos = iff(close < xSSma and xSSma < xMSma and xMSma < xLSma, -1,
	   iff(close > xSSma and xSSma > xMSma and xMSma > xLSma, 1, nz(pos[1], 0)))
possig = iff(reverse and pos == 1, -1,
          iff(reverse and pos == -1, 1, pos))
if (possig == 1)
    strategy.entry("Long", strategy.long)
if (possig == -1)
    strategy.entry("Short", strategy.short)
barcolor(possig == -1 ? red: possig == 1 ? green : blue )
plot(xLSma, color=blue, title="MA")
plot(xMSma, color=red, title="EMA")
plot(xSSma, color=green, title="EMA")
Detail
https://www.fmz.com/strategy/430590
Last Modified
2023-10-30 16:38:01
