Name
买入低点-MA200优化策略Buying-Dips-MA200-Optimized-Strategy
Author
ChaoZhang
Strategy Description
[trans]
该策略将逆向交易方法(买入低点)与趋势跟踪逻辑(只有当价格高于MA200时)相结合。策略旨在找到购买资产低点时获利最可能的最佳时机。长期移动平均线上方的价格表示提高了从购买短期价格疲软的资产中获利的可能性。
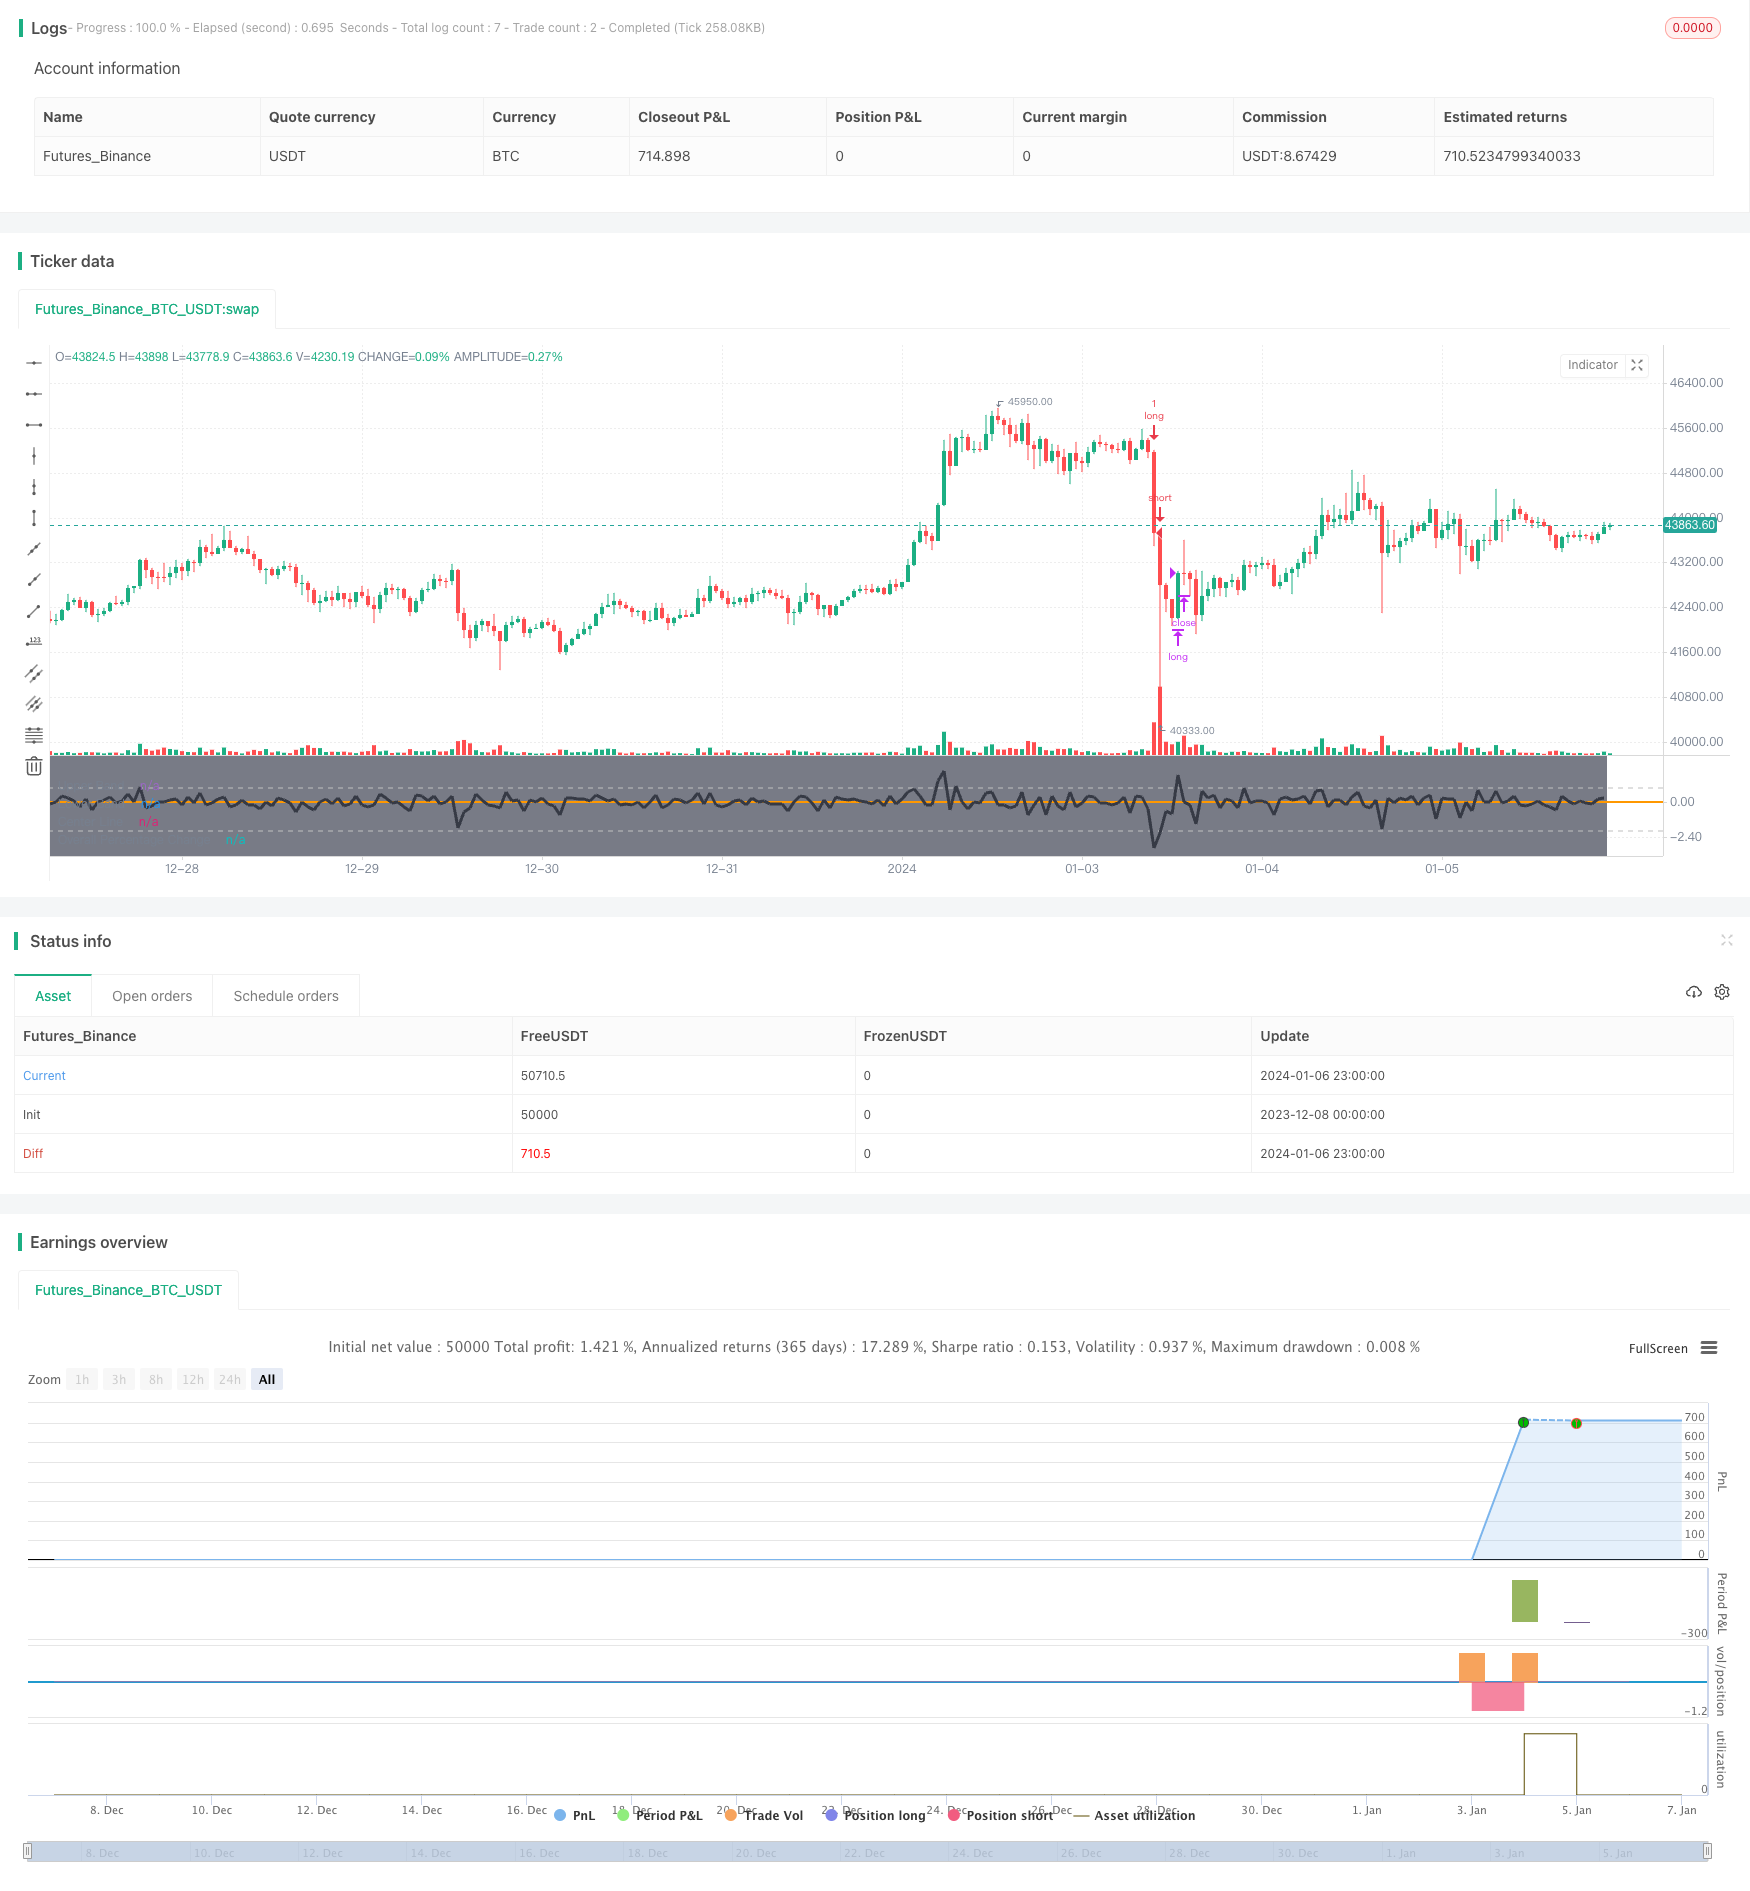
该策略通过计算价格在回顾期内的总体变化百分比,来判断价格是否处于相对低点。当总体变化百分比小于-3%时,认为价格处于低点。此外,策略还设置了200天简单移动平均线作为判断趋势的指标。只有当价格高于200天移动平均线时,才会发出买入信号。这样,策略同时利用MEAN回归原理,以及多空配对原理,在趋势向上时买入低点,实现获利。
该策略结合了趋势交易和逆向交易的优点。一方面,使用长期移动平均线判断趋势,避免在趋势下降期间盲目买入。另一方面,逆向买入低点又使其能在短期调整的时候获得较好的入场时机。这两者的结合,既保证了交易的安全性,也提高了获利概率。此外,策略参数优化空间大,可根据不同市场调整参数,具有较强的适应性。
该策略最大的风险在于买入信号发出后,价格可能继续下跌,导致亏损扩大。此外,如果市场长期横盘,价格无法突破移动平均线,也会导致策略失效。为降低这些风险,可适当缩短移动平均线周期,并优化买入条件,确保有足够的安全边际。
该策略可从以下几个方面进行优化:1)优化移动平均线周期,适应不同市场;2)优化买入条件,确保有足够边际;3)增加止损策略,控制亏损;4)结合其他指标判断趋势及低点,提高准确性。
该策略整体来说是一种典型的结合趋势跟踪和逆向交易思想的策略。它既保证了交易安全性,也提高了获利概率。具有较强的实战价值。通过参数优化和止损策略优化,可以进一步增强策略稳定性和实战效果。
||
This strategy combines a contrarian approach (buying dips) with trend-following logic (only when the price is above the MA200). The strategy aims to find the best timing to buy dips that is most likely to be profitable. The price above the long-term moving average indicates momentum that increases the possibility of profiting from buying assets during short-term weakness.
This strategy calculates the overall percentage change of the price over the lookback period to determine if the price is at a relative dip. When the overall change percentage is below -3%, the price is considered at the dip. In addition, the strategy also sets the 200-day simple moving average as an indicator to judge the trend. Buy signals are only triggered when the price is above the 200-day moving average. By utilizing both the mean reversion principle and long-short pairing, the strategy buys the dip during an upward trend to make a profit.
This strategy combines the advantages of both trend trading and contrarian trading. On one hand, using the long-term moving average to determine the trend avoids blindly buying during a downward trend. On the other hand, buying dips provides better entry opportunities during short-term corrections. The combination ensures both trading security and higher profit probability. Moreover, the strategy has large optimization space for parameters that can be adjusted to fit different markets, giving it strong adaptability.
The biggest risk is that the price may continue to decline after the buy signal triggers, leading to enlarged losses. In addition, if the market remains range-bound for a long time and the price fails to break through the moving average, the strategy would also fail. To mitigate such risks, the moving average period could be shortened accordingly and buy criteria can be optimized to ensure sufficient margin of safety.
The strategy can be optimized in several aspects: 1) optimize the moving average period to adapt to different markets; 2) optimize buy criteria to ensure sufficient margin; 3) add stop loss to control losses; 4) combine other indicators to judge trend and dips to improve accuracy.
In general, this is a typical strategy that combines trend following and contrarian trading ideas. It ensures both trading security and higher winning probability, with strong practical value. Further enhancements on stability and real trading effects can be achieved through parameter optimization and stop loss optimization.
[/trans]
Strategy Arguments
| Argument | Default | Description |
|---|---|---|
| v_input_1 | 100 | MA |
| v_input_2 | true | Lookback Period |
| v_input_3 | true | From Month |
| v_input_4 | true | From Day |
| v_input_5 | 2020 | From Year |
| v_input_6 | true | Thru Month |
| v_input_7 | true | Thru Day |
| v_input_8 | 2112 | Thru Year |
| v_input_9 | true | Show Date Range |
Source (PineScript)
/*backtest
start: 2023-12-08 00:00:00
end: 2024-01-07 00:00:00
period: 1h
basePeriod: 15m
exchanges: [{"eid":"Futures_Binance","currency":"BTC_USDT"}]
*/

//@version=4
strategy("Buy The Dips - MA200 Optimised", overlay=false)

//Moving average
MAinp = input(defval = 100, title = "MA", type = input.integer, minval = 1, step = 1)
MA=sma(close, MAinp)

//Percent change
inp_lkb = input(1, title='Lookback Period')

perc_change(lkb) =>
    overall_change = ((close[0] - close[lkb]) / close[lkb]) * 100

// Call the function
overall = perc_change(inp_lkb)

// === INPUT BACKTEST RANGE ===
fromMonth = input(defval = 1,    title = "From Month",      type = input.integer, minval = 1, maxval = 12)
fromDay   = input(defval = 1,    title = "From Day",        type = input.integer, minval = 1, maxval = 31)
fromYear  = input(defval = 2020, title = "From Year",       type = input.integer, minval = 1970)
thruMonth = input(defval = 1,    title = "Thru Month",      type = input.integer, minval = 1, maxval = 12)
thruDay   = input(defval = 1,    title = "Thru Day",        type = input.integer, minval = 1, maxval = 31)
thruYear  = input(defval = 2112, title = "Thru Year",       type = input.integer, minval = 1970)

showDate  = input(defval = true, title = "Show Date Range", type = input.bool)

start     = timestamp(fromYear, fromMonth, fromDay, 00, 00)        // backtest start window
finish    = timestamp(thruYear, thruMonth, thruDay, 23, 59)        // backtest finish window
window()  => true       // create function "within window of time"

//Entry/Exit
strategy.entry(id="long", long = true, when = window() and overall<-3 and close > MA)
strategy.close(id="long", when = window() and overall>1)


bgcolor(color = showDate and window() ? color.gray : na, transp = 90)
plot(overall, color=color.black, title='Overall Percentage Change', linewidth=3)
band1 = hline(1, "Upper Band", color=#C0C0C0)
band0 = hline(-2, "Lower Band", color=#C0C0C0)
fill(band1, band0, color=#9915FF, transp=90, title="Background")
hline(0, title='Center Line', color=color.orange, linestyle=hline.style_solid, linewidth=2)
Detail
https://www.fmz.com/strategy/438063
Last Modified
2024-01-08 16:54:21
