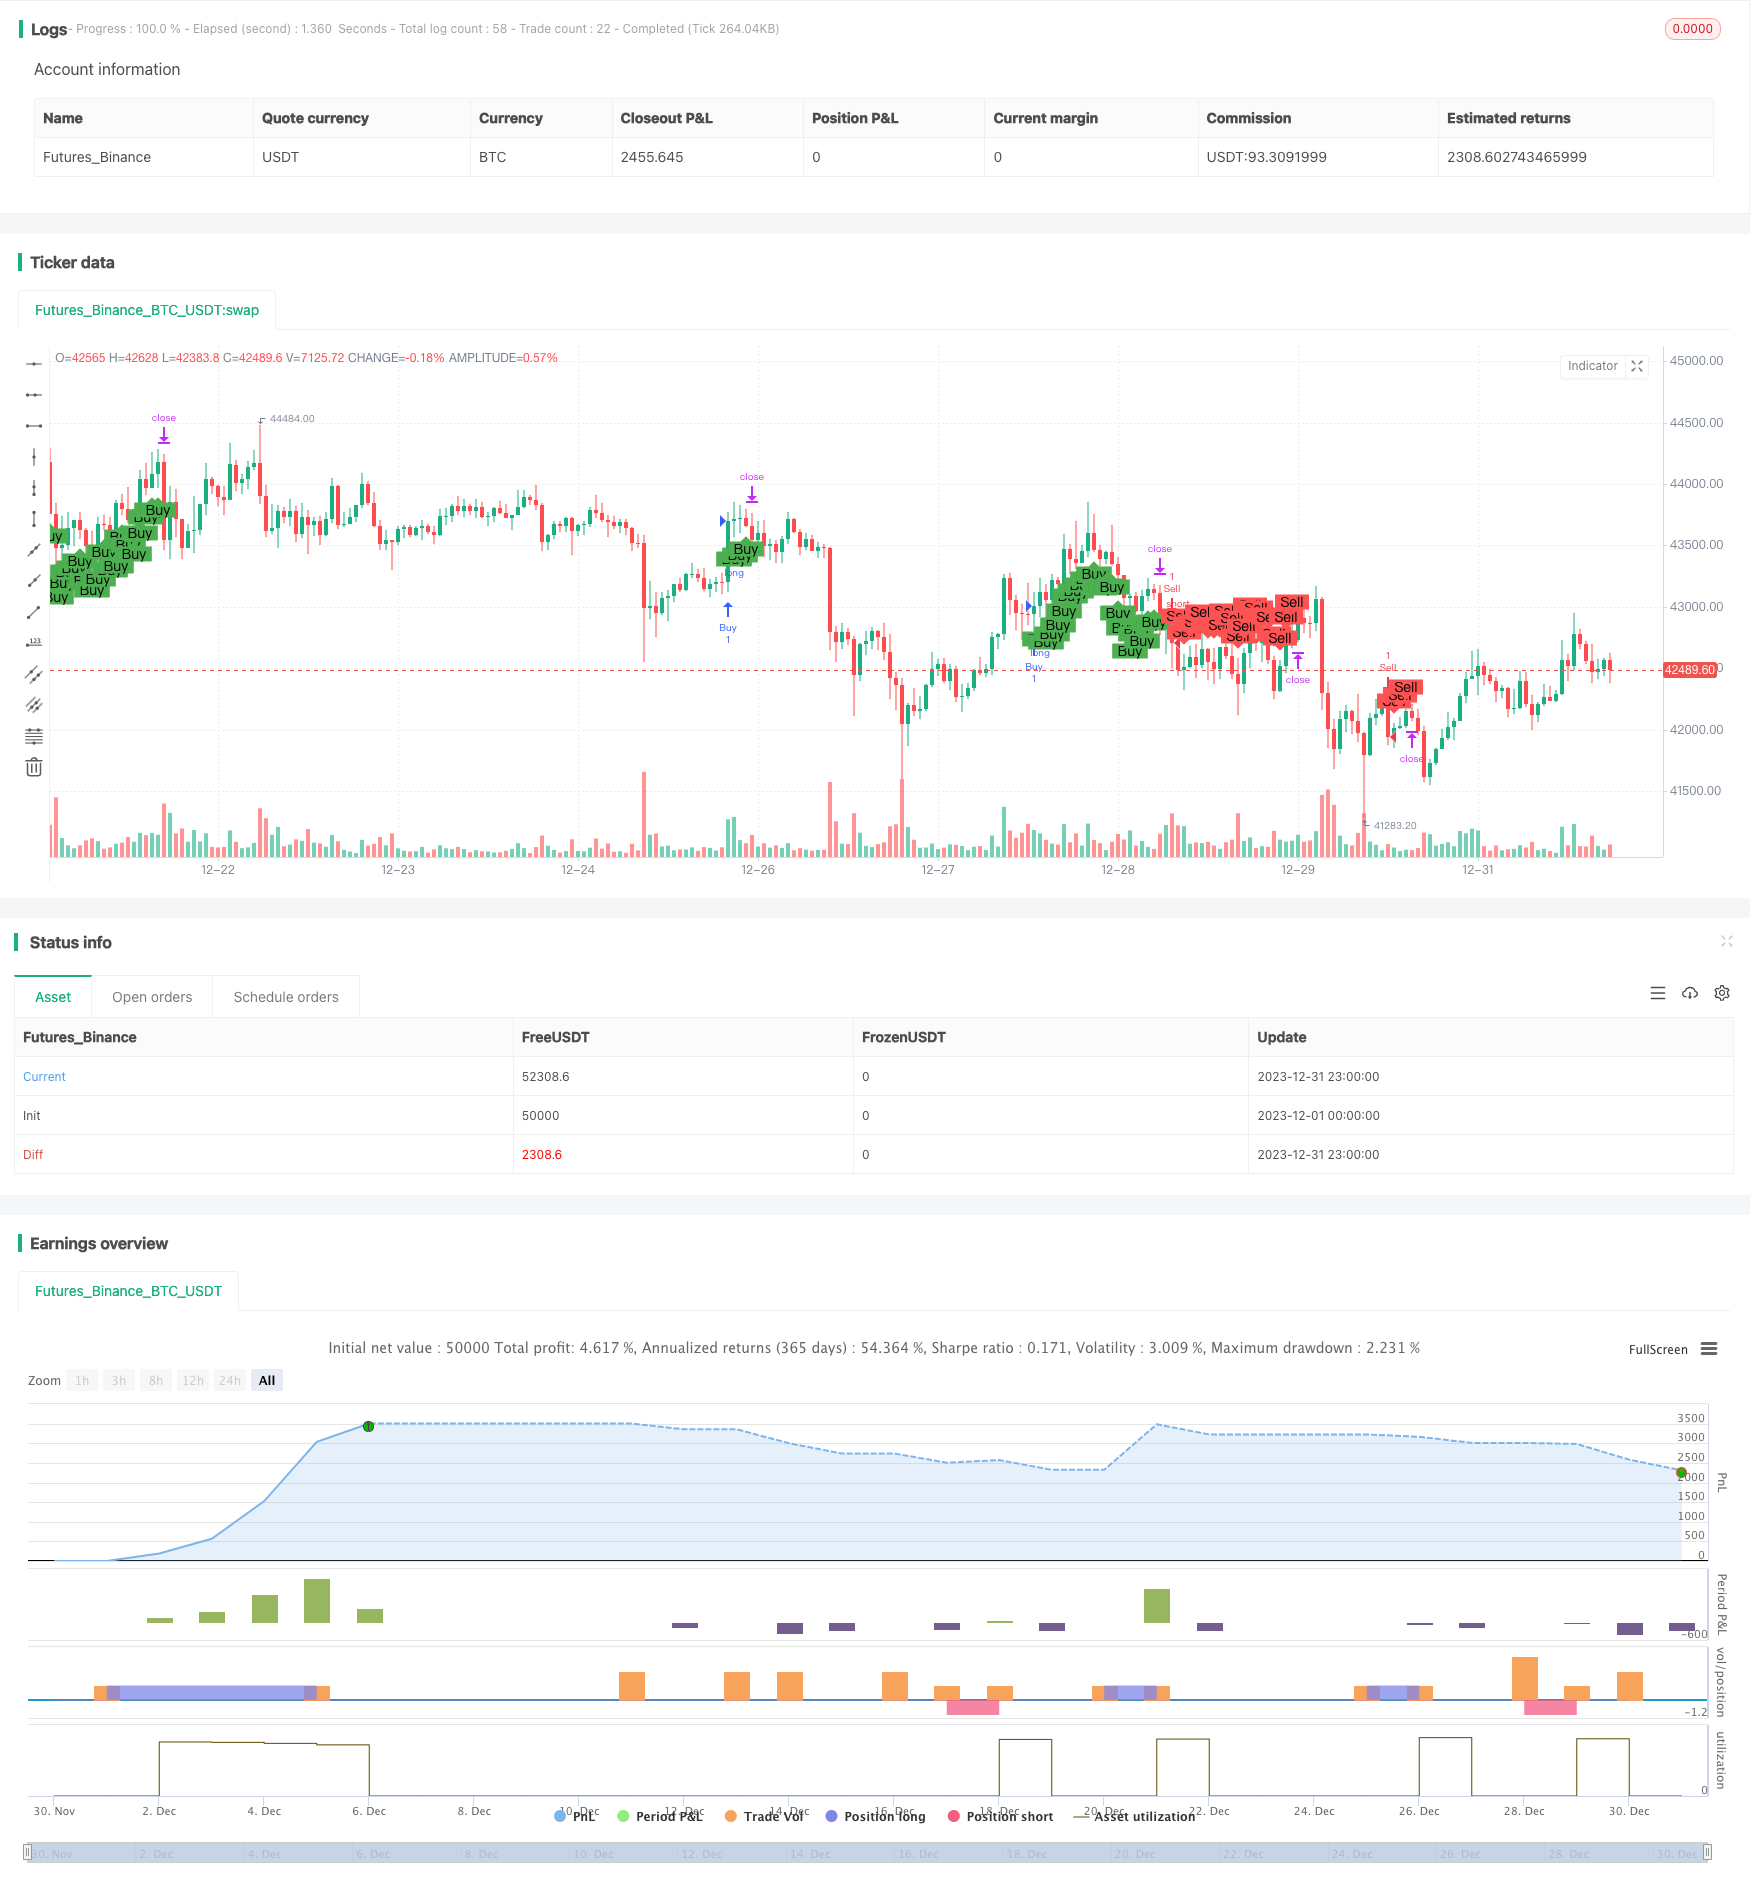
Name
价格突破策略Amazing-Price-Breakout-Strategy
Author
ChaoZhang
Strategy Description

策略原理:
- 计算15日和30日的简单移动平均线,以判断价格趋势。
- 计算布林通道上下轨,并结合K线实体突破布林通道上下轨来判断买入和卖出时机。
- 结合随机指标RSI判断是否超买超卖。RSI大于50为超买信号,RSI小于50为超卖信号。
- 当价格上涨突破布林通道上轨,且RSI大于50时产生买入信号;当价格下跌突破布林通道下轨,且RSI小于50时产生卖出信号。
- 设置ATR止损来控制风险。
优势分析:
- 该策略综合运用布林通道、RSI指标等多个指标来确定交易信号,可以有效避免因单一指标而造成交易信号的错误。
- 结合趋势判断,避免在盘整和反转中产生错误的交易信号。
- 设置ATR止损来控制每单的风险。
- 策略操作清晰简单,容易理解实现。
风险与改进:
- 布林通道作为一个轮廓指标,它的上下轨并不是绝对的支撑和阻力位,价格突破上下轨后可能会出现止损被击穿的情况。可以设置更宽松的止损点,或采用时间止损等其他止损策略。
- RSI指标在某些市场中可能会失效。可以考虑结合其他指标如KDJ、MACD等来实现更可靠的超买超卖判断。
- 反转和盘整市场中,容易产生错误信号。可以考虑加入趋势过滤,只在趋势明显的情况下参与操作。
优化建议:
- 测试并优化布林通道的周期数和标准差参数,使之更符合不同品种的特性。
- 测试并优化RSI的周期参数。
- 测试其他止损策略,如追踪止损、时间止损等。
- 结合更多趋势判断指标和信号指标,构建多因子模型。
总结:
本策略综合运用布林通道、RSI等多个指标判断买入和卖出时机,在保证一定的交易信号准确性的同时,也设置了止损来控制风险。但仍需针对具体品种进行参数优化,使信号更加准确可靠。此外,也可以考虑加入更多因子构建多因子模型。总的来说,该策略提供了一个相对简单、实用的价格突破操作思路,值得进一步研究优化。
||
Overview: This strategy utilizes Bollinger Bands, KDJ indicator and trend following for price breakout operations. It can make long and short entries at breakout points and set stop loss to control risks.
Strategy Logic:
-
Calculate 15-day and 30-day simple moving averages to determine the price trend.
-
Calculate Bollinger Bands upper and lower rail, and combine candlestick breakout of BB rails to determine entries and exits.
-
Use RSI indicator to judge overbought and oversold conditions. RSI greater than 50 indicates overbought signal and RSI less than 50 indicates oversold signal.
-
When price breaks above the BB upper rail with RSI greater than 50, a buy signal is generated. When price breaks below the BB lower rail with RSI less than 50, a sell signal is generated.
-
Set ATR stop loss to control risks.
Advantages:
-
The strategy combines multiple indicators like Bollinger Bands and RSI to determine trading signals, which can effectively avoid errors caused by single indicator.
-
With trend filtering, it prevents wrong signals during consolidation and reversal.
-
ATR stop loss controls risks for each trade.
-
The strategy logic is simple and easy to understand.
Risks & Improvements:
-
As an envelope indicator, the BB upper and lower rails are not absolute support/resistance levels. Prices may break the rails and hit stop loss. Can set wider stop loss or use other stop loss methods like time exit.
-
RSI may fail in some markets. Can consider combining other indicators like KDJ and MACD for more reliable overbought/oversold judgement.
-
Wrong signals may occur during reversals and consolidations. Can add trend filter to only trade along the major trend.
Enhancement Suggestions:
-
Test and optimize BB period and standard deviation for different products.
-
Test and optimize RSI period parameter.
-
Test other stop loss methods like trailing stop loss and time exit.
-
Add more trend indicators and signal indicators to build multifactor models.
Conclusion:
The strategy combines BB, RSI and other indicators for entry and exit signals. It controls risks while ensuring signal accuracy. More optimization can be done on parameters and enhancements like multifactor models. Overall it provides a simple and practical idea on price breakout strategies.
[/trans]
Source (PineScript)
/*backtest
start: 2023-12-01 00:00:00
end: 2023-12-31 23:59:59
period: 1h
basePeriod: 15m
exchanges: [{"eid":"Futures_Binance","currency":"BTC_USDT"}]
*/

//@version=4
strategy("Custom Strategy", overlay=true)

length = 14
mult = 0.75
atr = atr(length) * mult

// Moving averages
ma15 = sma(close, 15)
ma30 = sma(close, 30)

// Bullish Engulfing pattern
bullishEngulfing = close[1] < open[1] and close > open and close[1] < open and close > open[1]

// Bearish Engulfing pattern
bearishEngulfing = close[1] > open[1] and close < open and close[1] > open and close < open[1]

// RSI
rsi = rsi(close, length)

// Buy condition
if (bullishEngulfing and close[1] > ma15 and rsi > 50)
    strategy.entry("Buy", strategy.long)
    strategy.exit("Sell", "Buy", stop=close - atr)

// Sell condition
if (bearishEngulfing and close[1] < ma15 and rsi < 50)
    strategy.entry("Sell", strategy.short)
    strategy.exit("Cover", "Sell", stop=close + atr)

// Plotting
plotshape(series=strategy.position_size > 0, title="Buy", location=location.belowbar, color=color.green, style=shape.labelup, text="Buy")
plotshape(series=strategy.position_size < 0, title="Sell", location=location.abovebar, color=color.red, style=shape.labeldown, text="Sell")
Detail
https://www.fmz.com/strategy/440424
Last Modified
2024-01-30 15:07:08