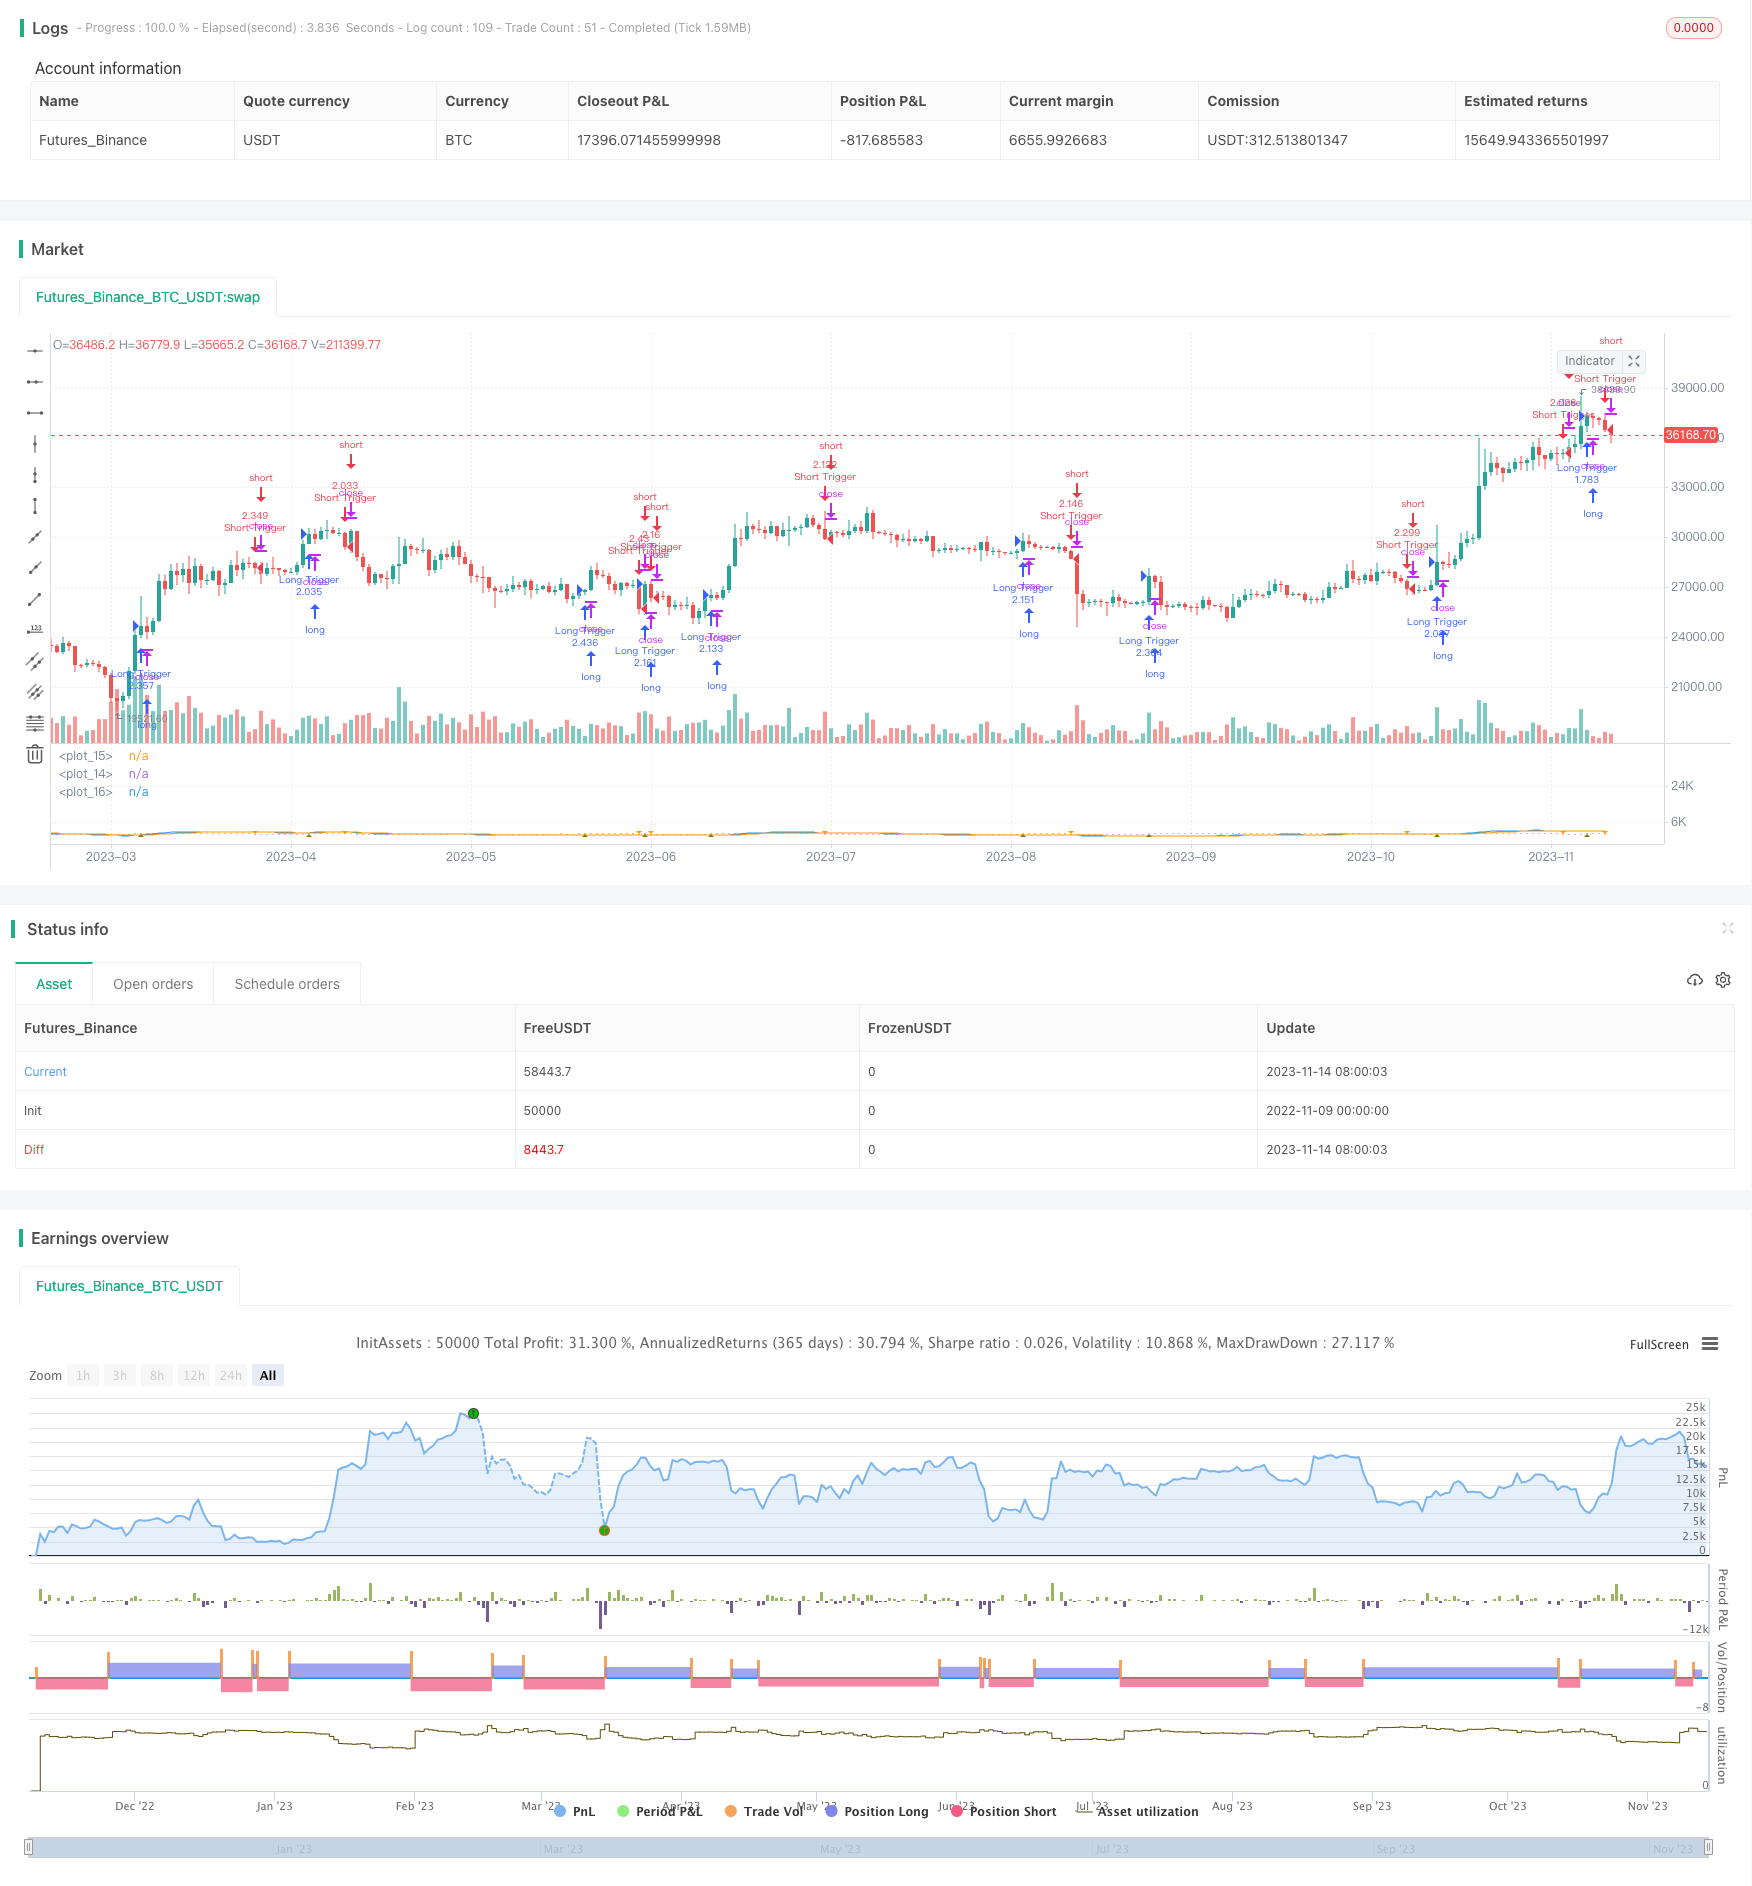
Name
价格趋势动量指标策略Momentum-Indicator-Strategy
Author
ChaoZhang
Strategy Description
本策略利用移动平均线和MACD指标识别价格趋势和动量,结合交叉信号进行买卖判断。属于典型的趋势追踪策略。
本策略使用双移动平均线形成均线交叉信号。快速移动平均线长度为12日,慢速移动平均线长度为26日。当快速移动平均线上穿慢速移动平均线时,产生金叉,做多信号。当快速移动平均线下穿慢速移动平均线时,产生死叉,做空信号。
同时,本策略使用MACD指标判断动量。MACD指标由快线(12日EMA)减去慢线(26日EMA)得到,再用信号线(9日EMA)平滑MACD。当MACD上穿信号线时为多头动量增强信号,当MACD下穿信号线时为空头动量增强信号。
本策略综合考虑移动平均线交叉信号和MACD指标信号,进行买卖决策。当产生金叉和MACD上穿时,做多。当产生死叉和MACD下穿时,做空。
-
使用双移动平均线交叉结合MACD指标,综合考虑价格趋势和动量信号,避免错失买卖机会。
-
快速移动平均线和慢速移动平均线长度配比合理,可以有效识别中期趋势。MACD指标参数设置也较为标准,可靠识别动量变化。
-
通过图形可视化指标,交易信号直观清晰。能够直观判断趋势方向和动量强弱。
-
策略参数设定合理灵活,可调整移动平均线长度和MACD参数进行优化,适应不同市场环境。
-
实现了趋势跟踪,可以获取较长的趋势行情收益。
-
双移动平均线交叉存在滞后,可能延迟做多做空时机。
-
MACD指标存在频繁发出错误信号的可能,需要结合价格行情判断。
-
多头行情中,死叉可能是调整信号,此时应持有多单而不是轻易平仓。
-
空头行情中,金叉可能是反弹信号,此时应持有空单而不是轻易平仓。
-
需要严格遵守资金管理原则,控制单笔交易占用资金比例,避免过度交易。
-
优化移动平均线参数,测试不同时间周期的参数组合,提高交叉信号的可靠性。
-
优化MACD指标参数,调整长短周期EMA和信号线参数,降低错误信号。
-
添加其他辅助指标,如KDJ、BOLL等,进行综合判断,提高信号准确性。
-
结合交易量指标,避免虚假突破带来的错误信号。
-
采用回测确定最佳参数组合,根据历史数据测算最优参数。
-
设置止损策略,严格控制单次止损比例,降低交易风险。
本策略整合双移动平均线交叉和MACD指标,实现了趋势交易。优化参数设置,严格遵守资金管理,有助于获取长期稳定收益。但也需要注意防范指标产生的错误信号,与价格行情结合进行综合判断,降低交易风险。通过进一步优化,可以提高策略效果。
||
This strategy uses moving averages and the MACD indicator to identify price trends and momentum, combined with crossover signals to make trading decisions. It is a typical trend following strategy.
This strategy uses a double moving average crossover to generate signals. The fast moving average has a length of 12 days, while the slow moving average has a length of 26 days. When the fast MA crosses above the slow MA, a golden cross is formed which gives a long signal. When the fast MA crosses below the slow MA, a death cross is formed which gives a short signal.
At the same time, this strategy uses the MACD indicator to gauge momentum. The MACD is calculated by subtracting the slow MA (26-day EMA) from the fast MA (12-day EMA), and then smoothed by a signal line (9-day EMA). When the MACD crosses above the signal line, it indicates increasing bullish momentum. When it crosses below the signal line, it indicates increasing bearish momentum.
This strategy considers both the moving average crossover signals and the MACD indicator signals to make trading decisions. It goes long when a golden cross and a MACD crossover appear, and goes short when a death cross and MACD crossover happen.
-
Using double moving averages combined with MACD considers both price trend and momentum, avoiding missed trading opportunities.
-
The fast and slow moving average lengths are reasonably set to identify medium-term trends. The MACD parameters are also standard for reliably detecting momentum shifts.
-
The graphical visualization of the indicators makes trading signals clear and intuitive. Trend direction and momentum strength can be judged directly.
-
The strategy parameters are flexible for optimization. The MA lengths and MACD parameters can be adjusted for different market environments.
-
It implements trend following and can profit from sustained directional trends.
-
The double moving average crossover may lag, delaying entry signals.
-
MACD can give frequent false signals, needing price confirmation.
-
Death crosses in uptrends may signal corrections, existing longs should not be exited prematurely.
-
Golden crosses in downtrends may signal rebounds, existing shorts should not be covered prematurely.
-
Strict money management should be followed, limiting position sizing to control risk.
-
Optimize MA parameters by testing different period combinations to improve crossover reliability.
-
Optimize MACD parameters by adjusting short and long EMAs and signal line to reduce false signals.
-
Add other indicators like KDJ, BOLL for confluence to improve signal accuracy.
-
Incorporate volume indicators to avoid false breakouts.
-
Backtest to find optimal parameter combinations based on historical data.
-
Implement stop loss strategies to strictly limit loss per trade and reduce risk.
This strategy integrates double moving average crossover and MACD for trend trading. Optimizing parameters and following prudent money management will help achieve steady gains long-term. But false signals need to be avoided by confirming with price action. Further optimizations can improve strategy performance.
[/trans]
Strategy Arguments
| Argument | Default | Description |
|---|---|---|
| v_input_1 | 12 | fastLength |
| v_input_2 | 26 | slowLength |
| v_input_3 | 9 | signalLength |
Source (PineScript)
/*backtest
start: 2022-11-09 00:00:00
end: 2023-11-15 00:00:00
period: 1d
basePeriod: 1h
exchanges: [{"eid":"Futures_Binance","currency":"BTC_USDT"}]
*/

//@version=3
strategy(title="Moving Average Convergence/Divergence MaCD Backesting", shorttitle="MACD Backtesting", precision = 6, pyramiding = 3, default_qty_type = strategy.percent_of_equity, currency = currency.USD, commission_type = strategy.commission.percent, commission_value = 0.10, initial_capital = 1000, default_qty_value = 100)
source = close
fastLength = input(12, minval=1), slowLength=input(26,minval=1)
signalLength=input(9,minval=1)

fastMA = ema(source, fastLength)
slowMA = ema(source, slowLength)

macd = fastMA - slowMA
signal = ema(macd, signalLength)
hist = macd - signal

plot(hist, color=red, style=histogram)
plot(macd, color=blue)
plot(signal, color=orange)

buy = crossover(macd,signal)
sell = crossunder(macd,signal)

plotshape(buy, "buy", shape.triangleup, color = olive , size = size.tiny, location  = location.bottom)
plotshape(sell, "sell", shape.triangledown, color = orange , size = size.tiny, location  = location.bottom)

if (buy)
    strategy.entry("Long Trigger", true)
if(sell)
    strategy.entry("Short Trigger", false)
if (sell)
    strategy.exit("Close Long Trigger", "Long Trigger")
if (buy)
    strategy.exit("Close Short Trigger", "Short Trigger")
Detail
https://www.fmz.com/strategy/432334
Last Modified
2023-11-16 15:47:13
