Name
低价买入-高价止盈策略Low-High-Trend-Strategy
Author
ChaoZhang
Strategy Description
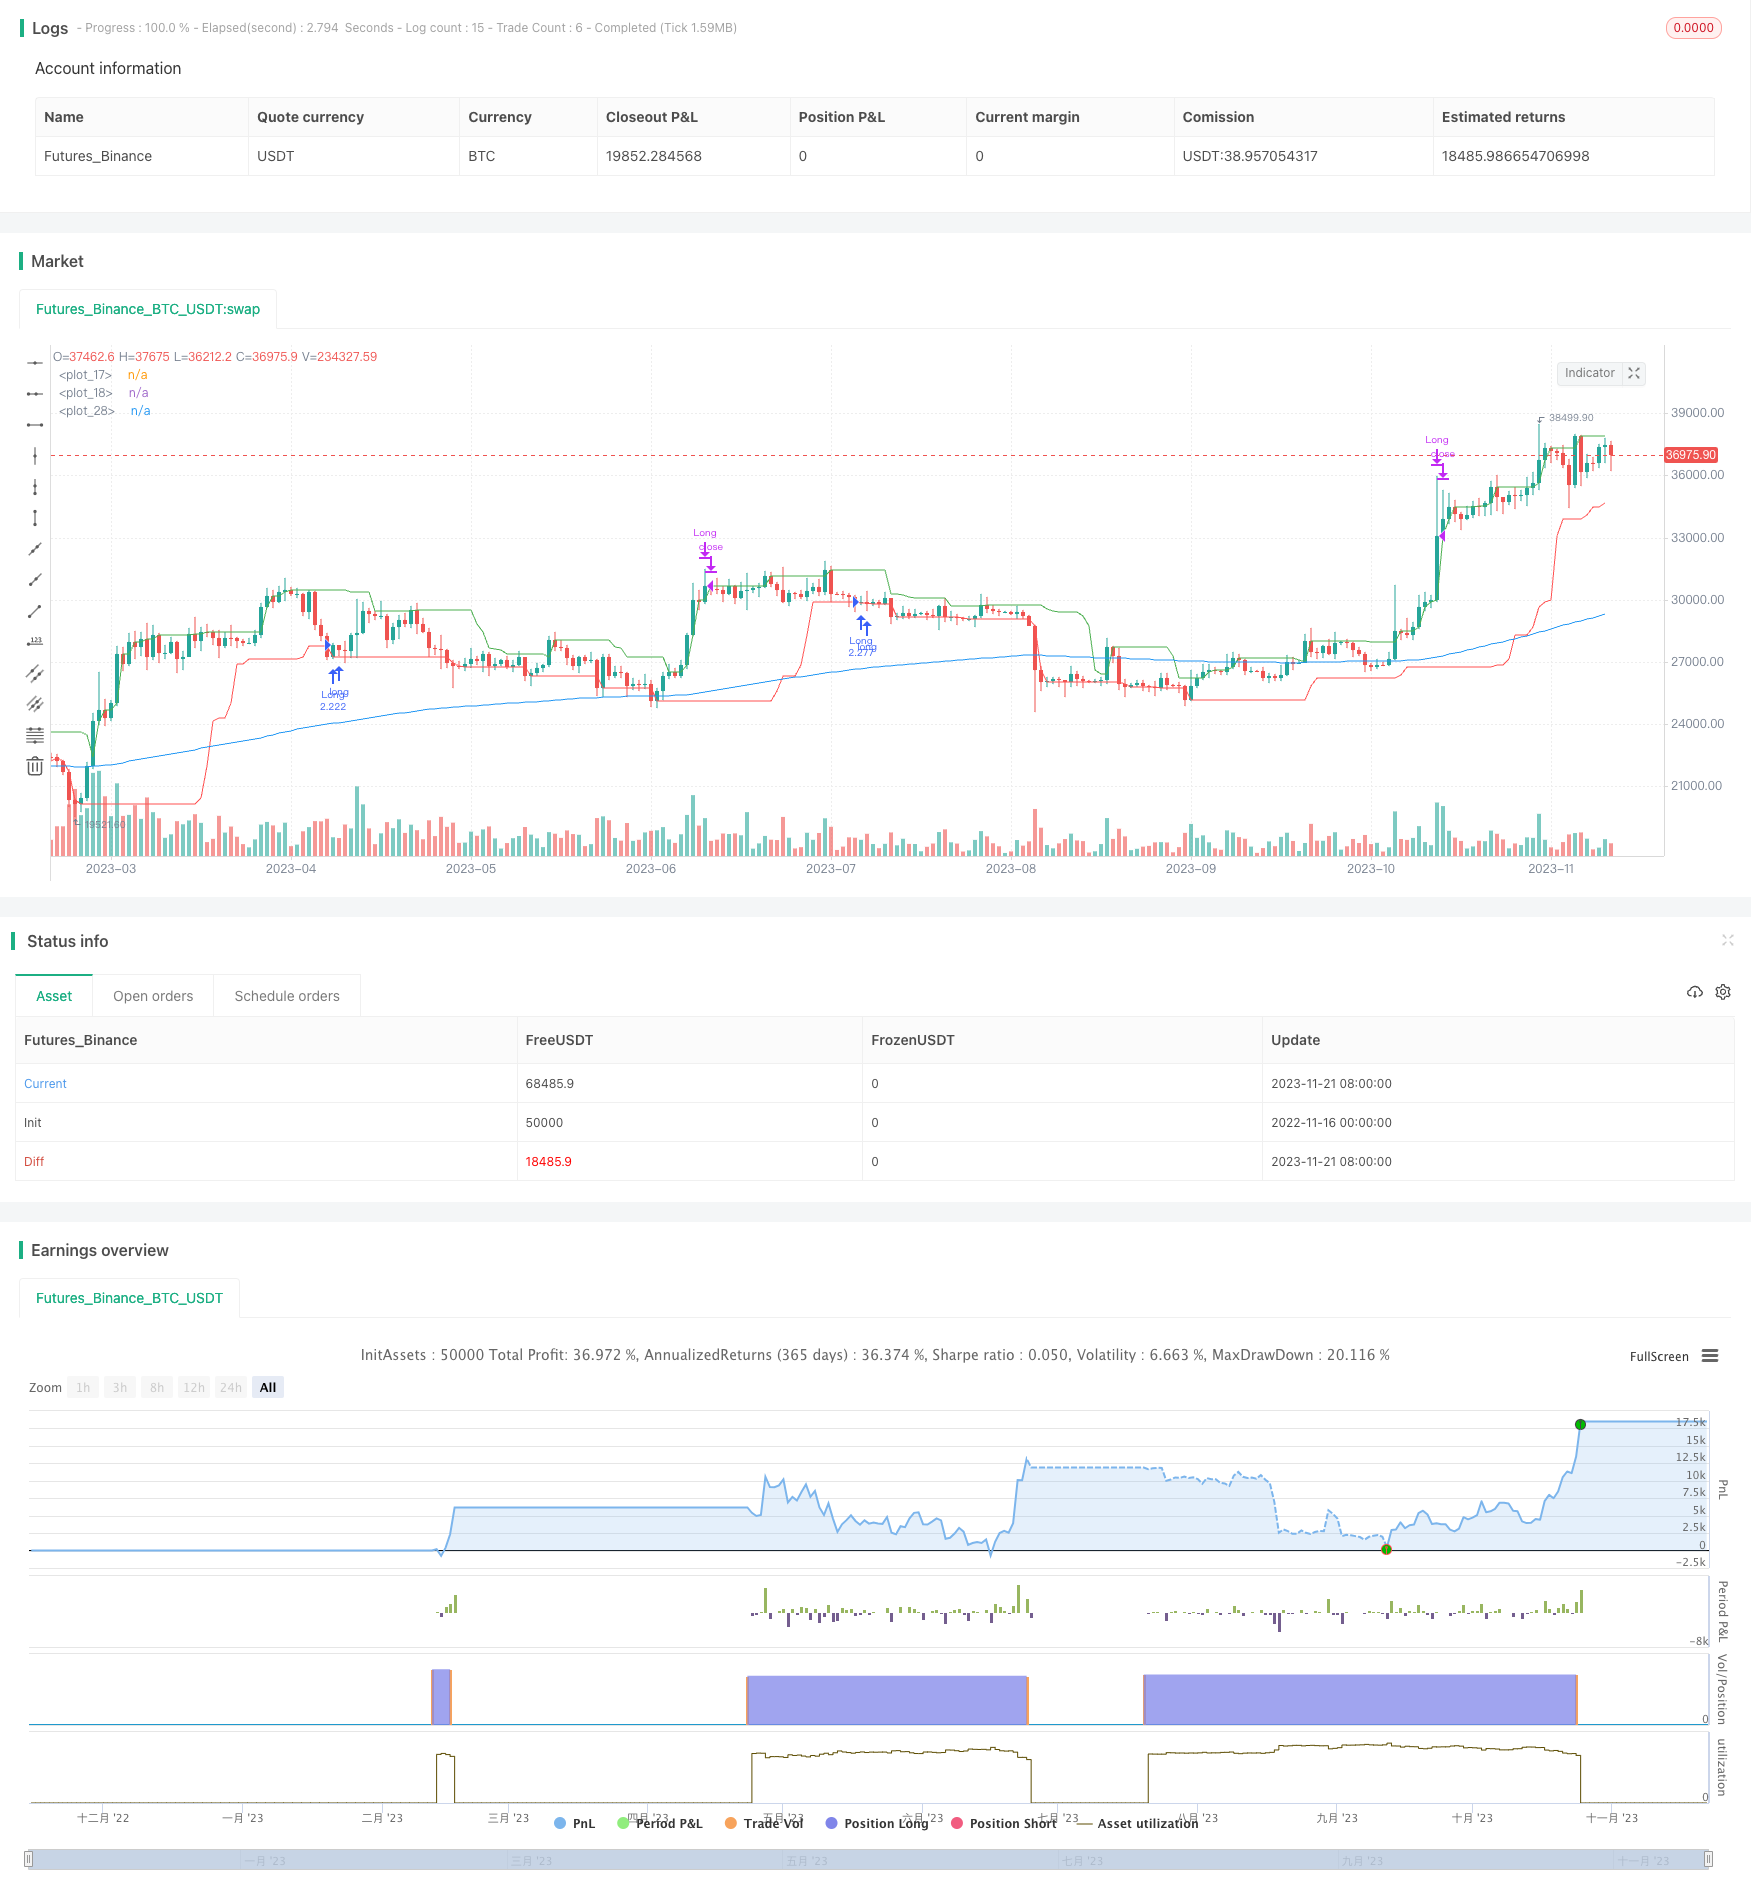
该策略基于市场的低点买入、高点卖出的思想设计。它会追踪过去一定周期内的最高价和最低价,在价格突破最低价时建立多头头寸,在价格跌破最高价或达到止盈条件时平仓。同时,该策略加入了可选的趋势过滤器,只有在价格处于上升趋势时才会买入。
-
最低价(lowcriteria):调用ta.lowest函数,基于用户设定的回看周期(默认20根K线)计算过去一定周期内的最低价,并绘制最低价线。
-
最高价(highcriteria):调用ta.highest函数,基于用户设定的回看周期(默认10根K线)计算过去一定周期内的最高价,并绘制最高价线。
当现价突破最低价线时,即发出买入信号,建立多头头寸。
提供两种出场方式可选:
-
固定止盈:当价格达到设定的止盈水平(如超过入场价8%)时,平仓套利。
-
最高价突破:当价格跌破最高价线时,判断趋势反转,平仓止损。
加入EMA均线判断趋势方向,只有在价格高于EMA均线(称为上升趋势)时才会买入。该过滤器可选择开启或关闭。
-
利用突破低点买入、突破高点卖出的策略,符合市场基本规律。
-
增加趋势判断机制,可避免价格震荡时频繁开仓。
-
提供两种出场选择,既可追求高止盈,也可减少亏损。
-
可自定义参数,适应更广泛的市场环境。
-
策略优化空间大,可通过参数调整、过滤器设计等进一步完善。
-
固定止盈无法根据市场实际走势调整,可能导致过早止盈或止盈幅度过小。
-
突破最高价卖出时,可能已产生较大亏损,无法有效控制损失。
-
EMA趋势判断仅从一定历史周期判断,可能滞后于实际趋势转变。
-
回测数据无法代表未来,实盘效果存在不确定性。
-
增加止盈方式:如移动止盈、级差止盈等,使止盈水平能根据市场走势实时调整。
-
优化出场信号:比如改为分批出场,或增加其他指标判断。
-
优化趋势判断:如加入更多指标,或机器学习判断。
-
优化参数:通过更广泛的回测找到最佳参数组合。
-
增加止损方式:使损失控制更加灵活有效。
本策略总体运用了经典的低买高卖原则,在一定条件下可以取得较好的效果。但策略本身仍有优化空间,通过参数调整、出场优化、止损方式改进等可以获得更稳定的收益。本文对策略的原理、优势、风险、优化方向等进行了全面深入的分析,旨在提供策略思路的同时也提醒投资者注意风险,谨慎对待量化交易。
||
This strategy is designed based on the market principle of buying low and selling high. It tracks the highest and lowest prices over a certain period, establishes a long position when the price breaks through the lowest price, and closes the position when the price falls below the highest price or the take profit condition is met. At the same time, this strategy adds an optional trend filter that only allows buying when the price is in an uptrend.
-
Lowest price (lowcriteria): Call ta.lowest function to calculate the lowest price over the lookback period set by user (default 20 bars) and plot the lowest price line.
-
Highest price (highcriteria): Call ta.highest function to calculate the highest price over the lookback period set by user (default 10 bars) and plot the highest price line.
When the current price breaks through the lowest price line, a buy signal is triggered to establish a long position.
Two exit methods are provided for option:
-
Fixed take profit: Close the position for profit when the price reaches the preset take profit level (e.g. 8% above entry price).
-
Breakdown of highest price: Close the position to cut losses when the price falls below the highest price line, judging a trend reversal.
Add an EMA line to determine the trend direction. Allow buying only when the price is above EMA line (an uptrend). This filter can be enabled or disabled.
-
Adopt the classic strategy of buying low and selling high, aligning with market fundamentals.
-
Add trend judgment to avoid frequent opening during price fluctuations.
-
Provide two exit options for pursuing high profits or reducing losses.
-
Customizable parameters adapt to more market environments.
-
Huge room for strategy optimization via parameter tuning, filter design etc.
-
Fixed take profit level fails to adjust based on actual market moves, resulting in premature profit-taking or insufficient profit target.
-
Selling at the breakdown of highest price may already generate huge losses, unable to effectively control losses.
-
EMA trend judgment only looks back a certain period, possibly lagging behind the actual trend change.
-
Backtest results cannot represent the future. Live performance has uncertainties.
-
Add profit-taking methods like trailing stop, partial exit etc. to dynamically adjust take profit level.
-
Optimize exit signals e.g. partial exits, adding other indicators.
-
Enhance trend judgment by incorporating more indicators or machine learning.
-
Optimize parameters by more extensive backtests to find optimum sets.
-
Add stop loss methods to better control losses.
This strategy generally applies the classic low buy high sell principle and can perform well under certain conditions. But there is still room for improving via parameter tuning, exit optimization, stop loss mechanisms etc. This article provides an in-depth analysis on the strategy's logic, pros, cons and optimization directions, aiming to share the strategy idea as well as remind investors of the risks and trade cautiously with quantitative strategies.
[/trans]
Strategy Arguments
| Argument | Default | Description |
|---|---|---|
| v_input_1 | timestamp(01 Jan 2000 05:00 +0000) | Start Time |
| v_input_2 | timestamp(01 Jan 2099 00:00 +0000) | End Time |
| v_input_3 | 20 | Lowest Price Lookback |
| v_input_4 | 10 | Highest Price Lookback |
| v_input_5 | true | Sell with Take-Profit % intead of highest price cross? |
| v_input_float_1 | 8 | Take Profit % |
| v_input_6 | true | Only buy when price is above EMA trend? |
| v_input_7 | 200 | EMA Length |
Source (PineScript)
/*backtest
start: 2022-11-16 00:00:00
end: 2023-11-22 00:00:00
period: 1d
basePeriod: 1h
exchanges: [{"eid":"Futures_Binance","currency":"BTC_USDT"}]
*/

// This source code is subject to the terms of the Mozilla Public License 2.0 at https://mozilla.org/MPL/2.0/
// @version=5
// Author = TradeAutomation


strategy(title="Low-High-Trend Strategy", shorttitle="Low-High-Trend Strategy", process_orders_on_close=true, overlay=true, commission_type=strategy.commission.cash_per_order, commission_value=1, slippage=3, initial_capital = 25000, margin_long=50, margin_short=50, default_qty_type=strategy.percent_of_equity, default_qty_value=110)


// Backtest Date Range Inputs //
StartTime = input(defval=timestamp('01 Jan 2000 05:00 +0000'), title='Start Time')
EndTime = input(defval=timestamp('01 Jan 2099 00:00 +0000'), title='End Time')
InDateRange = true

// Strategy Calculations //
lowcriteria = ta.lowest(close, input(20, "Lowest Price Lookback", tooltip="The strategy will BUY when the price crosses over the lowest it has been in the last X amount of bars"))[1]
highcriteria = ta.highest(close, input(10, "Highest Price Lookback", tooltip="If Take-Profit is not checked, the strategy will SELL when the price crosses under the highest it has been in the last X amount of bars"))[1]
plot(highcriteria, color=color.green)
plot(lowcriteria, color=color.red)

// Take Profit //
TakeProfitInput = input(true, "Sell with Take-Profit % intead of highest price cross?")
TakeProfit = ta.crossover(close,strategy.position_avg_price*(1+(.01*input.float(8, title="Take Profit %", step=.25))))

// Operational Functions //
TrendFilterInput = input(true, "Only buy when price is above EMA trend?")
ema = ta.ema(close, input(200, "EMA Length"))
TrendisLong = (close>ema)
plot(ema)

// Entry & Exit Functions//
if (InDateRange and TrendFilterInput==true)
    strategy.entry("Long", strategy.long, when = ta.crossover(close, lowcriteria) and TrendisLong)
if (InDateRange and TrendFilterInput==false)
    strategy.entry("Long", strategy.long, when = ta.crossover(close, lowcriteria))
if (InDateRange and TakeProfitInput==true)
    strategy.close("Long", when = TakeProfit)
if (InDateRange and TakeProfitInput==false)
    strategy.close("Long", when = ta.crossunder(close, highcriteria))
if (not InDateRange)
    strategy.close_all()
Detail
https://www.fmz.com/strategy/432972
Last Modified
2023-11-23 11:03:18
