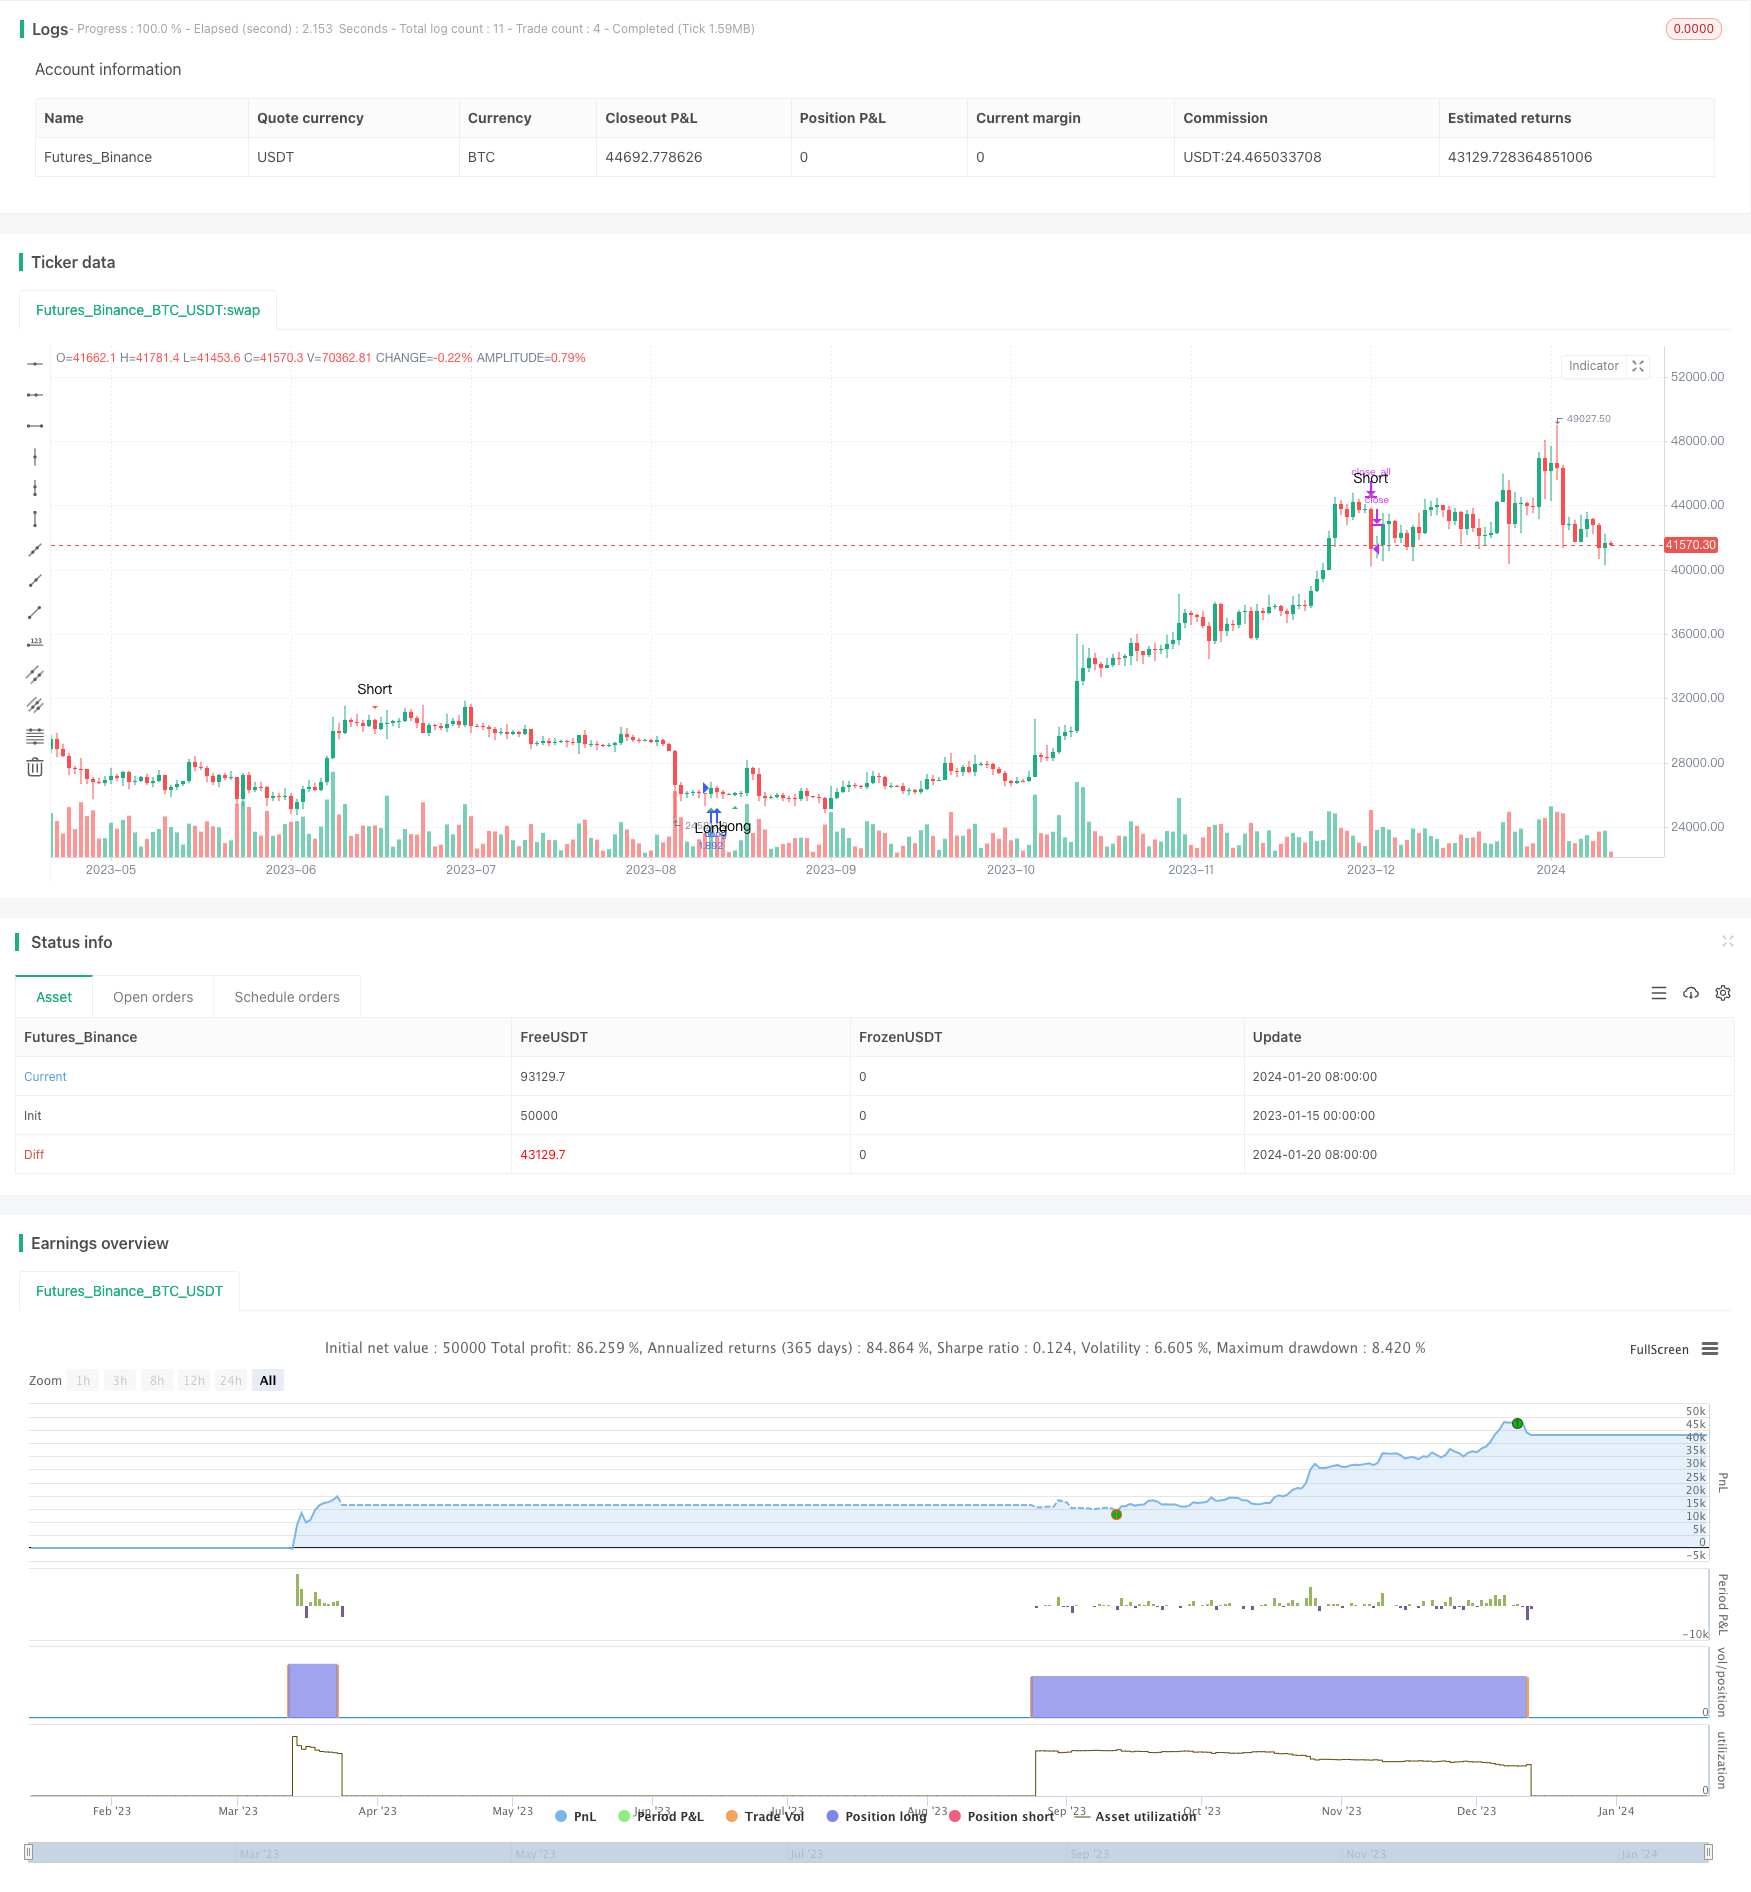
Name
低风险DCA趋势交易策略Low-Risk-DCA-Trend-Trading-Strategy
Author
ChaoZhang
Strategy Description
该策略是基于BTCUSDT 4小时时间周期的DCA趋势交易策略。其主要思想是在RSI指标超买超卖区域形成背离的时候,发出交易信号。然后采用DCA趋势追踪的方式,进行多次加仓建仓,将仓位分散开来降低风险。策略主要特征是风险低、原理简单易操作。
该策略使用RSI指标判断超买超卖信号。RSI大于等于70为超买信号,小于等于30为超卖信号。当RSI从超买区域向下跌破或从超卖区域反弹的时候,说明可能形成顶部,发出做空信号;当RSI从超卖区域向上突破或从超卖区域反弹的时候,说明可能形成底部,发出做多信号。
但为了进一步确定信号,该策略还辅以包容型K线形态判断。因此当RSI反转的同时,如果出现超买反转背离为阴线,超卖反转背离为阳线,那么就发出确定的交易信号。这样可以进一步减少错误信号的概率。
一旦出现交易信号,如果是多头信号,就按照平仓价格的一定比例开仓做多,然后继续追踪连续设置买入止盈委托单实现DCA效果,策略允许最多5档仓位;如果出现空头信号,那么会把当前所有的多单仓位全部平仓。
该策略最大的优势在于风险可控。首先,RSI指标结合K线形态过滤可以大大减少错误信号率,确保信号的可靠性。其次,采取分批建仓DCA策略,可以分散风险,即使走势不利也对单个仓位损失有控制。而且允许的最大仓位数只有5仓,仓位集中度不会太高。再次,仓位亏损达到一定程度就会止损,可以避免单次大亏损的发生。所以从整体上来看,该策略风险可控是其最大优势。
该策略最大的风险在于持仓时间可能会比较长。采用DCA策略和趋势追踪方式,会导致仓位持有时间比较长,特别是行情不利走势的时候。这就有可能增加仓位成本,甚至面临反转亏损风险。
此外,建仓逻辑较为复杂也增加误操作风险。需要综合判断RSI信号和K线信号,操作难度较大,一旦判断失误就容易形成错误建仓。这对初学者而言是比较大的考验。
该策略可以从以下几个方面进行优化:
-
增加止损逻辑。可以在一定亏损条件下强制止损,避免单个仓位出现过大亏损。
-
优化仓位比例。可以测试不同的仓位大小,寻找风险收益比更优的仓位设置。
-
测试其他指标。可以测试不同的指标如MACD、KD等替代或辅助RSI,看是否可以提高信号准确度。
-
优化时间周期。可以测试不同的时间周期参数,寻找更匹配该策略逻辑的周期参数组合。
该低风险DCA趋势交易策略以RSI为主,辅以K线信号,采用追踪止盈的方式实现DCA加仓。策略风险可控,适合对抗市风险能力较弱的投资者。但也存在仓位时间过长和误操作判断等问题。通过不断优化可以提高策略表现。总体来说该策略值得推荐。
||
This is a DCA trend trading strategy based on the BTCUSDT 4-hour timeframe. The main idea is to generate trading signals when there is divergence formed in the overbought/oversold areas of the RSI indicator. It then adopts a DCA trend following approach to open multiple positions and spread out the risk. The main features of this strategy are low risk and simple logic.
The strategy uses the RSI indicator to determine overbought/oversold signals. RSI greater than or equal to 70 is considered overbought, while RSI less than or equal to 30 is considered oversold. When RSI breaks down from the overbought area or bounces up from the oversold area, it indicates a potential top formation and triggers a sell signal. When RSI breaks up from the oversold area or bounces down from the overbought area, it indicates a potential bottom formation and triggers a buy signal.
To further confirm the signals, the strategy also incorporates engulfing candlestick patterns. Therefore, only when the RSI reversal aligns with a bearish engulfing candle in overbought scenarios or a bullish engulfing candle in oversold scenarios, a confirmed trading signal will be triggered. This helps to further reduce the probability of false signals.
Once a trading signal emerges, if it is a buy signal, the strategy will open a long position with a certain percentage of the closing price as the position size, and continue to place conditional buy stop orders to achieve a DCA effect, with a maximum of 5 open positions. If it is a sell signal, all existing long positions will be closed immediately.
The biggest advantage of this strategy lies in controllable risks. Firstly, the combination of RSI and candlestick patterns greatly reduces false signal rates and ensures reliable signals. Secondly, the partial scaling in approach helps diversify risks so that losses on individual positions can be minimized even if the market moves against the trade idea. Also, the maximum number of positions is limited to 5 to avoid overconcentration. Lastly, conditional stop loss orders are placed to avoid uncontrolled losses on single positions. Therefore, from an overall perspective, low risks are the greatest strength.
The biggest risk is that holding periods could turn out longer than expected. By adopting scaling in and trend following techniques, position holding time tends to drag on especially when the market is not moving as favorably. This leads to mounting costs on open positions and even risks from trend reversals.
Additionally, the complex position opening logic also introduces risks from execution errors. Since it requires the simultaneous consideration of both RSI and candlestick signals, it has a steep learning curve and judgment errors can easily result in wrongly opened positions. This poses quite a challenge for beginners.
The strategy can be enhanced from the following aspects:
-
Add stop loss logic. Mandatory stop losses can be introduced at certain loss threshold to avoid uncontrolled losses on single positions.
-
Optimize position sizing. Different position sizes can be backtested to discover a better risk-return profile.
-
Test other indicators. Alternative or auxiliary indicators like MACD and KD can be tried instead of RSI to improve signal accuracy.
-
Optimize timeframes. Different timeframe combinations can be tested to find the set of parameters that is most coherent with the strategy logic.
This low risk DCA trend trading strategy mainly uses RSI plus candlestick signals and adopts trailing stop orders to scale into positions. It has controllable risks and suits investors with relatively low risk tolerance. But it also suffers from potential issues like overextended holding periods and execution errors. Further enhancements around optimization can help improve strategy performance. Overall it is a recommended system.
[/trans]
Strategy Arguments
| Argument | Default | Description |
|---|---|---|
| v_input_1_close | 0 | RSI Source: close |
| v_input_2 | 14 | RSI Length |
| v_input_3 | 70 | RSI Overbought Level |
| v_input_4 | 30 | RSI Oversold Level |
Source (PineScript)
/*backtest
start: 2023-01-15 00:00:00
end: 2024-01-21 00:00:00
period: 1d
basePeriod: 1h
exchanges: [{"eid":"Futures_Binance","currency":"BTC_USDT"}]
*/

//@version=4
strategy("Phil's Pine Scripts - low risk long DCA Trend trade", overlay=true)

////
//// trade on BTCUSDT 4H chart
//// $500 balance = $50 per trade, max 5 positions
//// backtested 54% profit over 3 years (~270)
////

//// define $ amount per trade
position_size = 50000

//// Plot short / long signals

// Get user input
rsiSource = input(title="RSI Source", type=input.source, defval=close)
rsiLength = input(title="RSI Length", type=input.integer, defval=14)
rsiOverbought = input(title="RSI Overbought Level", type=input.integer, defval=70)
rsiOversold = input(title="RSI Oversold Level", type=input.integer, defval=30)

// Get RSI value
rsiValue = rsi(rsiSource, rsiLength)
rsiOB = rsiValue >= rsiOverbought
rsiOS = rsiValue <= rsiOversold

// Identify engulfing candles
bullishEC = close > open[1] and close[1] < open[1]
bearishEC = close < open[1] and close[1] > open[1]
tradeSignal = ((rsiOS or rsiOS[1]) and bullishEC) or ((rsiOB or rsiOB[1]) and bearishEC)

// Plot signals to chart
plotshape(tradeSignal and bullishEC, title="Long", location=location.belowbar, color=color.green, transp=0, style=shape.triangleup, text="Long")
plotshape(tradeSignal and bearishEC, title="Short", location=location.abovebar, color=color.red, transp=0, style=shape.triangledown, text="Short")

//// DCA long trade when there is a bullish signal

if tradeSignal and bullishEC
    strategy.entry("OL", strategy.long, qty=position_size / close)

//// Close all positions when there is a bearish signal

if tradeSignal and bearishEC
    strategy.close_all()
Detail
https://www.fmz.com/strategy/439603
Last Modified
2024-01-22 10:20:40
