Name
先机获利的移动平均早盘退出策略Early-Profit-Taking-Moving-Average-Opening-Bell-Exit-Strategy
Author
ChaoZhang
Strategy Description
[trans]
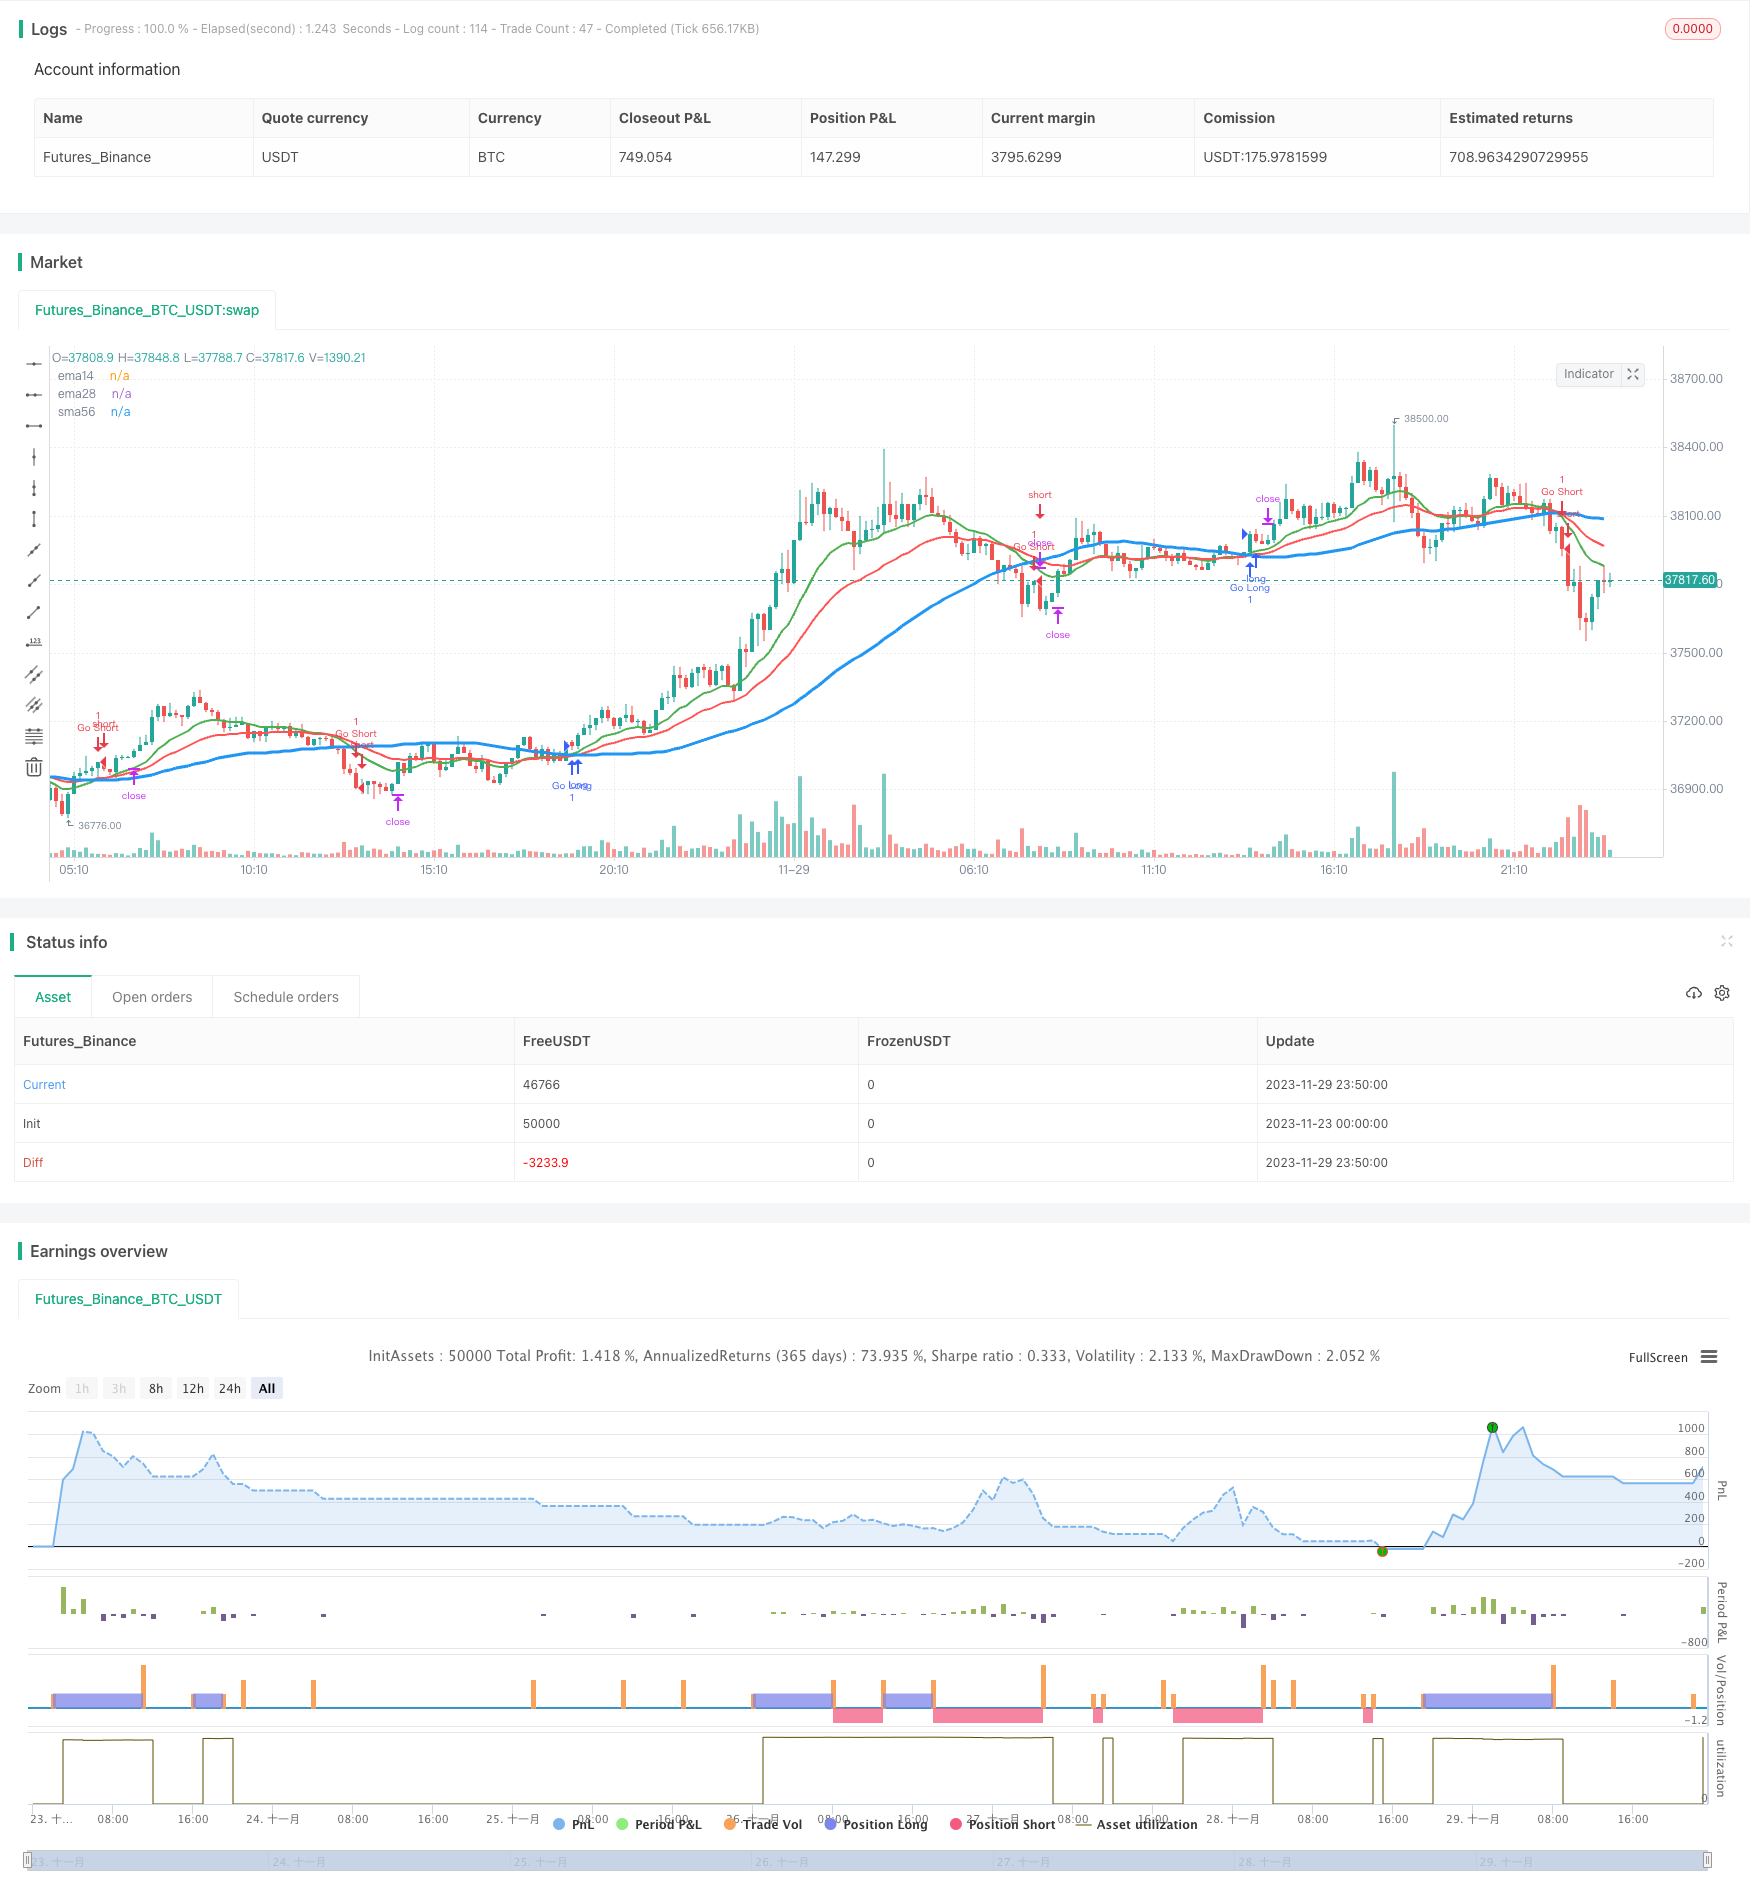
该策略基于移动平均线金叉和死叉实现长短做多做空,同时根据先机获利的统计数据,只在下午收盘止损和止盈,避免被早盘的高波动率套住。
该策略使用3个不同参数的移动平均线:14日线、28日线和56日线。当14日线上穿56日线时做多;当14日线下穿56日线时做空。这是基本的追踪长线趋势的方法。为了过滤掉部分噪音,策略还加入28日线作为参考,只有当14日线同时高于或低于28日线时才会发出交易信号。
该策略的关键创新之处在于,它只在下午四点到五点之间止盈止损。根据统计数据,一天的最高价和最低价有70%的概率会在开盘第一个小时内产生。为了规避开盘时的高波动对策略的冲击,仅在下午交易时段止损止盈。
该策略具有以下几个优势:
- 追踪中长线趋势,避免被过多噪音影响
- 利用开盘高波动的统计特征设计止损止盈逻辑,有效规避假突破
- 简单直观的思路,容易理解和修改
该策略也存在以下风险:
- 如果趋势在早盘就反转,会错过机会。可以测试是否适合股票本身的特征。
- 如果盘后继续大幅波动,仍有被套的风险。可以测试适当放宽止损幅度。
- 回测时间区间设置不当,可能导致过拟合。应扩大回测时间段。
该策略可以从以下几个方面进一步优化:
- 测试不同的移动平均线组合,寻找最优参数
- 根据具体股票的波动特征微调止损幅度
- 结合交易量过滤信号,避免被套
- 增加动态止损,跟踪突破后的回撤
本策略整体思路清晰易懂,有效利用了开盘特点设计止损逻辑,可避免早盘高波动的套牢,值得进一步测试和优化。但也存在被套和错过机会的风险,需针对个股调整参数。总体而言,该策略为初学者提供了一个简单有效的量化交易思路。
||
This strategy implements long and short based on moving average crossovers, and exits only in the afternoon based on early profit-taking statistics to avoid being trapped by high opening volatility.
The strategy uses 3 moving averages with different parameters: 14-day, 28-day and 56-day lines. It goes long when the 14-day line crosses above the 56-day one, and goes short when crossing below. This basic approach tracks long-term trends. To filter out some noise, the 28-day line is added as a reference, so that signals are triggered only when the 14-day line is also above or below the 28-day one.
The key innovation is that it stops loss and takes profit only between 4 pm and 5 pm. Statistics show 70% chance of daily high/low happening in the first hour after opening. To avoid impact from high opening volatility, exits are enabled only during regular afternoon trading hours.
The advantages of this strategy include:
- Track mid-long term trends, avoid excessive noise
- Utilize statistics of opening volatility for stop loss logic to avoid false breakouts
- Simple and intuitive logic, easy to understand and modify
There are also some risks:
- Missing opportunities if reversal happens early in the day. Can test compatibility with specific stocks.
- Still risks of being trapped after hours. Can test loosening stop loss range.
- Bad setting of backtest period leading to overfitting. Should expand backtest duration.
Some ways to further optimize the strategy:
- Test different moving average combinations to find optimum parameters
- Fine tune stop loss range based on volatility patterns of specific stocks
- Add volume filter to avoid traps
- Add dynamic stops to trail pullbacks after breakouts
The strategy has clear and simple logic, effectively uses opening features for stop loss to avoid volatility traps. But risks exist of missing chances and being trapped. Parameters should be adjusted per stock. Overall a simple yet effective idea for novice quants.
[/trans]
Strategy Arguments
| Argument | Default | Description |
|---|---|---|
| v_input_1 | 2014 | Backtest Start Year |
| v_input_2 | true | Backtest Start Month |
| v_input_3 | 2 | Backtest Start Day |
| v_input_4 | 2025 | Backtest Stop Year |
| v_input_5 | 12 | Backtest Stop Month |
| v_input_6 | 30 | Backtest Stop Day |
Source (PineScript)
/*backtest
start: 2023-11-23 00:00:00
end: 2023-11-30 00:00:00
period: 10m
basePeriod: 1m
exchanges: [{"eid":"Futures_Binance","currency":"BTC_USDT"}]
*/

//@version=2
strategy("MAC 1st Trading Hour Walkover", overlay=true)

// Setting up timeperiod for testing
startPeriodYear = input(2014, "Backtest Start Year")
startPeriodMonth = input(1, "Backtest Start Month")
startPeriodDay = input(2, "Backtest Start Day")
testPeriodStart = timestamp(startPeriodYear, startPeriodMonth, startPeriodDay, 0, 0)

stopPeriodYear = input(2025, "Backtest Stop Year")
stopPeriodMonth = input(12, "Backtest Stop Month")
stopPeriodDay = input(30, "Backtest Stop Day")
testPeriodStop = timestamp(stopPeriodYear, stopPeriodMonth, stopPeriodDay, 0, 0)

// Moving Averages
ema14 = ema(close, 14)
ema28 = ema(close, 28)
sma56 = sma(close, 56)

// Plot
plot(ema14, title="ema14", linewidth=2, color=green)
plot(ema28, title="ema28", linewidth=2, color=red)
plot(sma56, title="sma56", linewidth=3, color=blue)

// Strategy
goLong = cross(ema14, sma56) and ema14 > ema28
goShort = cross(ema14, sma56) and ema14 < ema28

// Strategy.When to enter
if time >= testPeriodStart
    if time <= testPeriodStop
        strategy.entry("Go Long", strategy.long, 1.0, when=goLong)
        strategy.entry("Go Short", strategy.short, 1.0, when=goShort)

// Strategy.When to take profit
if time >= testPeriodStart
    if time <= testPeriodStop
        strategy.exit("Close Long", "Go Long", profit=2000)
        strategy.exit("Close Short", "Go Short", profit=2000)

// Strategy.When to stop out
// Some studies show that 70% of the days high low happen in the first hour
// of trading. To avoid having that volatility fire our loss stop we
// ignore price action in the morning, but allow stops to fire in the afternoon.
if time("60", "1000-1600")
    strategy.exit("Close Long", "Go Long", loss=500)
    strategy.exit("Close Short", "Go Short", loss=500)
Detail
https://www.fmz.com/strategy/433918
Last Modified
2023-12-01 14:32:48
