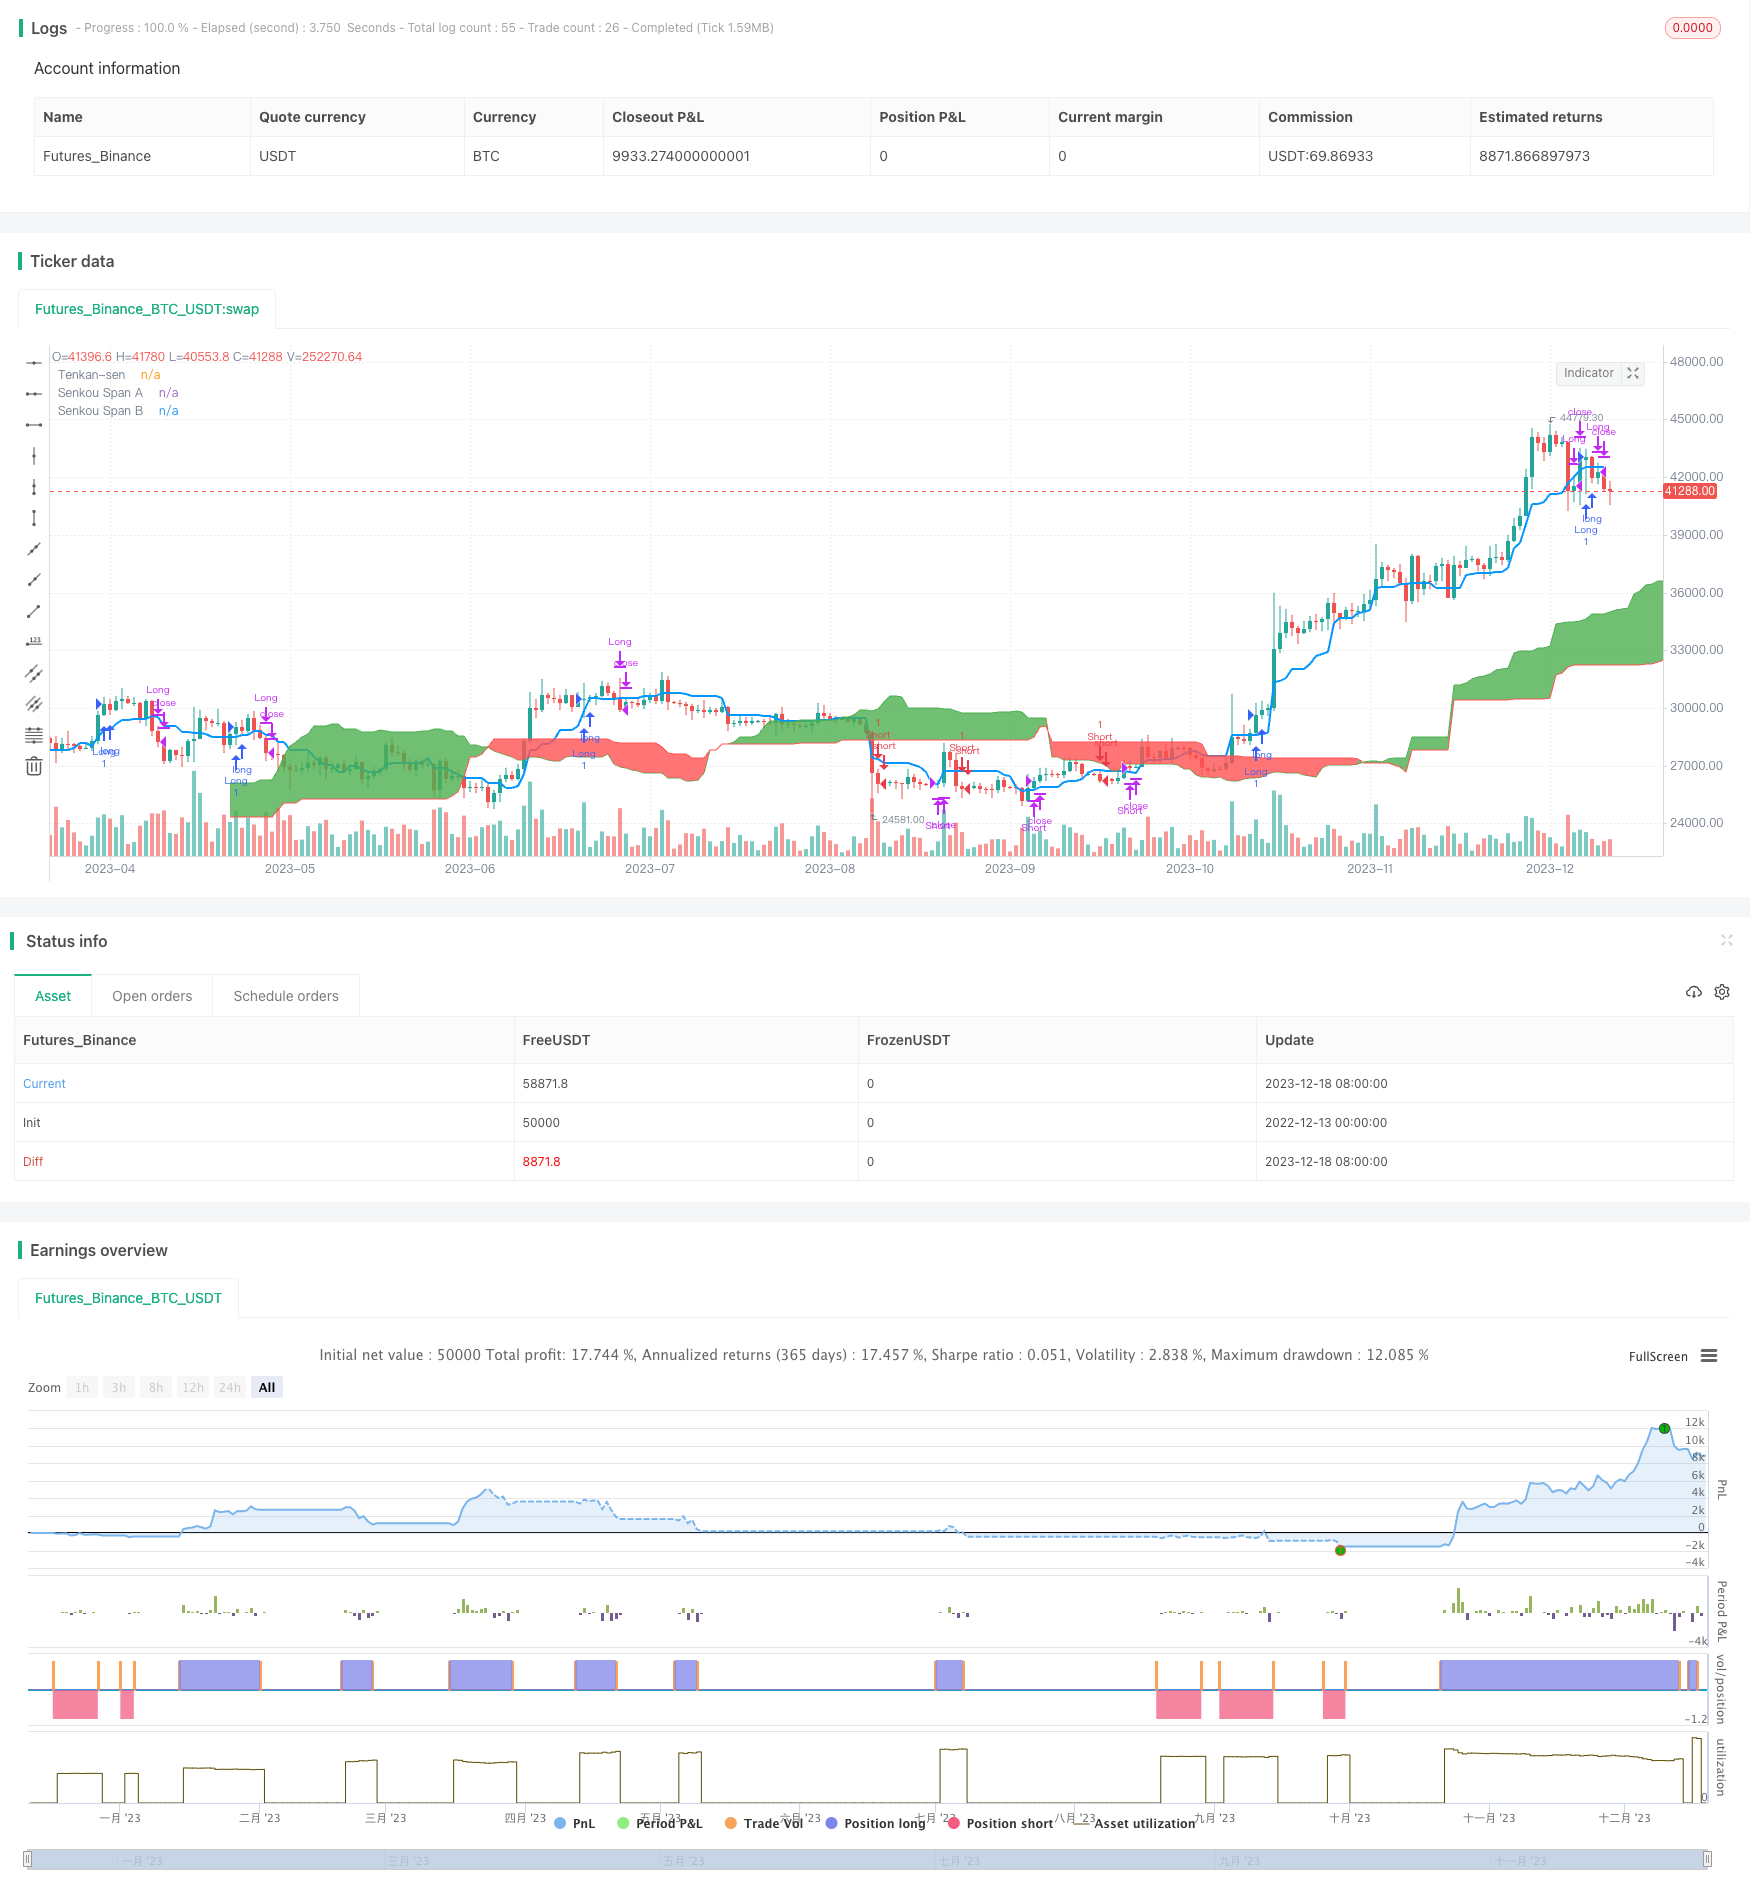
Name
八角云霄-Ichimoku-趋势追踪策略The-Octagon-Cloud-Tracing-Strategy
Author
ChaoZhang
Strategy Description
[trans]
该策略是一个基于Ichimoku技术指标的量化趋势追踪策略,主要通过特定的均线差异在特定条件下构建多空单,追踪市场趋势,并结合一定的止损机制控制风险。
该策略的核心是基于一定参数设置下的Ichimoku指标构建交易信号。Ichimoku指标由转换线、基准线、前沿线和后退线四条线组成,其中转换线简称天线,基准线简称地线。策略通过设置天线和地线的不同参数,形成金叉死叉交易信号。另外,该策略还结合了云带的突破作为辅助条件来发出入场信号。
具体来说,策略主要根据以下几个交易规则:
-
当价格上穿天线,并且脱离云带的时候做多;
-
当价格下穿天线的时候平多仓;
-
当价格下穿地线,并且进入云带的时候做空;
-
当价格上穿天线的时候平空仓。
通过这样的多空交易规则,可以有效捕捉市场的趋势行情。同时,结合云带的突破作为过滤条件,可以一定程度上避免错买错卖。
相较于其他常见的均线交易策略,该策略具有以下几个优势:
-
基于Ichimoku指标,对趋势判断更准确。Ichimoku指标由多条均线组成,综合判断趋势更为可靠,避免单一均线产生的噪音。
-
多条均线组合,形成交易过滤效果更好。突破云带作为附加条件,可以避免错误信号。
-
风险可控。通过设置止损天线,可以及时止损,有效控制风险。
-
回撤较小。相较于其他趋势策略更少产生较长时间的逆市操作,最大程度减少回撤损失。
-
参数调整灵活。可以根据市场行情通过调整均线参数灵活适应不同行情。
该策略仍然存在一定的风险需要注意:
-
震荡行情表现较差。当出现长时间震荡整理的市场时,该策略容易产生小幅度的反复交易导致浮亏。
-
趋势反转识别不足。Ichimoku指标对于短期内的趋势反转判断能力较弱,可能错失反转机会或遭遇突然反转的风险。
-
参数设置依赖经验。不同参数设置会对策略表现产生较大影响,需要依赖丰富的历史经验进行调整。
针对上述风险,该策略可以从以下几个方面进行优化:
-
结合波动率指标等判断震荡行情,设置策略状态避免无效交易。
-
增加趋势反转信号模块,如加入移动平均线反向交叉组合判断。
-
利用机器学习等方法自动优化参数,减少人工经验依赖。
-
设置动态止损线。根据市场波动性实时调整止损幅度,降低风险。
整体来看,该策略整合利用Ichimoku指标的优势,在捕捉趋势行情方面表现出较强的优势。通过适当参数设置及优化调整,可以进一步提高策略稳定性,使其成为一个值得考虑投入实盘的高效策略。
||
This is a quantitative trend-following strategy based on the Ichimoku indicator. It mainly constructs long and short positions under specific conditions to track market trends, combined with certain stop loss mechanisms to control risks.
The core of this strategy is to build trading signals based on the Ichimoku indicator with certain parameter settings. The Ichimoku indicator consists of four lines: the conversion line, the base line, the leading span A and the lagging span B. The conversion line is commonly known as the Tenkan-sen and the base line is called the Kijun-sen. This strategy sets up different parameters for Tenkan-sen and Kijun-sen to generate golden cross and dead cross trading signals. In addition, it also incorporates cloud breakouts as an auxiliary condition to trigger entries.
Specifically, the strategy mainly follows these trading rules:
-
Go long when price breaks above the Tenkan-sen and leaves the cloud;
-
Close long positions when price falls below the Tenkan-sen;
-
Go short when price breaks below the Kijun-sen and enters the cloud;
-
Close short positions when price rises back above the Tenkan-sen.
Through such long and short trading principles, the strategy can effectively capture trending moves in the market. Meanwhile, incorporating cloud breakouts filters out false signals to some extent.
Compared with other common moving average trading strategies, this strategy has the following advantages:
-
More accurate trend judgment based on Ichimoku. Ichimoku consists of multiple moving averages, making it more reliable for trend recognition and filtering out noise from single MAs.
-
Better filter effect with multiple lines. Additional filter from cloud breakouts avoids false signals.
-
Controllable risks. Setting stop loss line allows timely stop loss and risk control.
-
Smaller drawdowns. Less adverse trades compared to other trend following strategies reduces drawdown loss.
-
Flexible parameter tuning. Parameters can be adjusted to adapt to different market conditions.
There are still some risks to note for this strategy:
-
Poor performance in range-bound markets. Whipsaws may occur leading to float losses.
-
Inadequate reversal recognition. Weak in identifying short-term trend reversals, may miss opportunities or encounter sudden reversals.
-
Reliance on empirical parameter tuning. Different parameters can significantly impact performance which requires abundant historical experience.
The following aspects can be optimized to address the above risks:
-
Add volatility indicators to detect non-trending markets and pause strategy.
-
Incorporate additional reversal signals like moving average crossovers.
-
Utilize machine learning for automated parameter optimization instead of manual tuning.
-
Set up dynamic stop loss lines based on market volatility.
In general, this strategy leverages the strength of Ichimoku in catching trending moves. With proper parameter tuning and optimizations, it can achieve better robustness and serve as an efficient strategy worth considering for live trading.
[/trans]
Strategy Arguments
| Argument | Default | Description |
|---|---|---|
| v_input_1 | 10 | Tenkan-sen |
| v_input_2 | 30 | Kijun-sen |
| v_input_3 | 60 | Senkou Span B |
| v_input_4 | 30 | Chikou Span (Displacement) |
Source (PineScript)
/*backtest
start: 2022-12-13 00:00:00
end: 2023-12-19 00:00:00
period: 1d
basePeriod: 1h
exchanges: [{"eid":"Futures_Binance","currency":"BTC_USDT"}]
*/

//@version=3
strategy(title="RENKO ICHIMOKU STRATEGY", shorttitle="RENKO ICHIMOKU STRATEGY", overlay=true)
ro = open
rc = close

tenkanSenPeriods = input(10, minval=1, title="Tenkan-sen"),
kijunSenPeriods = input(30, minval=1, title="Kijun-sen")
SenkouSpanBPeriods = input(60, minval=1, title="Senkou Span B"),
displacement = input(30, minval=1, title="Chikou Span (Displacement)")

donchian(len) => avg(lowest(len), highest(len))

tenkanSen = donchian(tenkanSenPeriods)
kijunSen = donchian(kijunSenPeriods)
SenkouSpanA = avg(tenkanSen, kijunSen)
SenkouSpanB = donchian(SenkouSpanBPeriods)

plot(tenkanSen, color=#0496ff, linewidth=2, title="Tenkan-sen")
// plot(kijunSen, color=#991515, title="Kijun-sen")
// plot(close, offset = -displacement, color=#459915, title="Chikou Span")

p1 = plot(SenkouSpanA, offset = displacement, color=green, title="Senkou Span A")
p2 = plot(SenkouSpanB, offset = displacement, color=red, title="Senkou Span B")
fill(p1, p2, color = SenkouSpanA > SenkouSpanB ? green : red)

// Entry/Exit Signals
tk_cross_bull = tenkanSen > kijunSen
tk_cross_bear = tenkanSen < kijunSen

price_below_tenkan = open < tenkanSen and close < tenkanSen
price_above_tenkan = open > tenkanSen and close > tenkanSen

price_below_kinjun = close < kijunSen
price_above_kinjun = close > kijunSen

tekan_above_kinjun = tenkanSen > kijunSen
tekan_below_kinjun = tenkanSen < kijunSen

ss_high = max(SenkouSpanA[displacement-1], SenkouSpanB[displacement-1])
ss_low = min(SenkouSpanA[displacement-1], SenkouSpanB[displacement-1])
price_inside_kumo = close > ss_high and close < ss_low

price_below_kumo = rc[1] < ro[1] and rc[0] < ro[0] and rc[1] < ss_low
price_above_kumo = rc[1] > ro[1] and rc[0] > ro[0] and rc[1] > ss_high

cs_cross_bull = mom(close, displacement-1) > 0
cs_cross_bear = mom(close, displacement-1) < 0

bullish = cs_cross_bull and not price_inside_kumo
bearish = cs_cross_bear and not price_inside_kumo


strategy.entry("Long", strategy.long, when=price_above_kumo and price_above_tenkan )
strategy.close("Long", when=price_below_tenkan )

strategy.entry("Short", strategy.short, when=price_below_kumo and price_below_tenkan )
strategy.close("Short", when=price_above_tenkan )

// longCondition = crossover(sma(close, 14), sma(close, 28))
// if (longCondition)
//     strategy.entry("My Long Entry Id", strategy.long)

// shortCondition = crossunder(sma(close, 14), sma(close, 28))
// if (shortCondition)
//     strategy.entry("My Short Entry Id", strategy.short)
Detail
https://www.fmz.com/strategy/435974
Last Modified
2023-12-20 15:08:22
