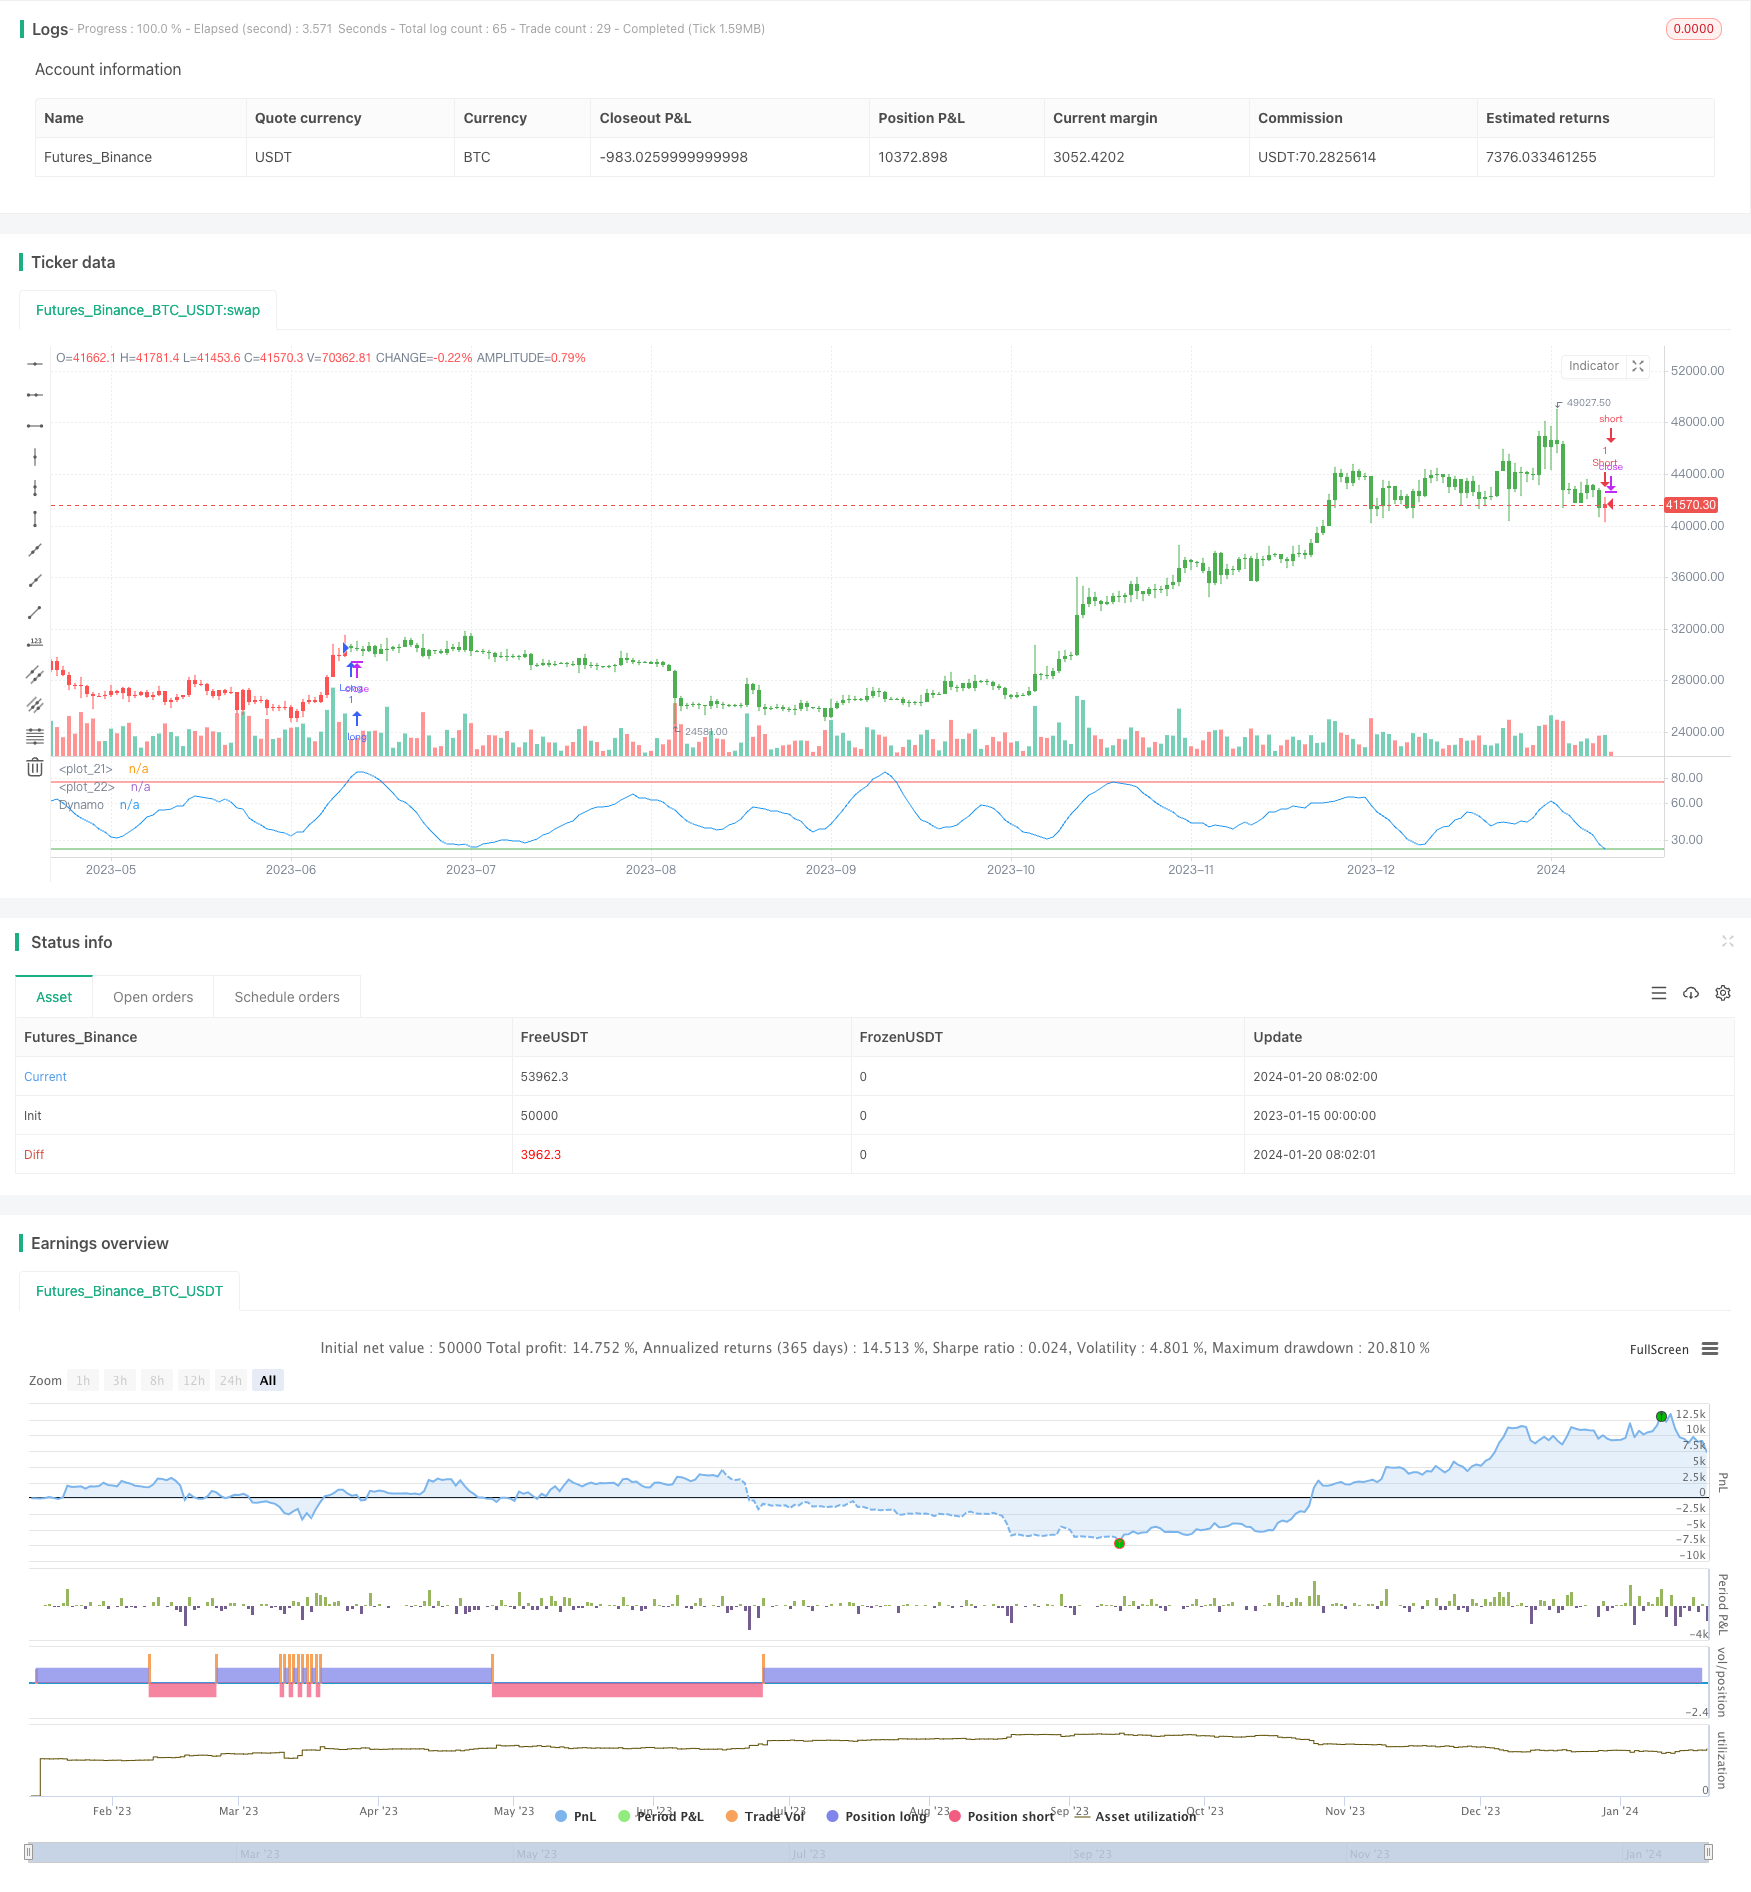
Name
动态动量震荡器交易策略Dynamic-Momentum-Oscillator-Trading-Strategy
Author
ChaoZhang
Strategy Description
[trans]
动态动量震荡器交易策略(Dynamic Momentum Oscillator Trading Strategy)基于E. Marshall Wall在1996年7月《期货》杂志上发表的文章中提出的动态动量震荡器(Dynamo)指标,对标准震荡器进行了正常化处理,以消除趋势的影响。
该策略首先计算一个长度为10日的随机指数(Stochastic Oscillator),然后计算该指数的10日简单移动平均,再基于这个移动平均计算20日移动平均。这组成了动态动量震荡器的计算基础。
Strategy接着计算了指数的最高值和最低值,然后计算中间值。它将20日均线与原指数做差,再从中间值中减去这个差值,形成标准化后的震荡器值。当这个标准化值高于77时做多,低于23时做空。
该策略的主要优势有:
-
利用动态动量震荡器指标消除了趋势的影响,使得交易信号更加可靠。
-
结合超买超卖区域,可以在反转点产生较准确的交易信号。
-
规则简单清晰,容易实施。
该策略的主要风险有:
-
市场暴震时,指标发出错误信号的概率会较大。可以设置止损来控制风险。
-
震荡市场中,会频繁产生假信号。可以适当调整参数,过滤掉一些噪音。
-
交易频率可能较高,交易成本会对盈利产生一定影响。
该策略可以从以下几个方面进行优化:
-
测试不同市场的数据,寻找最佳合约和最优参数组合。
-
增加过滤条件,在发出信号前判断趋势力度,避免在震荡行情中被套。
-
增加止损机制。当价格向不利方向突破某个阈值时,选择止损退出。
-
可以基于该策略,开发出更复杂的交易系统,结合多个其他指标进行决策。
动态动量震荡器交易策略通过消除趋势影响,在超买超卖区域发出较准确的交易信号。该策略简单易行,容易实施,但也存在一定风险。通过参数和规则优化,可以进一步改善系统稳定性和盈利能力。
||
The Dynamic Momentum Oscillator Trading Strategy is based on the Dynamo indicator proposed by E. Marshall Wall in an article published in Futures magazine in July 1996. It normalizes a standard oscillator to eliminate the impact of trends.
The strategy first calculates a 10-day Stochastic Oscillator, then calculates its 10-day simple moving average, and further calculates a 20-day moving average based on that. This forms the foundation for the Dynamo calculation.
The strategy then calculates the highest and lowest values of the oscillator and computes the midpoint. It takes the difference between the 20-day average and the original oscillator and subtracts that difference from the midpoint to form a normalized oscillator value. It goes long when this normalized value is above 77 and goes short when it's below 23.
The main advantages of this strategy are:
-
By utilizing the Dynamo indicator, it eliminates the impact of trends and generates more reliable trading signals.
-
By combining overbought/oversold areas, it can produce relatively accurate signals at turning points.
-
The rules are simple and clear, easy to implement.
The main risks of this strategy are:
-
At market shocks, the probability of wrong signals from the indicator will be higher. Stop loss can be used to control the risk.
-
In oscillating markets, frequent false signals may occur. Parameters can be adjusted to filter out some noise.
-
High trading frequency may lead to considerable trading costs that eat into profits.
The strategy can be optimized in the following aspects:
-
Test data from different markets to find the optimal contract and parameter combinations.
-
Add filters to judge the strength of the trend before signals to avoid being trapped in oscillating markets.
-
Incorporate stop loss mechanisms. Exit trades when prices breach certain thresholds in unfavorable directions.
-
Develop more complex trading systems based on this strategy by combining signals from multiple other indicators.
The Dynamic Momentum Oscillator Trading Strategy generates relatively accurate trading signals by eliminating trend impact and using overbought/oversold areas. The strategy is simple and easy to implement but also has some risks. Further improvements to stability and profitability can be achieved by optimizing parameters and rules.
[/trans]
Strategy Arguments
| Argument | Default | Description |
|---|---|---|
| v_input_1 | 10 | OscLen |
| v_input_2 | 20 | MALen |
| v_input_3 | 77 | HiBand |
| v_input_4 | 23 | LowBand |
| v_input_5 | false | Trade reverse |
Source (PineScript)
/*backtest
start: 2023-01-15 00:00:00
end: 2024-01-21 00:00:00
period: 1d
basePeriod: 1h
exchanges: [{"eid":"Futures_Binance","currency":"BTC_USDT"}]
*/

//@version=2
////////////////////////////////////////////////////////////
//  Copyright by HPotter v1.0 10/04/2017
// In July 1996 Futures magazine, E. Marshall Wall introduces the
// Dynamic Momentum Oscillator (Dynamo). Please refer to this article
// for interpretation.
// The Dynamo oscillator is a normalizing function which adjusts the
// values of a standard oscillator for trendiness by taking the difference
// between the value of the oscillator and a moving average of the oscillator
// and then subtracting that value from the oscillator midpoint.
//
// You can change long to short in the Input Settings
// Please, use it only for learning or paper trading. Do not for real trading
////////////////////////////////////////////////////////////
strategy(title="Dynamo", shorttitle="Dynamo")
OscLen = input(10, minval=1)
MALen = input(20, minval=1)
HiBand = input(77, minval=1)
LowBand = input(23)
reverse = input(false, title="Trade reverse")
hline(HiBand, color=red, linestyle=line)
hline(LowBand, color=green, linestyle=line)
xOscK = stoch(close, high, low, OscLen)
xOscAvg = sma(xOscK, OscLen)
xMAVal = sma(xOscAvg, MALen)
maxNum = 9999999
LowestSoFar = iff(xOscAvg < nz(LowestSoFar[1], maxNum), xOscAvg, nz(LowestSoFar[1], maxNum))
HighestSoFar = iff(xOscAvg > nz(HighestSoFar[1]), xOscAvg, nz(HighestSoFar[1]))
MidPnt = (LowestSoFar + HighestSoFar) / 2
nRes = MidPnt - (xMAVal - xOscAvg)
pos = iff(nRes > HiBand, 1,
	     iff(nRes < LowBand, -1, nz(pos[1], 0)))
possig = iff(reverse and pos == 1, -1,
          iff(reverse and pos == -1, 1, pos))
if (possig == 1)
    strategy.entry("Long", strategy.long)
if (possig == -1)
    strategy.entry("Short", strategy.short)
barcolor(possig == -1 ? red: possig == 1 ? green : blue )
plot(nRes, color=blue, title="Dynamo")
Detail
https://www.fmz.com/strategy/439649
Last Modified
2024-01-22 17:28:39
