Name
动态圣诞老人回归策略Dynamic-Santa-Claus-Regression-Strategy
Author
ChaoZhang
Strategy Description
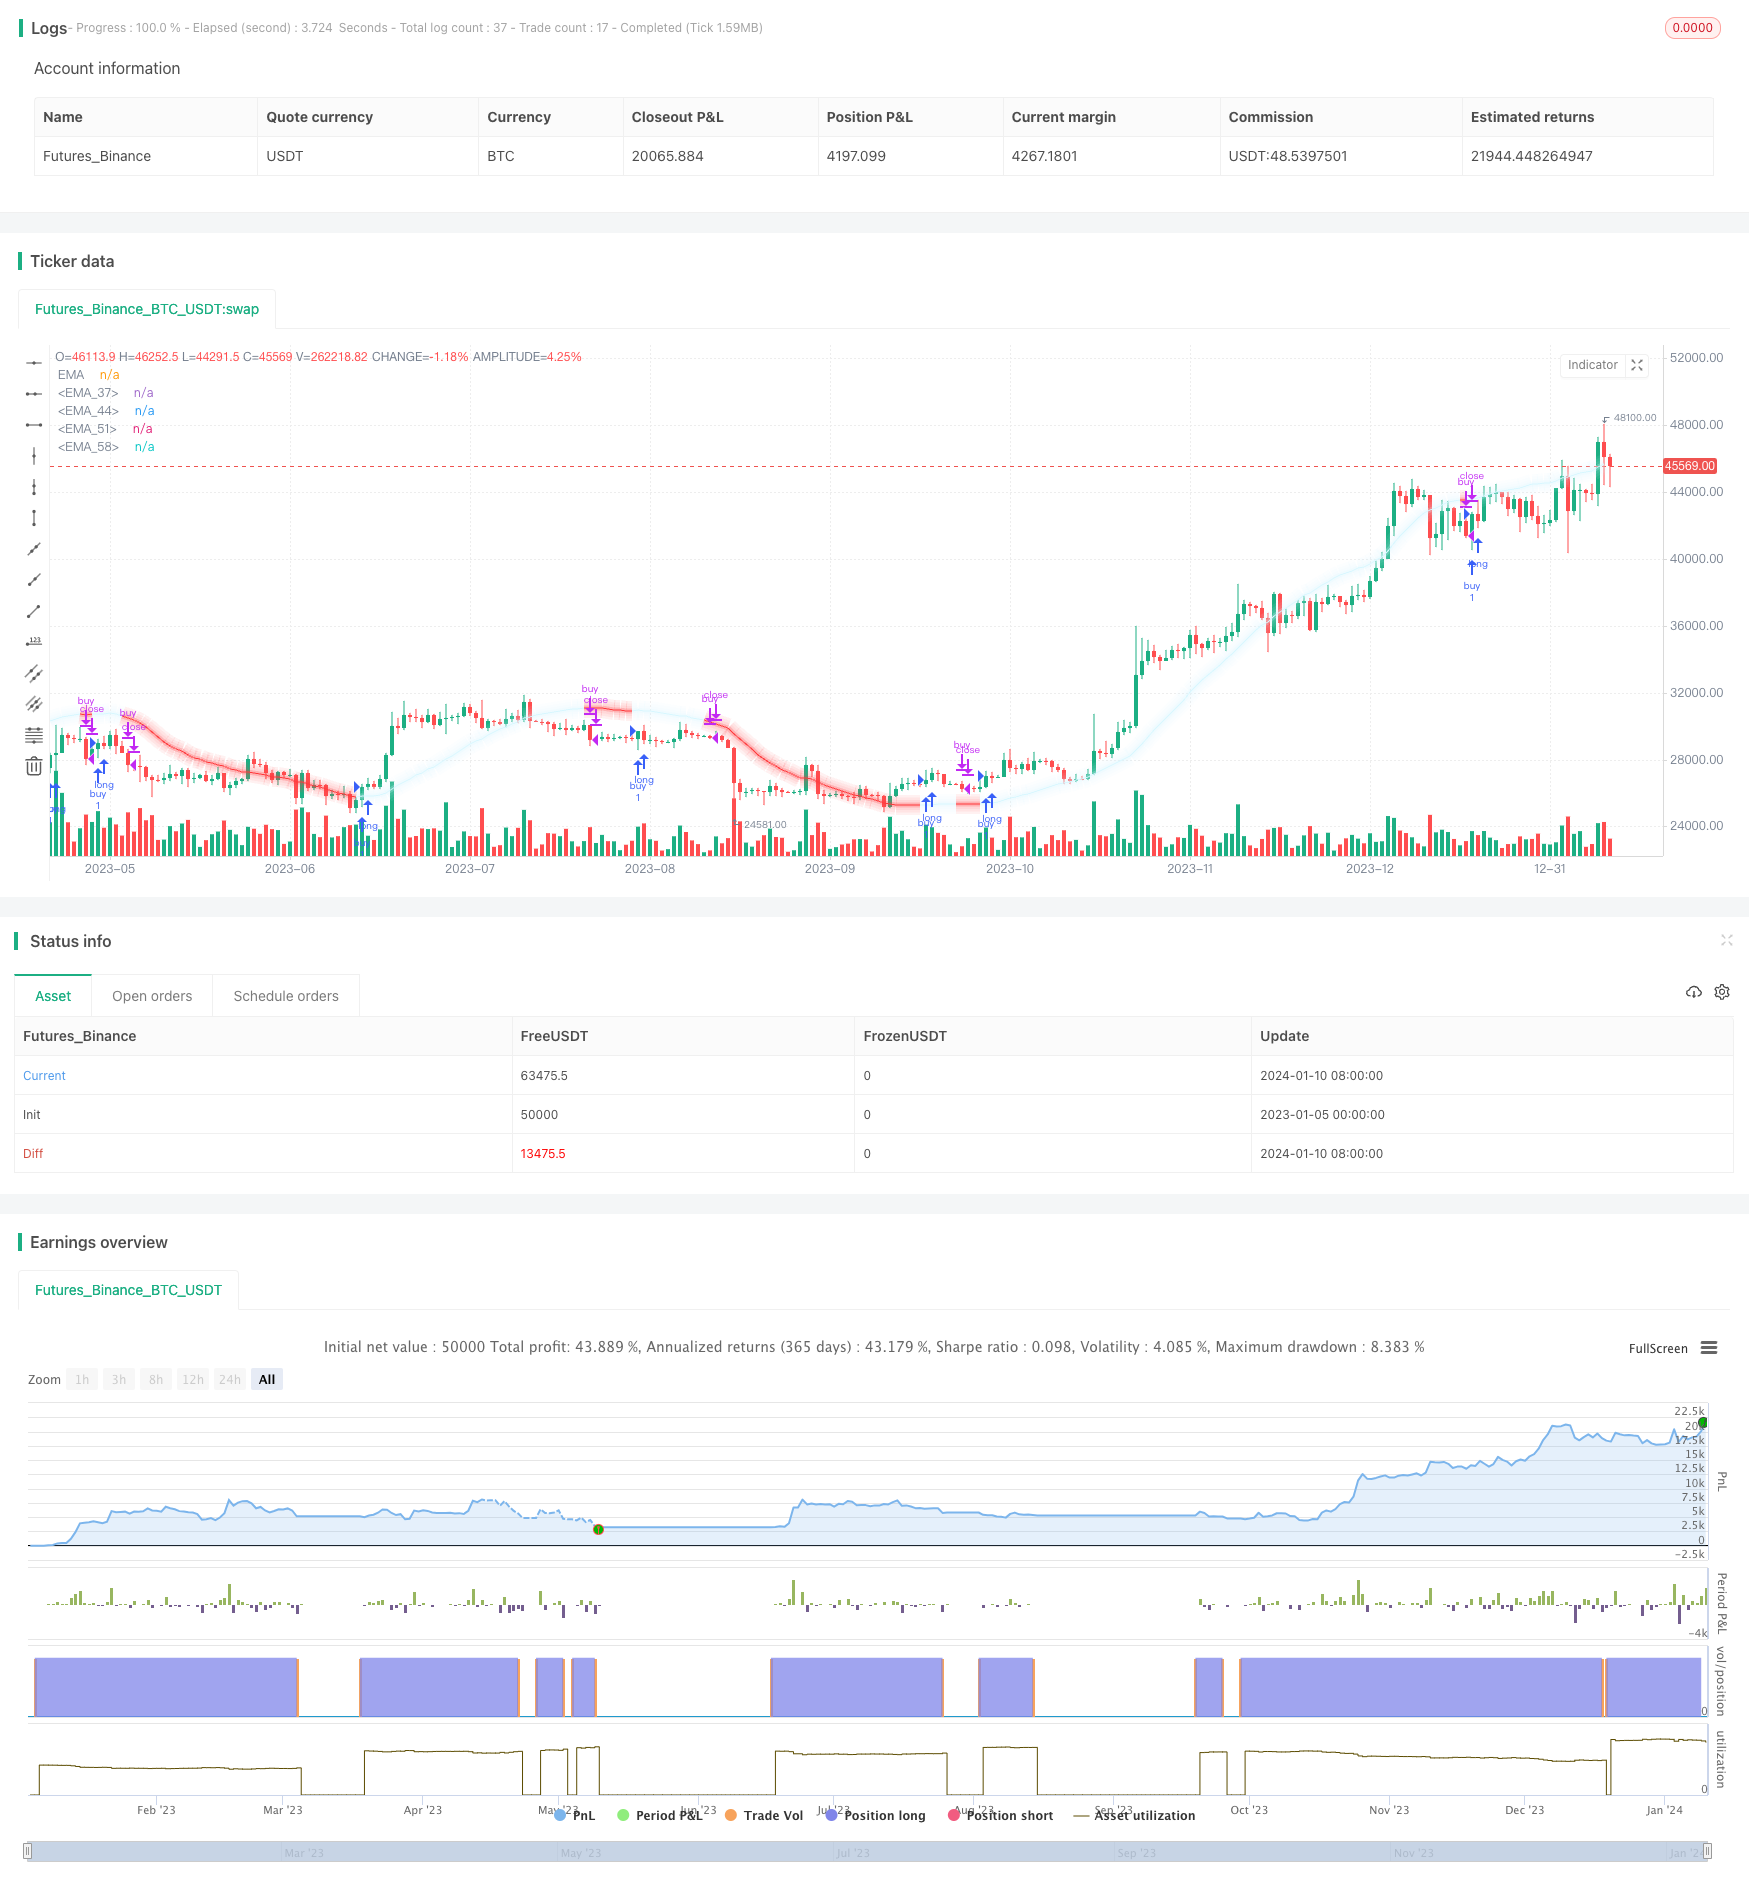
动态圣诞老人回归策略是一种根据价格和柱线索引之间的动态回归关系,识别潜在入场和出场点的量化交易策略。该策略使用长度可调的参数动态均线,绘制价格的回归趋势线。通过分析回归线的方向,判断是否入场或出场。
该策略的核心是计算价格和柱线索引之间的线性回归关系。首先计算长度为N的简单移动平均线和标准差。然后基于样本相关系数和标准差比值,求出回归线的斜率k和截距b。这样就得到了一个动态调整的线性回归方程:
y = kx + b
其中,x为柱线索引,y为价格。
根据回归线当前时刻与上一时刻的大小关系,判断趋势方向。如果回归线上涨且收盘价高于开盘价和前一时刻最高价,则产生买入信号;如果回归线下跌且收盘价低于开盘价和前一时刻最低价,则产生卖出信号。
- 动态参数设定,可以通过调整N的值来适应不同周期的价格变动
- 回归关系考虑了时间因素的影响,更能反映价格的趋势性
- 结合多种条件判断产生交易信号,避免误导
- 直观展示价格回归趋势,清晰可读
- N值设置不当,可能导致回归线过于平滑或敏感
- 解决方法:调整N值,找到最佳平衡点
- 短期内价格震荡,回归关系判断失败
- 解决方法:结合其他指标过滤入场点
- 环比只考虑一个时点,可能漏掉局部极值
- 解决方法:设置适当宽松区间,避免误判
- 增加动态退出机制,根据回归关系调整止损点
- 结合交易量等指标进行信号验证,减少错误交易
- 利用机器学习方法自动优化参数,适应更广泛的市场环境
- 增加图形展示,更直观地呈现策略效果
动态圣诞老人回归策略利用价格和时间的动态回归关系,实现了一个灵活、直观、参数可调的量化交易系统。该策略逻辑清晰、易于理解,通过参数优化可以适用于不同的交易产品和周期。本策略的创新之处在于引入时间因素建立动态模型,使判断更具有趋势性。总的来说,该策略为量化交易提供了一个值得参考的样本。
||
The Dynamic Santa Claus Regression Strategy is a quantitative trading strategy that identifies potential entry and exit points based on the dynamic regression relationship between price and bar index. This strategy uses a dynamically adjustable moving average parameter to plot the regression trend line of prices. By analyzing the direction of the regression line, it determines whether to enter or exit positions.
The core of this strategy is to calculate the linear regression relationship between price and bar index. It first calculates simple moving averages and standard deviations of length N. Then based on sample correlation coefficients and standard deviation ratios, it obtains the slope k and intercept b of the regression line. This results in a dynamically adjusted linear regression equation:
y = kx + b
where x is the bar index, and y is the price.
According to the magnitude relationship between the current and previous values of the regression line, the trend direction is determined. If the regression line is rising and the closing price is higher than the opening price and the highest price of the previous moment, a buy signal is generated. If the regression line falls and the closing price is lower than the opening price and the lowest price of the previous moment, a sell signal is generated.
- Dynamic parameter settings that can adapt to price changes of different cycles by adjusting the N value
- The regression relationship considers the influence of time factors and better reflects the trend of prices
- The combination of multiple condition judgments generates trading signals and avoids misguidance
- Intuitive display of price regression trends, clear and easy to read
-
Improper N value setting may cause the regression line to be too smooth or sensitive
- Solution: Adjust the N value to find the optimal balance
-
Price volatility in the short term, regression relationship judgment fails
- Solution: Combine with other indicators to filter entry points
-
The ring ratio only considers one point in time and may miss local extremes
- Solution: Set an appropriately loose interval to avoid misjudgment
- Increase dynamic exit mechanisms and adjust stop loss points based on regression relationships
- Combine trading volume and other indicators for signal verification to reduce erroneous transactions
- Use machine learning methods to automatically optimize parameters and adapt to a wider range of market environments
- Add graphical displays for a more intuitive demonstration of strategy effectiveness
The Dynamic Santa Claus Regression Strategy utilizes the dynamic regression relationship between price and time to implement a flexible, intuitive, and adjustable quantitative trading system. The logic of this strategy is clear and easy to understand. Through parameter optimization, it can be applied to different trading products and cycles. The innovation of this strategy lies in the introduction of time factors to establish a dynamic model, making judgments more trending. In summary, this strategy provides a worthwhile sample for quantitative trading.
[/trans]
Strategy Arguments
| Argument | Default | Description |
|---|---|---|
| v_input_1 | 64 | length |
Source (PineScript)
/*backtest
start: 2023-01-05 00:00:00
end: 2024-01-11 00:00:00
period: 1d
basePeriod: 1h
exchanges: [{"eid":"Futures_Binance","currency":"BTC_USDT"}]
*/

//@version=5
// Creator - TradeAI
strategy('Moving Santa Claus Strategy | TradeAI', overlay=true)

// Set the length of the moving average
length = input(64)

// Calculate the moving averages and standard deviations
x = bar_index
y = close
x_ = ta.sma(x, length)
y_ = ta.sma(y, length)
mx = ta.stdev(x, length)
my = ta.stdev(y, length)
c = ta.correlation(x, y, length)
slope = c * (my / mx)

// Calculate the parameters of the regression line
inter = y_ - slope * x_
reg = x * slope + inter

// Set the line color based on whether EMA is moving up or down
var color lineColor = na
if (reg > reg[1] and (close > open and close > high[1]))
    lineColor := color.new(#d8f7ff, 0)
if (reg < reg[1] and (close < open and close < low[1]))
    lineColor := color.new(#ff383b, 0)

// Plot the EMA line with different thicknesses
plot(reg, color=lineColor, title="EMA")

var color lineColorrr = na
if (reg > reg[1] and (close > open and close > high[1]))
    lineColorrr := color.new(#d8f7ff, 77)
if (reg < reg[1] and (close < open and close < low[1]))
    lineColorrr := color.new(#ff383b, 77)
plot(reg, color=lineColorrr, title="EMA", linewidth=5)

var color lineColorr = na
if (reg > reg[1] and (close > open and close > high[1]))
    lineColorr := color.new(#d8f7ff, 93)
if (reg < reg[1] and (close < open and close < low[1]))
    lineColorr := color.new(#ff383b, 93)
plot(reg, color=lineColorr, title="EMA", linewidth=10)

var color lineColorrrr = na
if (reg > reg[1] and (close > open and close > high[1]))
    lineColorrrr := color.new(#d8f7ff, 97)
if (reg < reg[1] and (close < open and close < low[1]))
    lineColorrrr := color.new(#ff383b, 97)
plot(reg, color=lineColorr, title="EMA", linewidth=15)

var color lineColorrrrr = na
if (reg > reg[1] and (close > open and close > high[1]))
    lineColorrrrr := color.new(#d8f7ff, 99)
if (reg < reg[1] and (close < open and close < low[1]))
    lineColorrrrr := color.new(#ff383b, 99)
plot(reg, color=lineColorr, title="EMA", linewidth=20)

// Implement trading strategy based on EMA direction
if reg > reg[1] and (close > open and close > high[1])
    strategy.entry('buy', strategy.long)

if reg < reg[1] and (close < open and close < low[1])
    strategy.close('buy')
Detail
https://www.fmz.com/strategy/438483
Last Modified
2024-01-12 14:00:00
