Name
动态均线跟踪策略Dynamic-Moving-Average-Tracking-Strategy
Author
ChaoZhang
Strategy Description
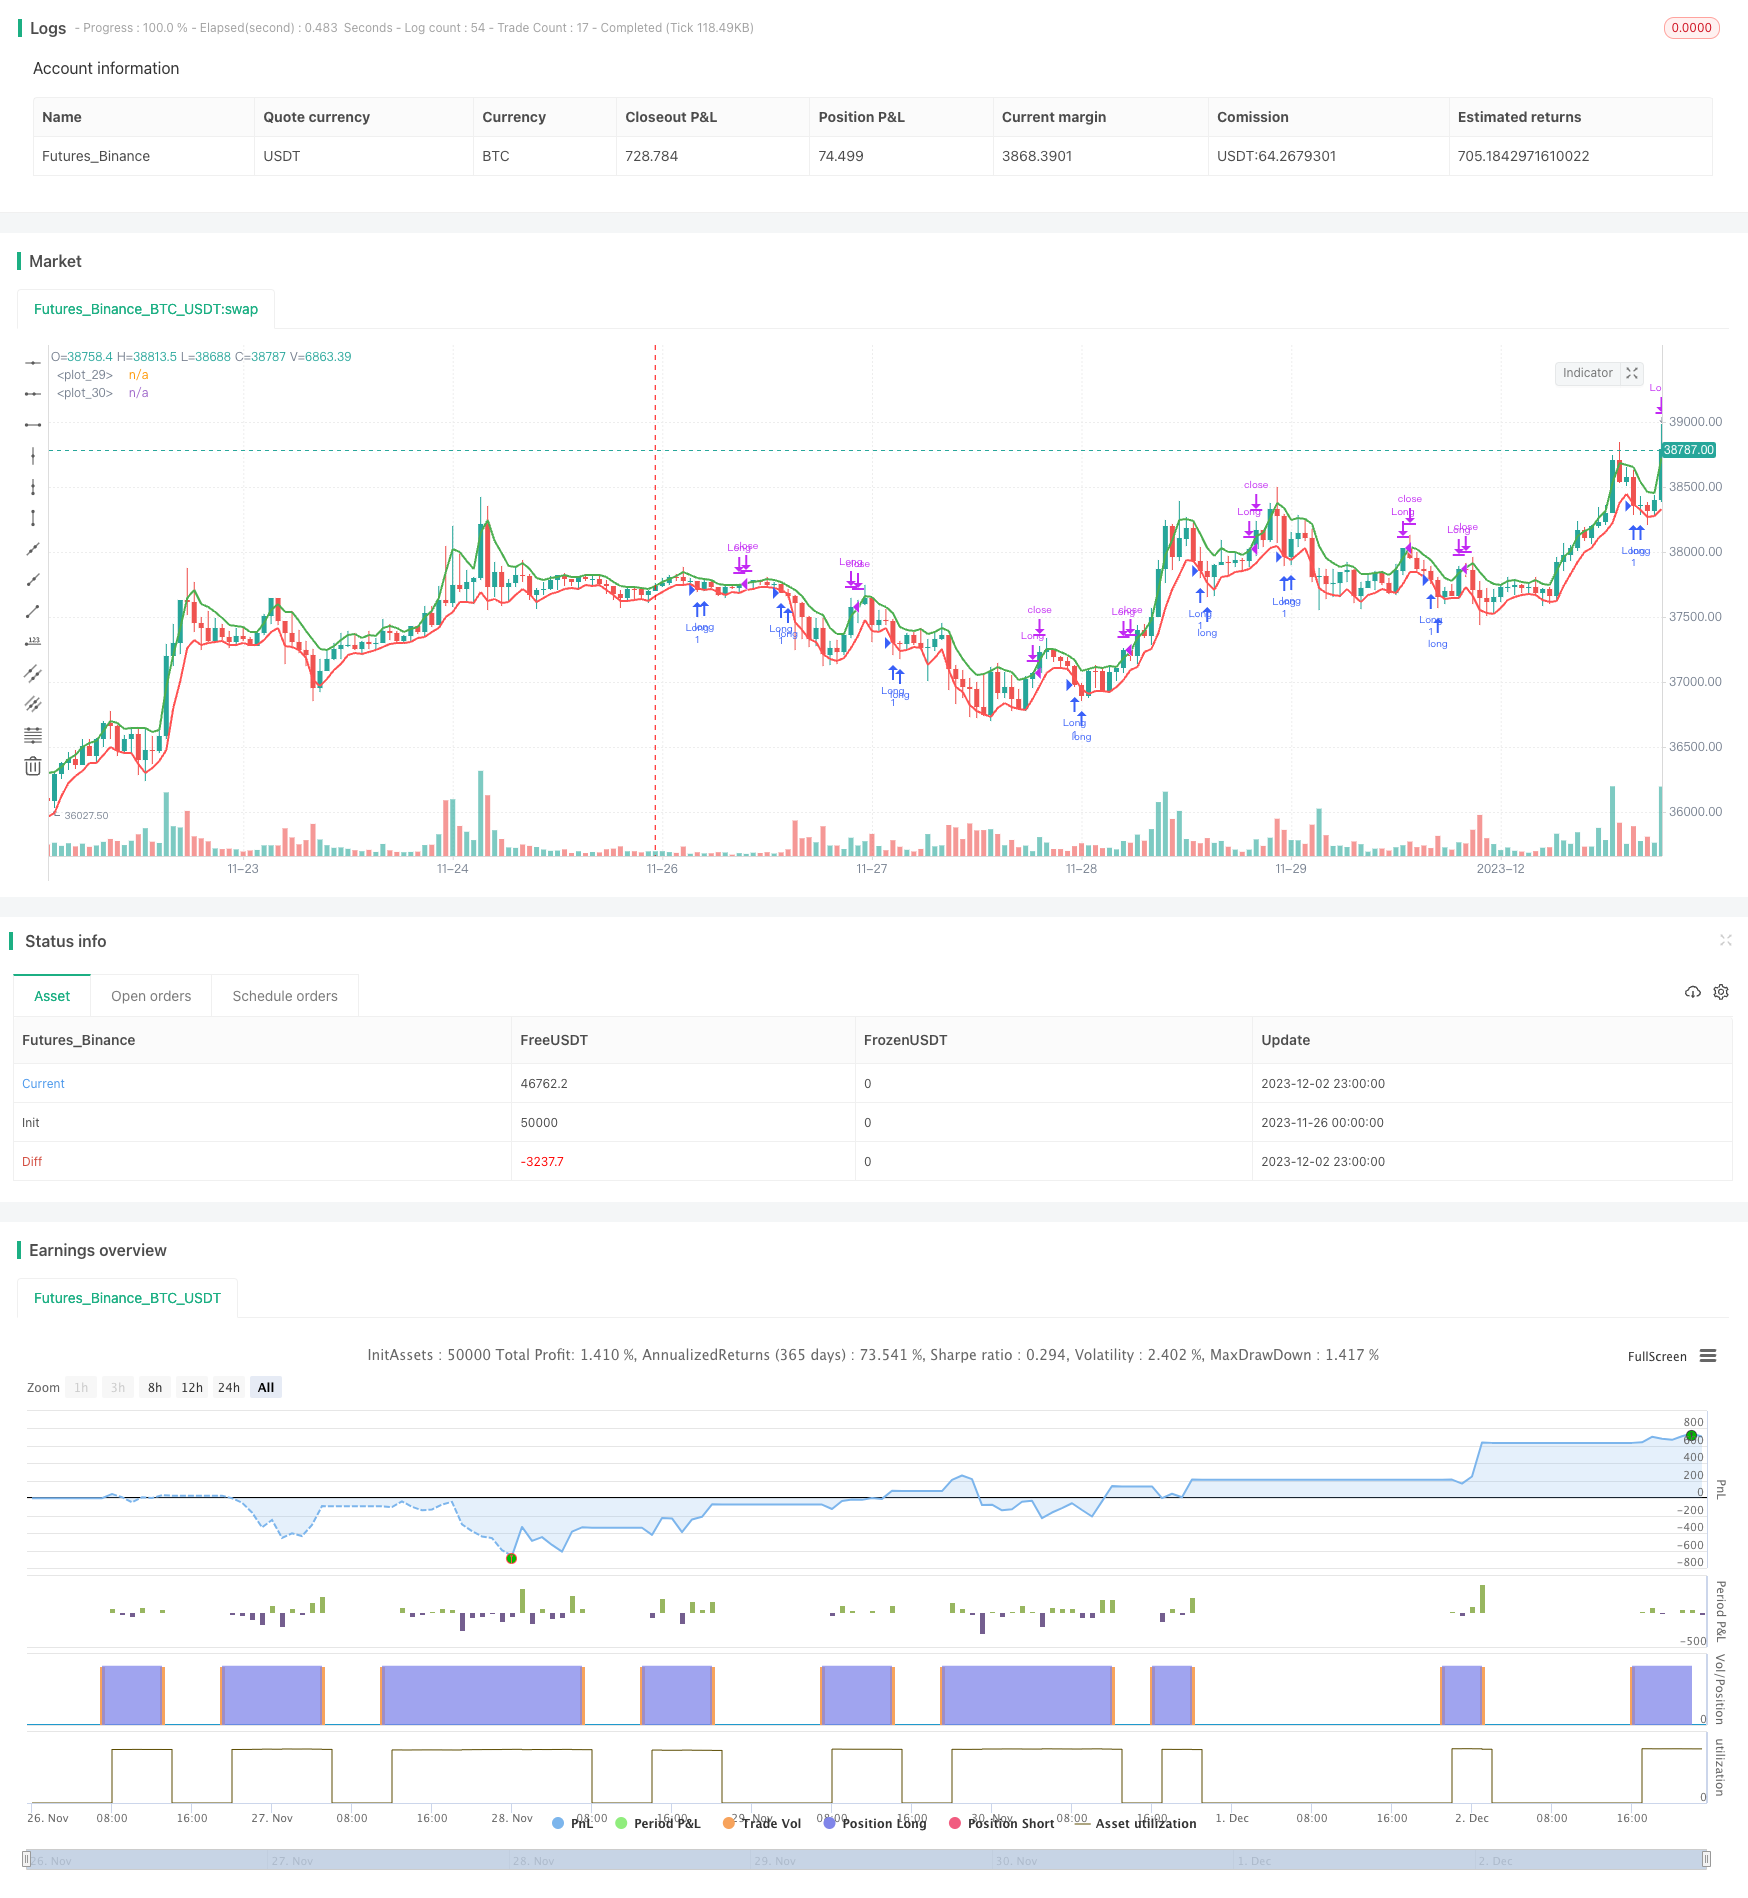
本策略采用拉里·威廉姆斯在他的书《长期秘密短期交易》中解释的策略,该策略使用两个3期移动平均线,一个代表高点,另一个代表低点。当价格低于3期低点移动平均线时,我们有一个长仓信号。该交易在价格收盘高于3期高点移动平均线时平仓。
该策略的核心逻辑是计算高低点的3期移动平均线。具体来说,它使用ta.ema函数计算最近3个bar的高点和低点的指数移动平均线,以产生动态的支持和阻力位。当价格跌破低点均线时,表明目前处于跌势,这样我们就可以做多;当价格重新回升到高点均线以上时,说明上涨趋势结束,我们就要平仓了。通过这种方式,策略可以动态跟踪价格变化,实现低买高卖。
该策略最大的优势在于其简单和动态性。相比传统的取一定周期的高低点均线,该策略采用的是连续计算的短期移动平均,能更敏感和及时地捕捉到价格变化。这使得它可以快速地识别出买卖点,从而进入和退出市场。此外,计算量小是它的另一个优势,有利于降低交易延迟。
该策略主要的风险在于它对突发事件如重大新闻事件反应较慢。由于其移动平均线周期很短,当出现价格剧烈波动时,它需要一定时间来调整均线的位置。这可能导致亏损或错过机会。此外,过于灵敏也可能造成错误交易。为降低这些风险,我们可以适当延长移动平均线的周期数,或者增加过滤条件来避免错误信号。
该策略还有很大的优化空间。首先,我们可以结合其他指标如震荡指标进行过滤,使信号更可靠。其次,也可以增加止损逻辑以控制风险。再者,我们也可以根据市场状态动态调整移动平均线参数,在趋势市场中延长周期,在震荡市场中缩短周期。此外,多时间框架分析和机器学习识别模式等方式都可以用来提高策略表现。
本策略整体来说非常简单实用,通过高低点的短期均线实现对趋势的判断。它的优点是动态性强,计算量小,实时性高,适合频繁交易。但也存在对突发事件反应不灵敏和信号错误率较高的问题。这些问题都有改进和优化的方向,通过参数调整、过滤条件以及模式识别等手段,该策略的效果还可以得到进一步提升。
||
This strategy uses the approach explained by Larry Williams in his book "Long-Term Secrets to Short-Term Trading", which utilizes two 3-period moving averages, one representing the Highs and the other the Lows. When the price falls below the 3-period Lows EMA we have a long signal. The trade is closed when the price closes above the 3-period Highs EMA.
The core logic of this strategy is to compute 3-period moving averages of the high and low prices. Specifically, it uses the ta.ema function to calculate exponential moving averages of the high and low prices over the most recent 3 bars to generate dynamic support and resistance levels. When the price breaks below the lows EMA, it indicates a downtrend, so we can go long. When the price rises back above the highs EMA, it suggests the uptrend has ended and we should close our position. In this way, the strategy can dynamically track price changes and achieve buying low and selling high.
The biggest advantage of this strategy is its simplicity and dynamism. Compared to taking fixed period highs/lows moving averages, this strategy uses continuous short-term moving averages, which can more sensitively and timely capture price changes. This allows it to quickly identify trading opportunities to enter and exit the market. Also, low computation load is another advantage for reducing trading latency.
The main risk of this strategy is that it reacts slower to sudden events like significant news. Because its moving average period is very short, it takes some time to adjust the moving average levels when there is a sharp price spike. This may lead to losses or missing opportunities. Also, oversensitivity may cause wrong trades. To mitigate these risks, we can appropriately increase the moving average period, or add filters to avoid false signals.
There is still large room for optimizing this strategy. Firstly, oscillators can be incorporated to filter the signals. Secondly, stop loss logic could be added to control risks. Also, we can dynamically tune the moving average parameters based on market states, using longer periods in trending and shorter periods in ranging markets. Additionally, multi-timeframe analysis, pattern recognition with machine learning etc. can help improve strategy performance.
In summary, this is a very simple and practical strategy, identifying trends using short-term high/low moving averages. Its advantages are strong dynamism, low computation, and high responsiveness, suitable for active trading. But it also has deficiencies in responding to extreme events and higher false signals risk. There are directions to address these issues through parameter tuning, adding filters, and pattern recognition techniques to further lift the strategy efficacy.
[/trans]
Strategy Arguments
| Argument | Default | Description |
|---|---|---|
| v_input_int_1 | true | Start Date |
| v_input_int_2 | true | Start Month |
| v_input_int_3 | 2018 | Start Year |
| v_input_int_4 | 31 | End Date |
| v_input_int_5 | 12 | End Month |
| v_input_int_6 | 2041 | End Year |
Source (PineScript)
/*backtest
start: 2023-11-26 00:00:00
end: 2023-12-03 00:00:00
period: 1h
basePeriod: 15m
exchanges: [{"eid":"Futures_Binance","currency":"BTC_USDT"}]
*/

//@version=5
strategy(
     "Larry Williams 3 Period EMAs strategy",
     overlay=true,
     calc_on_every_tick=true,
     currency=currency.USD
     )

// Time range for backtesting
startDate = input.int(title="Start Date", defval=1, minval=1, maxval=31)
startMonth = input.int(title="Start Month", defval=1, minval=1, maxval=12)
startYear = input.int(title="Start Year", defval=2018, minval=1800, maxval=2100)

endDate = input.int(title="End Date", defval=31, minval=1, maxval=31)
endMonth = input.int(title="End Month", defval=12, minval=1, maxval=12)
endYear = input.int(title="End Year", defval=2041, minval=1800, maxval=2100)

inDateRange = (time >= timestamp(syminfo.timezone, startYear, startMonth, startDate, 0, 0)) and
     (time < timestamp(syminfo.timezone, endYear, endMonth, endDate, 0, 0))

// EMA
period = 3

emaH = ta.ema(high, period)
emaL = ta.ema(low, period)

// PLOT:
// Draw the EMA lines on the chart
plot(series=emaH, color=color.green, linewidth=2)
plot(series=emaL, color=color.red, linewidth=2)

// Conditions
if(inDateRange and close < emaL)
    strategy.entry("Long", strategy.long, comment="Long")
if(close > emaH)
    strategy.close("Long", comment="Close Long")

// Uncomment to enable short entries
//if(inDateRange and close > emaH)
//    strategy.entry("Short", strategy.short, comment="Short")
//if(close < emaL)
//    strategy.close("Short", comment="Close Short")
Detail
https://www.fmz.com/strategy/434184
Last Modified
2023-12-04 15:38:09
