Name
动态止损追涨策略Dynamic-Stop-Loss-Trail-Strategy
Author
ChaoZhang
Strategy Description
[trans]
动态止损追涨策略通过计算股票的平均真实波动范围ATR作为基准,结合用户设定的ATR系数动态设定止损线和追涨线,实现止损追涨的目的。当股票价格突破追涨线时,采用传统趋势追踪策略建立多头头寸;当股票价格跌破止损线时,采用反转策略建立空头头寸,运用双向交易获利。
该策略主要运用了ATR技术指标计算股价的平均真实波动范围,并结合用户输入的ATR系数作为股票突破买入和止损卖出的依据。具体来说,策略首先计算股票过去120天的ATR值,然后乘以用户设定的卖出ATR系数得到止损卖出参考价,即止损线;乘以买入ATR系数得到买入参考价,即追涨线。当今日最高价突破追涨线时,采取趋势追踪策略建立多头头寸;当今日最低价跌破止损线且持有多头头寸时,采取反转策略建立空头头寸。
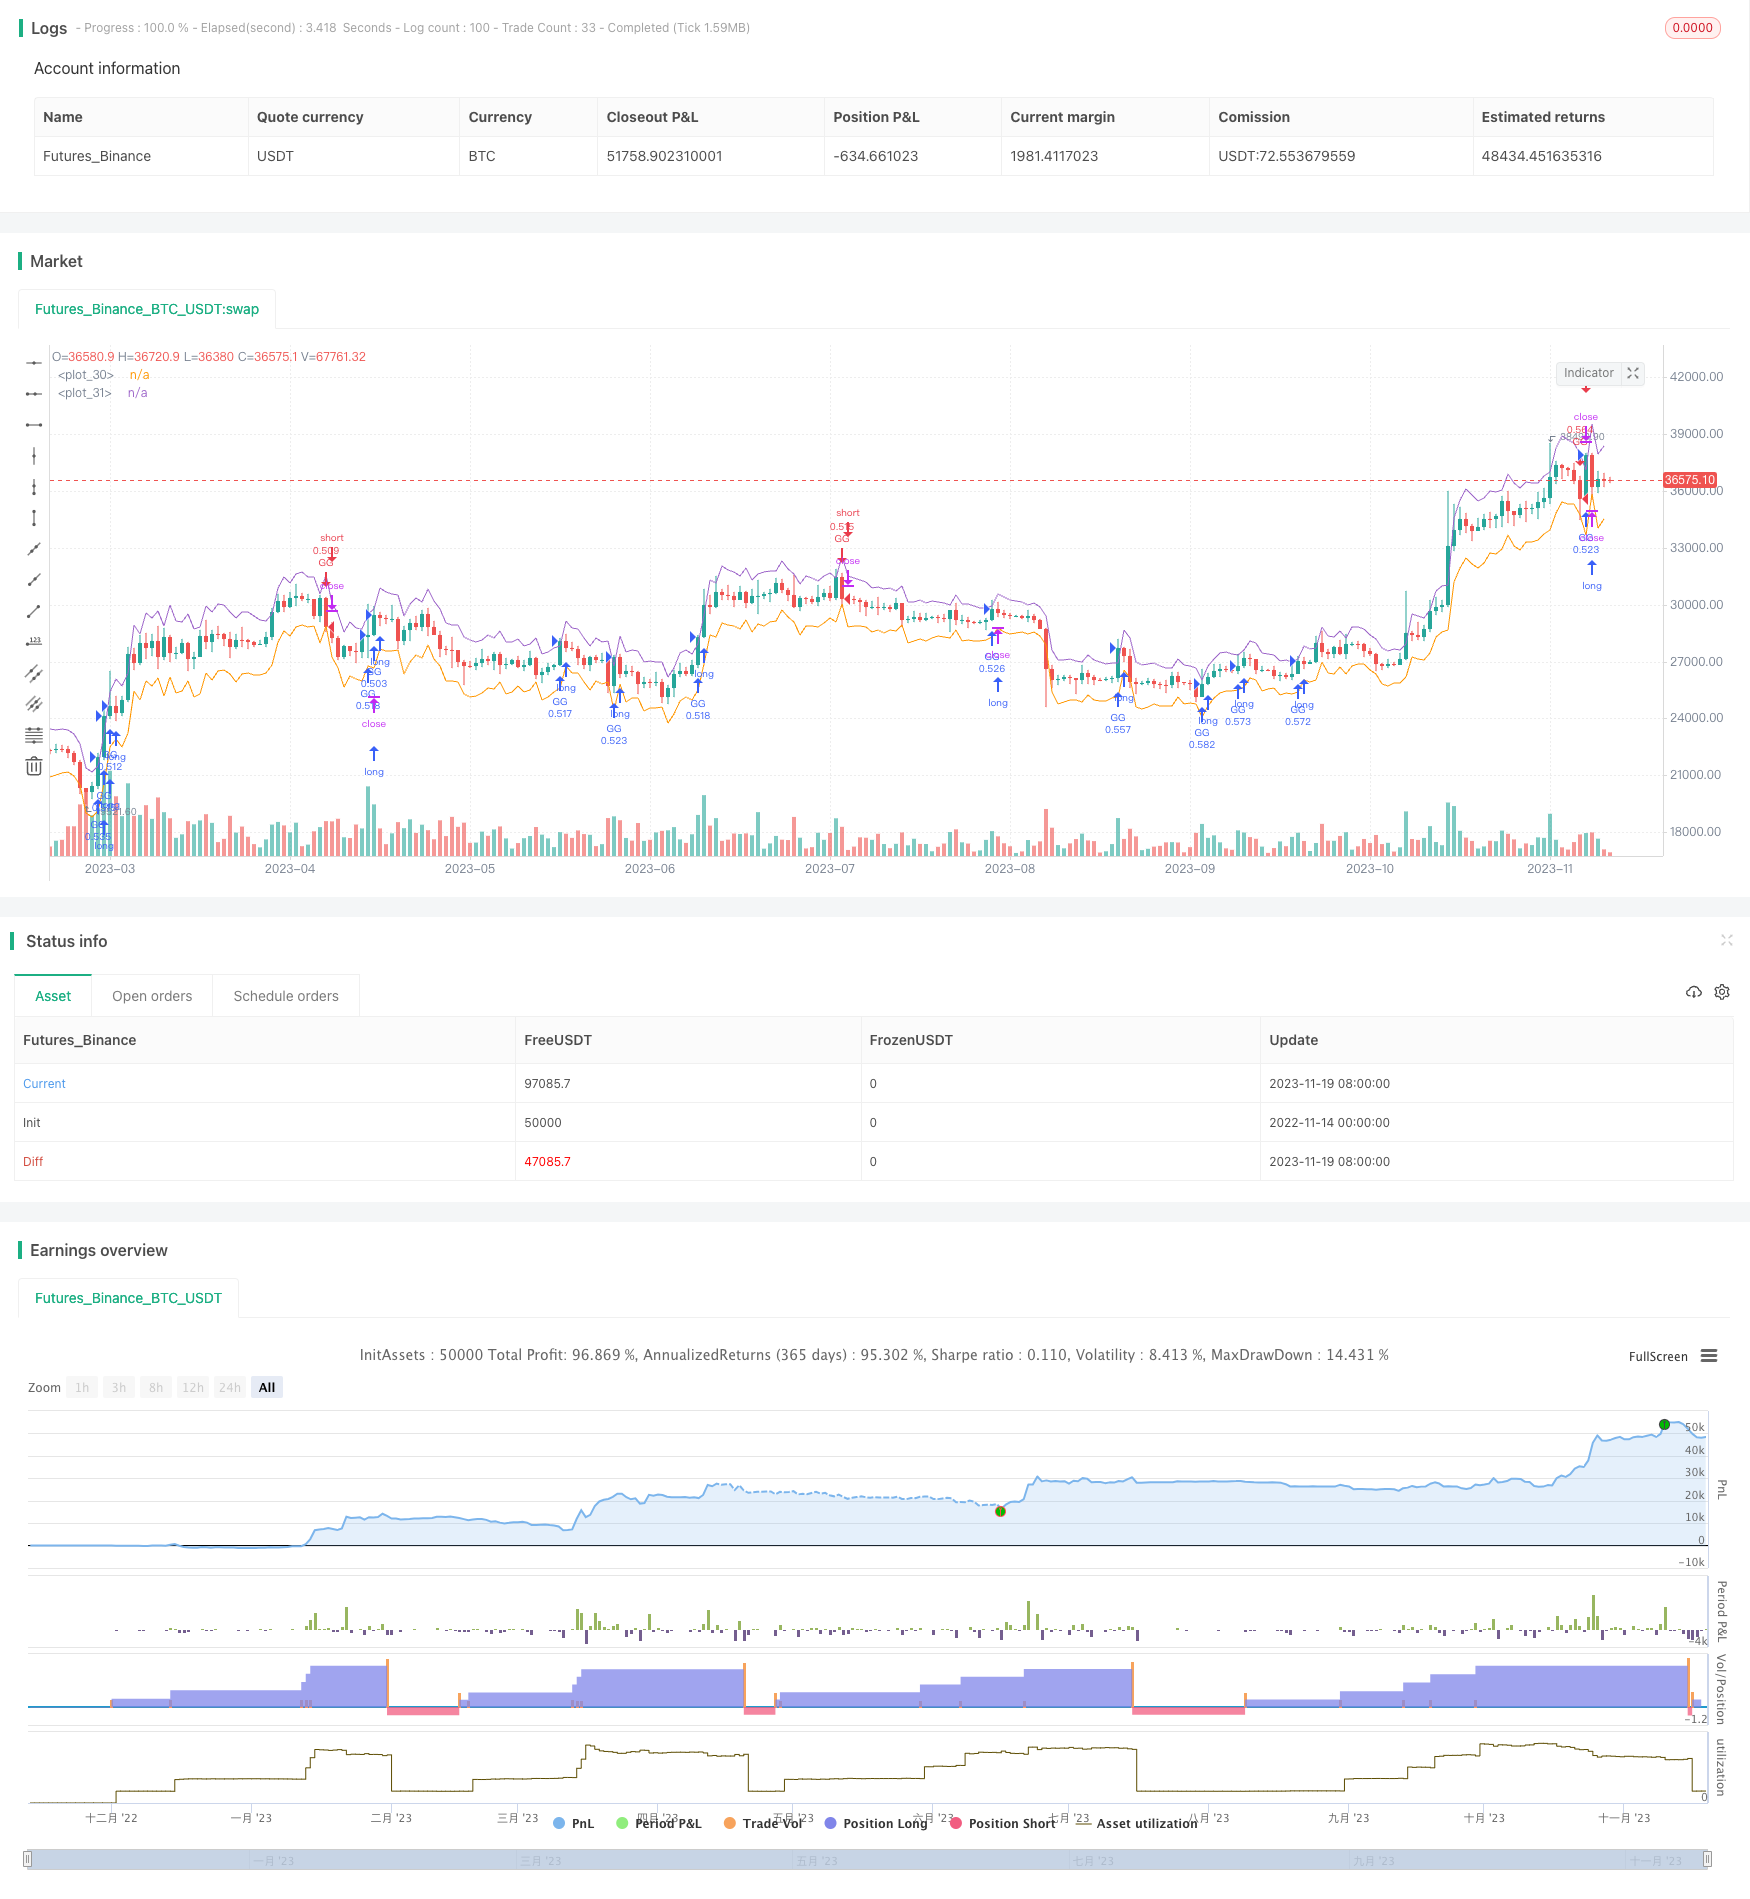
该策略同时绘制了止损线和追涨线,这两条线的位置会根据股价的波动而变化,具有一定的动态追踪功能。ATR指标能较好地反映出股票的平均真实波动程度,运用ATR指标设定止损追涨线,可以一定程度上規避股票巨大波动带来的亏损。
- 利用ATR指标计算股价波动范围,止损追涨线位置合理;
- 止损线和追涨线动态变化,有一定的趋势跟踪能力;
- 同时做多做空,双向交易,获利空间大;
- 适用于高波动的股票,通过ATR指标控制风险。
- ATR指标对突发事件反应不足,无法完全规避风险;
- 追涨买入、止损卖出的判断依据仅仅是突破ATR线,存在一定盲目性,可能发生过度交易;
- 用户输入的ATR系数合理性直接影响策略效果,设定不当可能造成亏损;
- 股票波动减小时,止损追涨频繁发生,过度交易费用增大。
- 结合其他指标判断买卖时机,避免盲目追踪;
- 设定建仓比例和加仓规则,控制风险;
- 加入交易量或波动率过滤,避免过度交易;
- 动态调整ATR参数,优化止损追涨效果。
本策略总体来说是一个典型的止损追涨策略,核心思路是基于ATR指标设定止损线和追涨线,进行趋势跟踪。该策略优点是可以双向交易,持仓灵活;运用ATR指标控制风险,适合于高波动的股票。但由于买卖规则较简单,存在一定的盲目追踪风险;参数设定不当也会影响策略效果。未来可从完善买卖时机判断、控制仓位规模、减少过度交易等方面进行优化,使策略效果更加稳定。
||
The dynamic stop loss trail strategy calculates the average true range (ATR) of stocks as a benchmark, combined with ATR coefficients set by users to dynamically set stop loss lines and trail lines to achieve the purpose of stop loss trail. When the stock price breaks through the trail line, a long position is established using a traditional trend tracking strategy; when the stock price falls below the stop loss line, a short position is established using a reversal strategy to make profits through two-way trading.
The strategy mainly uses the ATR technical indicator to calculate the average true range of stock prices, and combines ATR coefficients entered by users as benchmarks for stock breakout purchases and stop loss sells. Specifically, the strategy first calculates the ATR value of the stock over the past 120 days, then multiplies by the sell ATR coefficient set by the user to obtain the stop loss sell reference price, i.e. the stop loss line; multiplies by the buy ATR coefficient to obtain the buy reference price, i.e. the trail line. When today's highest price breaks through the trail line, a long position is established using a trend tracking strategy; when today's lowest price falls below the stop loss line and holds a long position, a short position is established using a reversal strategy.
The strategy also draws stop loss lines and trail lines. The positions of these two lines will change according to fluctuations in stock prices, with some dynamic tracking capabilities. The ATR indicator can better reflect the average true fluctuation range of a stock. Using the ATR indicator to set stop loss trail lines can help avoid losses caused by huge stock fluctuations to some extent.
- Use ATR indicators to calculate stock price fluctuation range, stop loss trail line position is reasonable;
- Stop loss lines and trail lines change dynamically, with some trend tracking capability;
- Go long and short at the same time, two-way trading, more profit space;
- Suitable for highly volatile stocks, ATR indicators help control risks.
- ATR indicators react inadequately to emergencies, cannot completely avoid risks;
- Trailing buy-ins and stop loss sells are solely based on breaking ATR lines, there is some blind obedience, over-trading may occur;
- The rationality of user-entered ATR coefficients directly affects strategy efficacy, improper settings may cause losses;
- When stock fluctuation decreases, frequent stop loss trail may increase trading costs.
- Combine other indicators to determine trading time, avoid blind tracking;
- Set position sizing rules and pyramiding rules to control risks;
- Add trading volume or volatility filters to avoid excessive trading;
- Dynamically adjust ATR parameters to optimize stop loss trail effect.
In summary, this is a typical stop loss trail strategy. The core idea is to set stop loss lines and trail lines based on ATR indicators for trend tracking. The advantages of this strategy are that two-way trading is enabled and positions are flexible; ATR indicators help control risks making it suitable for highly volatile stocks. However, there are some blind tracking risks due to rather simple trading rules; improper parameter settings also affect strategy efficacy. Future optimizations may focus on improving trade timing, controlling position sizes, reducing excess trading, etc. to make strategy performance more robust.
[/trans]
Strategy Arguments
| Argument | Default | Description |
|---|---|---|
| v_input_1 | 120 | Days Back |
| v_input_2 | 1.5 | Selling Coefficent For ATR |
| v_input_3 | 1.2 | Buying Coefficent For ATR |
Source (PineScript)
/*backtest
start: 2022-11-14 00:00:00
end: 2023-11-20 00:00:00
period: 1d
basePeriod: 1h
exchanges: [{"eid":"Futures_Binance","currency":"BTC_USDT"}]
*/

// This source code is subject to the terms of the Mozilla Public License 2.0 at https://mozilla.org/MPL/2.0/
// © phobo3s

//@version=4
strategy("ATR Stop Buy Strategy",shorttitle="ATR-ST",initial_capital=1000, overlay = true, default_qty_type = strategy.percent_of_equity, pyramiding = 5, default_qty_value = 20, commission_type = strategy.commission.cash_per_order, commission_value = 1, calc_on_every_tick = true)

daysBack = input(defval=120, title="Days Back", type=input.integer)
sellCoeff = input(defval=1.5, title="Selling Coefficent For ATR", type=input.float, minval= 0.01, step=0.1)
buyCoeff = input(defval=1.2, title = "Buying Coefficent For ATR", type=input.float, minval= 0.01, step=0.1)

fromDate = timenow - (daysBack*24*60*60*1000)
toDate = timenow

ATR = atr(14)
stopLossPoint = ATR * sellCoeff
buyPoint = ATR * buyCoeff

StoplossLine =  close[1] - stopLossPoint[1]
BuyLine = close[1] + buyPoint[1]

if (high > BuyLine and time >= fromDate and time <= toDate )
    strategy.entry("GG", strategy.long, comment="Gir")
if (low < StoplossLine and strategy.position_avg_price < close and time >= fromDate and time <= toDate )
    strategy.entry("GG", strategy.short, comment="Çık")

//longFlags = close < StoplossLine
//shortFlags = close > BuyLine
//plotshape(shortFlags, style=shape.triangledown, location=location.abovebar, color=color.red)
//plotshape(longFlags, style=shape.triangleup, location=location.belowbar, color=color.blue)
plot(StoplossLine)
plot(BuyLine)
Detail
https://www.fmz.com/strategy/432794
Last Modified
2023-11-21 15:22:44
