Name
动态通道指标突破策略Dynamic-Channel-Breakout-Strategy
Author
ChaoZhang
Strategy Description
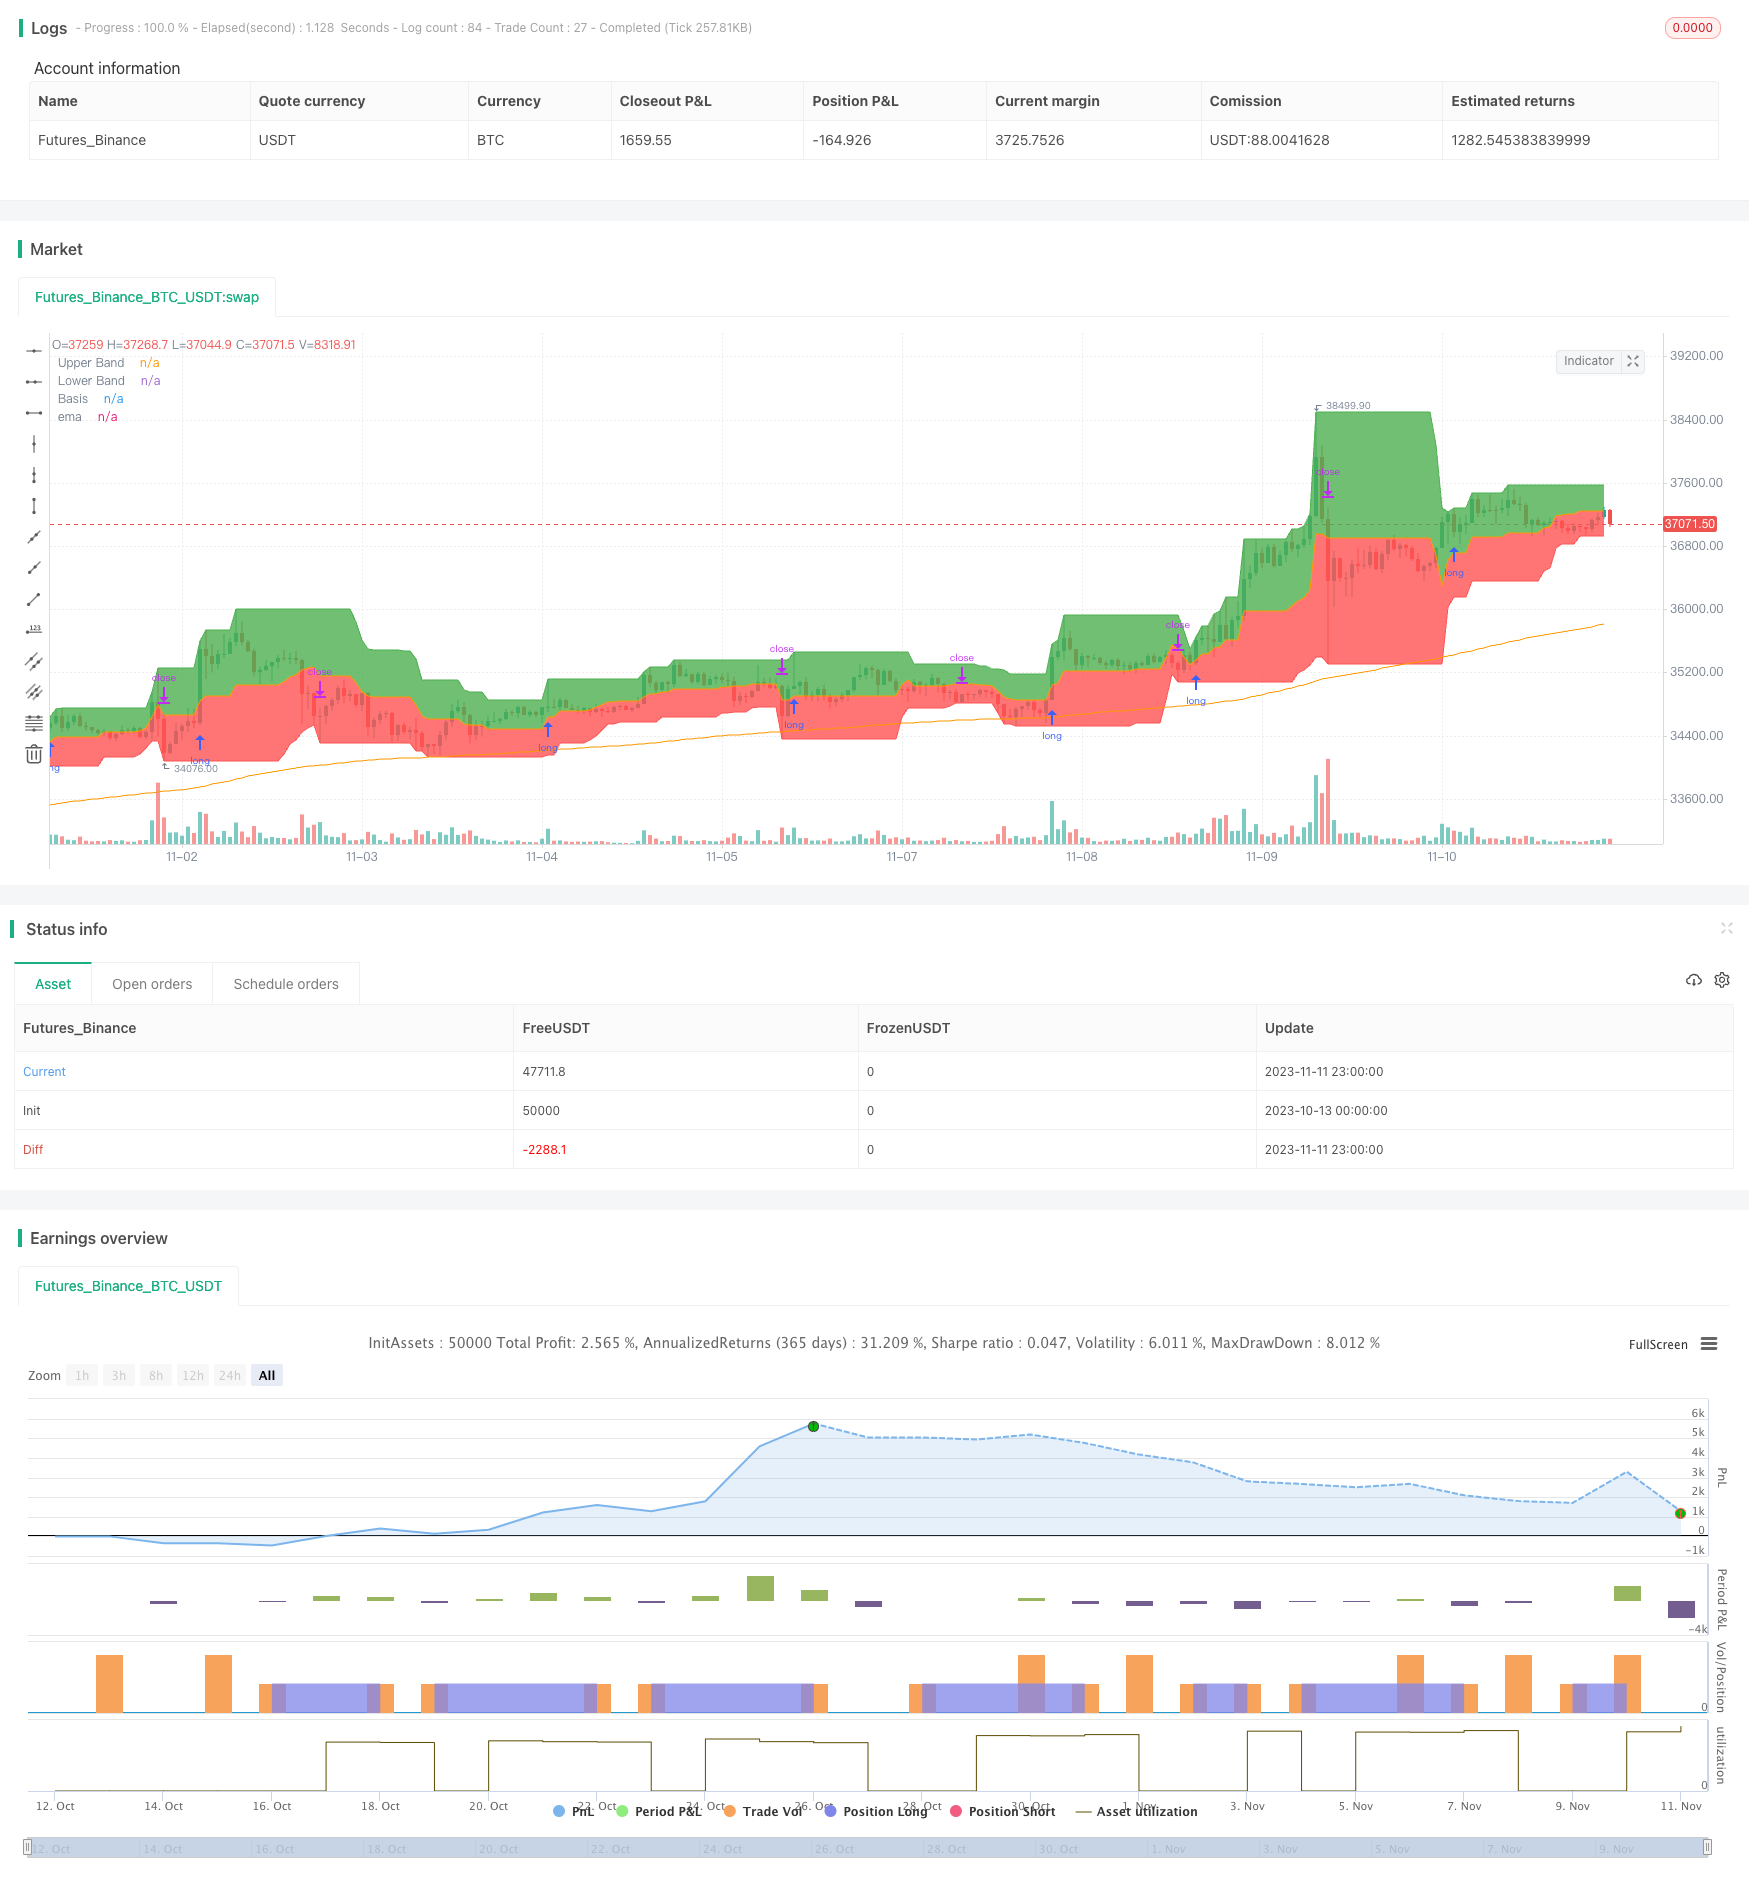
本策略运用动态通道指标,根据通道的突破情况来判断行情方向,以捕捉趋势的方向。该策略主要通过计算一定时间周期内的最高价和最低价,来形成上下通道,在通道突破时产生交易信号。
本策略使用input函数设置通道周期长度length为20天。然后计算最近20天的最高价highest(high, length)作为上轨,最近20天的最低价lowest(low, length)作为下轨。
通道内填充颜色。在上轨之上填充绿色,在下轨之下填充红色,以形成动态通道。
同时绘制200日移动平均线ema(close,200),作为判断趋势的参考。
策略以ema值为判断大趋势的基准。当close大于200日线时为看涨,当close小于200日线时为看跌。
在看涨时,如果收盘价close突破上轨,产生做多信号;在看跌时,如果收盘价close突破下轨,产生做空信号。
做多止损根据长短规则设置为下轨或中线,做空止损根据长短规则设置为上轨或中线。
-
使用动态通道,能够捕捉市场变化趋势。
-
根据突破产生交易信号,遵循趋势交易思路。
-
基于移动平均线判断大趋势方向,与通道突破结合使用。
-
止损方式灵活,可根据市场调整。
-
大趋势判断错误,可能与市场产生背离。
-
通道周期设置不当,将增加错误交易的概率。
-
止损点靠近通道,可能增加止损被触发的概率。
-
突破信号存在一定滞后,可能错过最佳入场点位。
对策:
-
基于多种指标结合判断大趋势,减少错误概率。
-
优化通道周期参数,使其适应不同市场节奏。
-
调整止损位置,确保有足够缓冲空间。
-
结合其他指标过滤入场信号。
-
增加大趋势判断指标,形成指标组合,提高判断准确率。
-
添加交易量指标,避免虚假突破。
-
优化通道周期参数,使其更符合不同品种特点。
-
优化止损策略,实现止损动态跟踪。
-
增加过滤器,提高信号质量,减少不必要交易。
本策略整体遵循趋势交易思路,运用动态通道判断波动范围和突破形成交易信号,可有效跟踪趋势变化,是一种可靠的趋势跟踪策略。但仍需优化大趋势判断和止损方式,并增加过滤条件,以提高策略稳定性。该策略适用于追踪中长线趋势,可结合其他策略组成多策略portfolio,对冲系统风险。
||
This strategy utilizes the dynamic channel indicator to determine market direction based on channel breakouts, aiming to capture trend directionality. It mainly calculates the highest high and lowest low over a certain period to form upper and lower channels, generating trading signals when the price breaks through the channels.
The strategy uses the input function to set the channel period length to 20 days. It then calculates the highest high over the past 20 days as the upper band, and the lowest low over the past 20 days as the lower band.
The channel is filled with color. The area above the upper band is filled with green, and the area below the lower band is filled with red, forming a dynamic channel.
The 200-day moving average ema(close,200) is also plotted as a reference to determine the overall trend.
The strategy uses the ema as the benchmark to judge the major trend. When close is above the 200-day line, it indicates an uptrend. When close is below, it indicates a downtrend.
In an uptrend, if the closing price close breaks through the upper band, a long signal is generated. In a downtrend, if close breaks the lower band, a short signal is generated.
The long stop loss is set at the lower band or middle line based on the long/short rules. The short stop loss is set at the upper band or middle line.
-
The dynamic channel adapts to changing market trends.
-
Trading signals are generated based on breakouts, following the trend trading principle.
-
The major trend is determined by moving average, combined with channel breakouts.
-
Flexible stop loss placement based on market conditions.
-
Wrong judgement of the major trend may deviate from the market.
-
Improper channel period setting increases incorrect trading.
-
Stop loss being too close to the channel may increase being stopped out.
-
Breakout signals have some lag, possibly missing the best entry point.
Solutions:
-
Use multiple indicators to judge the major trend, reducing errors.
-
Optimize channel period parameters for different market rhythms.
-
Adjust stop loss position to have enough buffer.
-
Add filters to screen entry signals.
-
Add more indicators to judge the major trend, improving accuracy.
-
Incorporate volume indicators to avoid false breakouts.
-
Optimize channel period parameters for different products.
-
Implement dynamic trailing stop loss.
-
Add filters to improve signal quality and avoid unnecessary trades.
This strategy follows the trend trading principle overall, using dynamic channels to determine volatility range and generating signals from breakouts. It can effectively track trend changes and is a reliable trend following strategy. But major trend judgement and stop loss mechanisms need further optimization and filtering conditions should be added to improve robustness. The strategy suits mid-to-long term trend tracking, and can be combined with other strategies in a portfolio to hedge risks.
[/trans]
Strategy Arguments
| Argument | Default | Description |
|---|---|---|
| v_input_1 | 20 | length |
| v_input_2 | 0 | Long Entry: Higher High |
| v_input_3 | 0 | Short Entry: Lower Low |
| v_input_4 | 0 | LONG SL: Lower Low |
| v_input_5 | 0 | SHORT SL: Higher High |
Source (PineScript)
/*backtest
start: 2023-10-13 00:00:00
end: 2023-11-12 00:00:00
period: 1h
basePeriod: 15m
exchanges: [{"eid":"Futures_Binance","currency":"BTC_USDT"}]
*/

// This source code is subject to the terms of the Mozilla Public License 2.0 at https://mozilla.org/MPL/2.0/
// © pratyush_trades

//@version=4
strategy("Donchian Indexes", overlay=true)

length = input(20)
longRule = input("Higher High", "Long Entry", options=["Higher High", "Basis"])
shortRule = input("Lower Low", "Short Entry", options=["Lower Low", "Basis"])
longSL=input("Lower Low", "LONG SL", options=["Lower Low", "Basis"])
shortSL=input("Higher High", "SHORT SL", options=["Higher High", "Basis"])

hh = highest(high, length)
ll = lowest(low, length)

up = plot(hh, 'Upper Band', color = color.green)
dw = plot(ll, 'Lower Band', color = color.red)
mid = (hh + ll) / 2
midPlot = plot(mid, 'Basis', color = color.orange)
fill(up, midPlot, color=color.green, transp = 95)
fill(dw, midPlot, color=color.red, transp = 95)
plot(ema(close,200), "ema", color=color.orange)

if (close>ema(close,200))
    if (not na(close[length]))
        strategy.entry("Long", strategy.long, stop=longRule=='Basis' ? mid : hh)

if (close<ema(close,200))
    if (not na(close[length]))
        strategy.entry("Short", strategy.short, stop=shortRule=='Basis' ? mid : ll)

if (strategy.position_size>0)
    strategy.exit(id="Longs Exit",stop=longSL=='Basis' ? mid : ll)

if (strategy.position_size<0)
    strategy.exit(id="Shorts Exit",stop=shortSL=='Basis' ? mid : hh)
Detail
https://www.fmz.com/strategy/431895
Last Modified
2023-11-13 10:33:44
