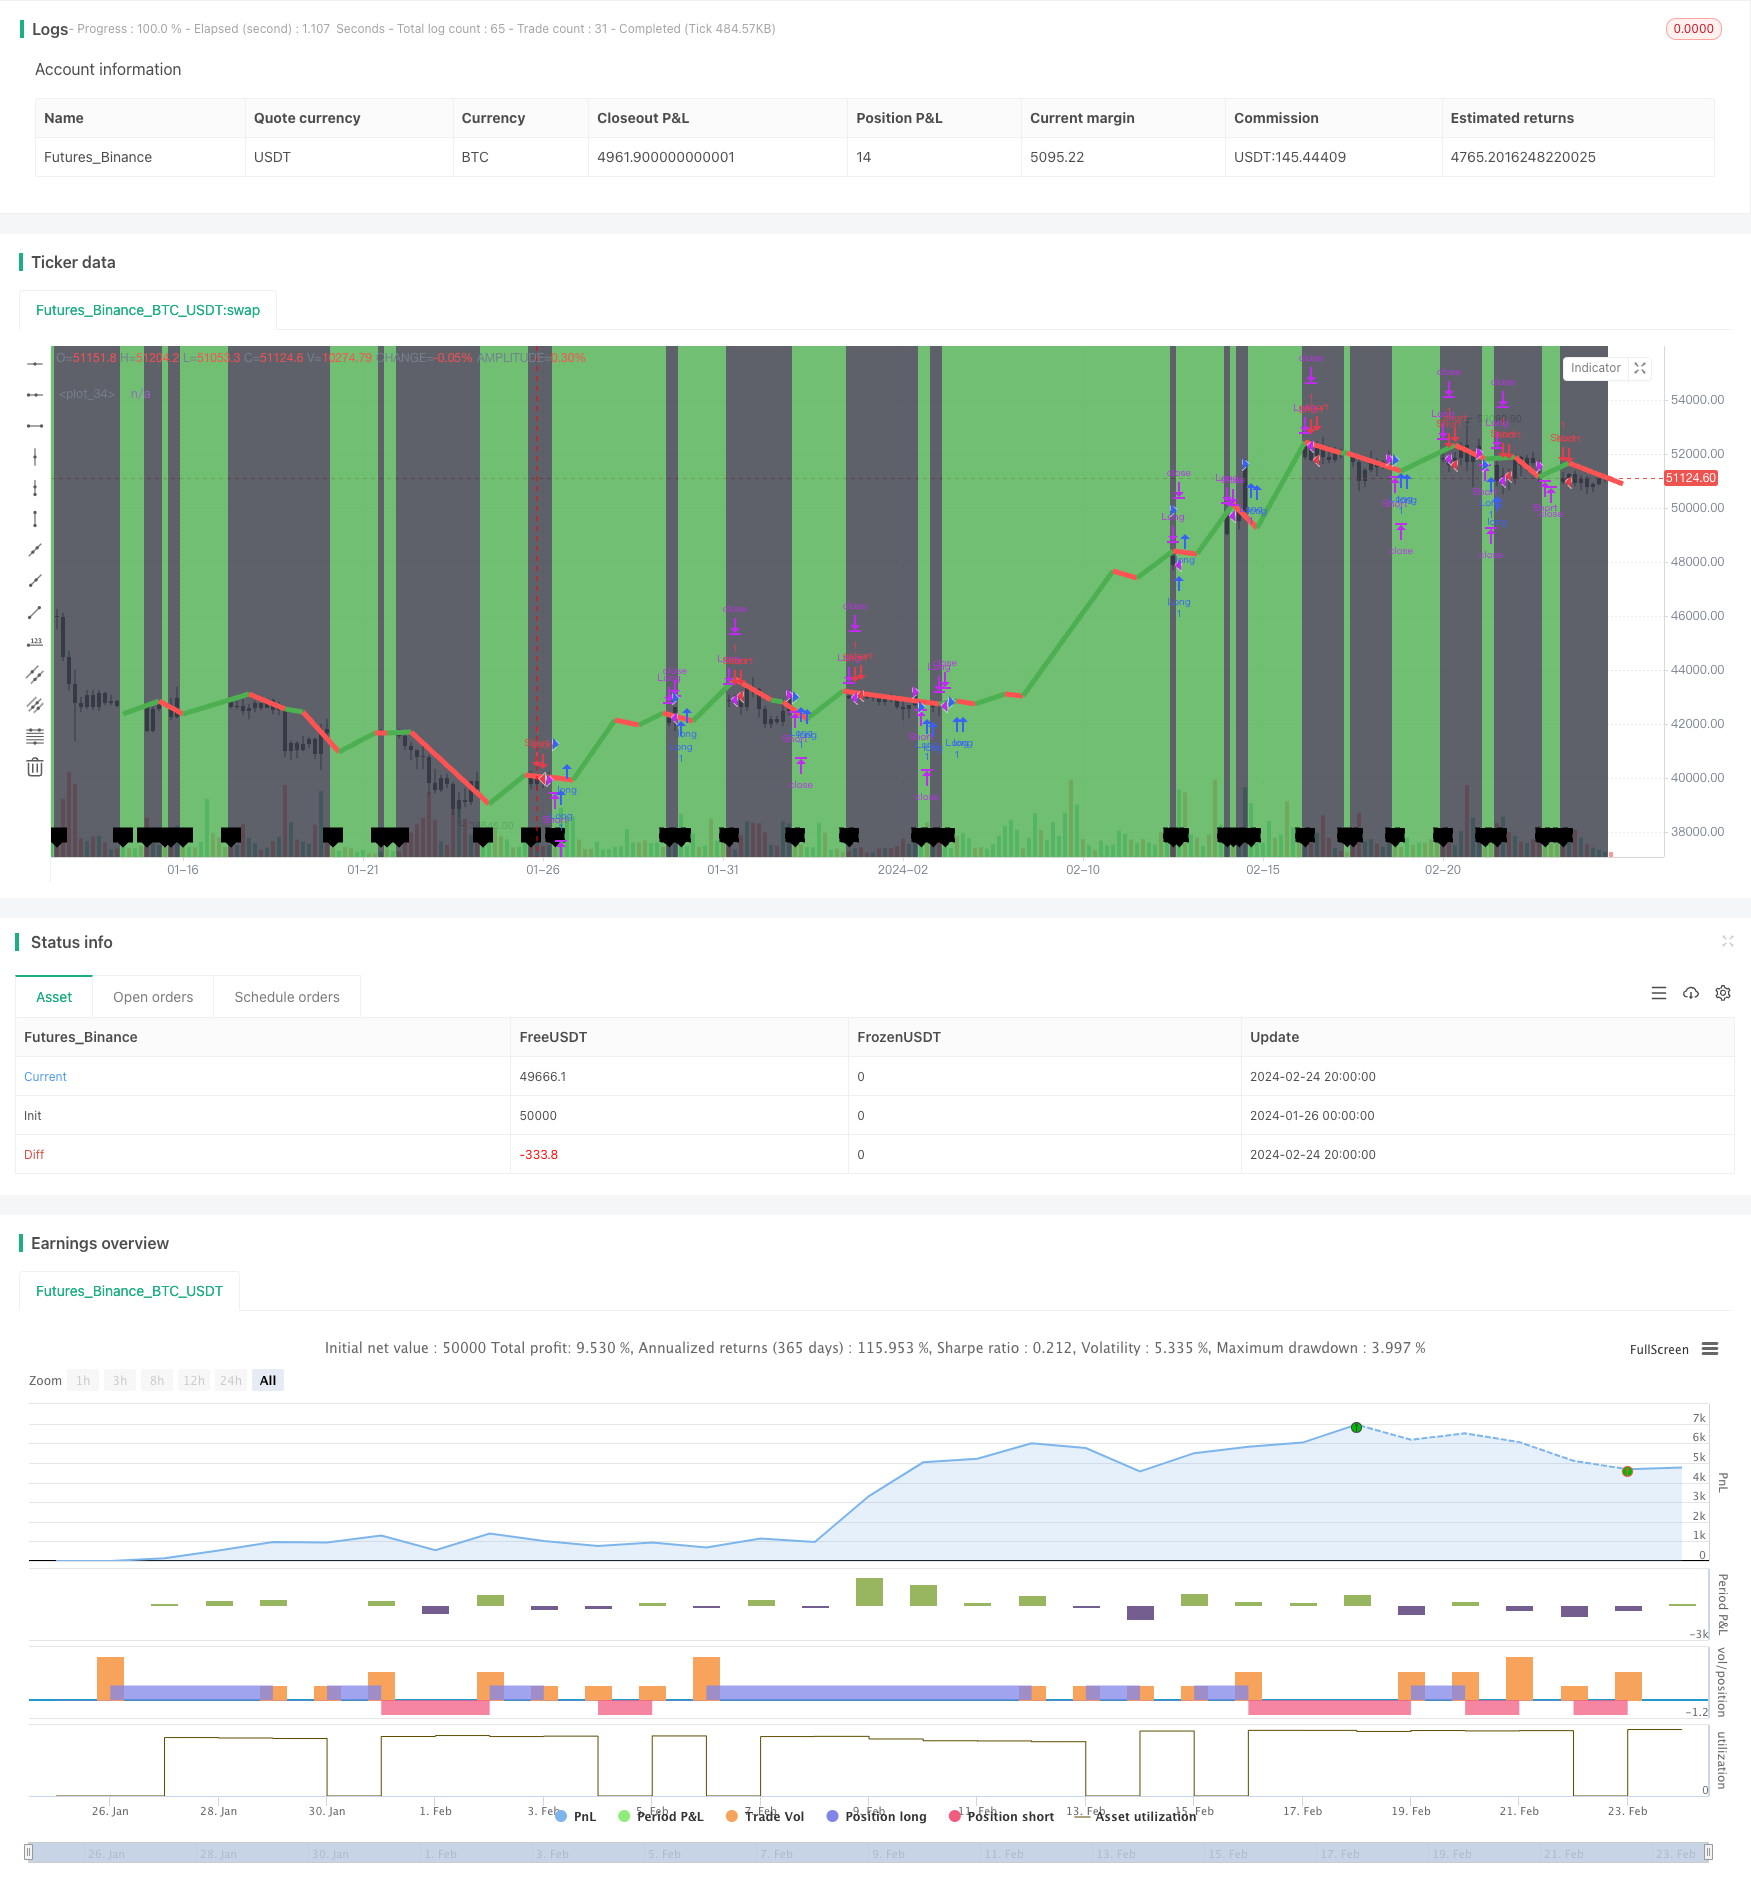
Name
动量交叉布林带趋势跟踪策略Momentum-Crossover-Bollinger-Band-Trend-Tracking-Strategy
Author
ChaoZhang
Strategy Description
该策略运用布林带指标判断市场趋势方向,并结合动量指标实现趋势跟踪交易。策略名称中“动量”代表采用动量指标,“交叉”代表判断指标交叉做多做空信号,“布林带”代表使用布林带判定趋势方向,“趋势”代表策略追踪趋势,“跟踪”代表策略可以跟踪趋势进行交易。
该策略主要分为三个部分:
-
判断布林带方向。布林带中轨代表均线,布林带上下轨代表波动范围。当价格接近上轨时为超买,接近下轨时为超卖。布林带方向代表价格趋势方向。
-
计算动量。该策略选用 Hull 动量。Hull 动量由快速移动平均线减去慢速移动平均线得出。正值代表上升趋势,负值代表下降趋势。
-
交叉信号。当快速移动平均线从下方上穿慢速移动平均线时产生做多信号;从上方下穿时产生做空信号。
交易规则为:布林带方向代表大趋势,动量指标交叉代表入场时机。当动量交叉与布林带方向一致时,产生交易信号。即追踪布林带代表的趋势方向。
-
结合趋势和动量,避免假突破。采用布林带判断大级别趋势,再利用动量指标判断具体的入场时机,避免追逐局部突破带来的formset风险。
-
风险控制更好。布林带提供止损位,比简单移动平均线更有效。
-
跟踪趋势更高效。动量指标可确保入场之后有足够力量继续推动价格朝原来的方向发展,跟踪趋势更顺畅。
-
布林带判定失败风险。布林带并不总是完全准确判定趋势,有可能错误提供方向信号从而增加损失率。
-
趋势反转风险。即使布林带正确反映大级别趋势,价格在中短期也可能出现反转,交易时需注意判断。
-
参数优化风险。策略参数如计算周期等需要针对不同市场数据进行优化,以达到最佳交易效果。
-
结合更多指标 FILTER。除布林带和 Hull 动量外,可加入MACD,KDJ等其他指标,形成指标 FILTER,提高判断准确率。
-
自适应参数优化。加入机器学习算法,根据不同品种和市场环境,实时优化参数,提高策略稳定性。
3.止损策略优化。优化止损策略,在大趋势不变前最大程度锁住利润,在趋势反转时最快止损。
该策略整合布林带判定大级别趋势和 Hull 动量指标判断具体入场时机,实现了对趋势的有效跟踪。同时也存在一定改进空间,可从加入更多指标 filter,参数自适应优化和止损策略优化等方面进行改进,以提高稳定性和利润率。
||
This strategy uses Bollinger Bands to determine the direction of market trends and combines momentum indicators to implement trend tracking transactions. The "Momentum" in the strategy name represents the adoption of momentum indicators, "Crossover" represents determining multi-doing and short-selling signals based on indicator crossovers, "Bollinger Bands" represents using Bollinger Bands to determine trend directions, "Trend" represents the strategy to track trends, and "Tracking" represents that the strategy can track trends for trading.
The strategy can be mainly divided into three parts:
-
Judge the direction of Bollinger Bands. The middle rail of Bollinger Bands represents the moving average, and the upper and lower rails represent volatility range. When the price is close to the upper rail, it is overbought. When it is close to the lower rail, it is oversold. The direction of Bollinger Bands represents the direction of the price trend.
-
Calculate momentum. This strategy uses Hull Momentum. Hull Momentum is derived from the fast moving average minus the slow moving average. A positive value represents an upward trend, and a negative value represents a downward trend.
-
Crossover signal. When the fast moving average crosses up the slow moving average from below, a long signal is generated. When it crosses down from above, a short signal is generated.
The trading rule is: The direction of Bollinger Bands represents the major trend, and the crossover of the momentum indicator represents the timing of entering the market. A trading signal is generated when the momentum crossover is consistent with the direction of the Bollinger Bands. That is to track the trend direction represented by Bollinger Bands.
-
Avoid false breakthroughs by combining trends and momentum. Adopt Bollinger Bands to judge large-scale trends, and then use momentum indicators to determine specific entry points to avoid the formset risk of chasing local breakthroughs.
-
Better risk control. Bollinger Bands provide stop-loss points, which are more effective than simple moving averages.
-
More efficient trend tracking. Momentum indicators can ensure sufficient power to continue to push prices in the original direction after entering the market, making trend tracking smoother.
-
Risk of Bollinger Bands determination failure. Bollinger Bands do not always completely accurately determine the trend, which may incorrectly provide directional signals thereby increasing the loss rate.
-
Risk of trend reversal. Even if Bollinger Bands correctly reflect the large-scale trend, prices may reverse in the medium and short term, which should be noted when trading.
-
Risk of parameter optimization. Strategy parameters such as calculation cycle need to be optimized for different market data to achieve the best trading effect.
-
Combine more indicators FILTER. In addition to Bollinger Bands and Hull Momentum, other indicators such as MACD and KDJ can be added to form an indicator FILTER to improve judgment accuracy.
-
Adaptive parameter optimization. Join machine learning algorithms to optimize parameters in real time according to different varieties and market environments to improve strategy stability.
-
Optimization of stop loss strategy. Optimize the stop loss strategy to maximize locking profits before major trends change, and stop losses fastest when trends reverse.
This strategy integrates Bollinger Bands to determine large-scale trends and Hull momentum indicators to determine specific entry points, which effectively tracks trends. At the same time, there is still room for improvement, such as adding more indicator filters, adaptive parameter optimization, stop-loss strategy optimization and so on to improve stability and profitability.
[/trans]
Strategy Arguments
| Argument | Default | Description |
|---|---|---|
| v_input_1 | 10 | HullMA cross |
| v_input_2_ohlc4 | 0 | p: ohlc4 |
Source (PineScript)
/*backtest
start: 2024-01-26 00:00:00
end: 2024-02-25 00:00:00
period: 4h
basePeriod: 15m
exchanges: [{"eid":"Futures_Binance","currency":"BTC_USDT"}]
*/

//@version=4
//                                                Hull Moving Average Crossover by SeaSide420
strategy("Hull Moving Average Crossover Strategy", overlay=true)
keh=input(title="HullMA cross",defval=10)
p=input(ohlc4)
n2ma=2*ta.wma(p,math.round(keh/2))
nma=ta.wma(p,keh)
diff=n2ma-nma
sqn=math.round(math.sqrt(keh))
n2ma1=2*ta.wma(p[1],math.round(keh/2))
nma1=ta.wma(p[1],keh)
diff1=n2ma1-nma1
sqn1=math.round(math.sqrt(keh))
n1=ta.wma(diff,sqn)
n2=ta.wma(diff1,sqn)
hullcross1 = n1
hullcross2 = n2
longcross1=(n1[0]-n1[3])+(n1[0]-n2[4])*100
longcross2=(n2[0]-n2[3])+(n2[0]-n1[4])*100
closelong = n1<n2 and longcross1<longcross2
if (closelong)
    strategy.close("Long")
closeshort = n1>n2 and longcross1>longcross2
if (closeshort)
    strategy.close("Short")
longCondition = n1>n2 and longcross1>longcross2 and strategy.opentrades<1
if (longCondition)
    strategy.entry("Long",strategy.long)
shortCondition = n1<n2 and longcross1<longcross2 and strategy.opentrades<1
if (shortCondition)
    strategy.entry("Short",strategy.short)
b=hullcross1>hullcross2?color.green:color.red
c=hullcross2>hullcross1?color.green:color.red
plot(ta.cross(hullcross1, hullcross2) ? hullcross1 : na,color=c, linewidth = 5, offset=3)
barcolor(longcross1 < longcross2 ? color.black : color.white)
bgcolor(longcross2 < longcross1 ? color.green : color.black, transp=85)
plotshape(ta.cross(longcross2, longcross1) ? longcross2 : na,   text="X", style=shape.labeldown, location=location.bottom)
Detail
https://www.fmz.com/strategy/442863
Last Modified
2024-02-26 16:52:16
