Name
动量商品选择指数策略Commodity-Momentum-Index-Strategy
Author
ChaoZhang
Strategy Description
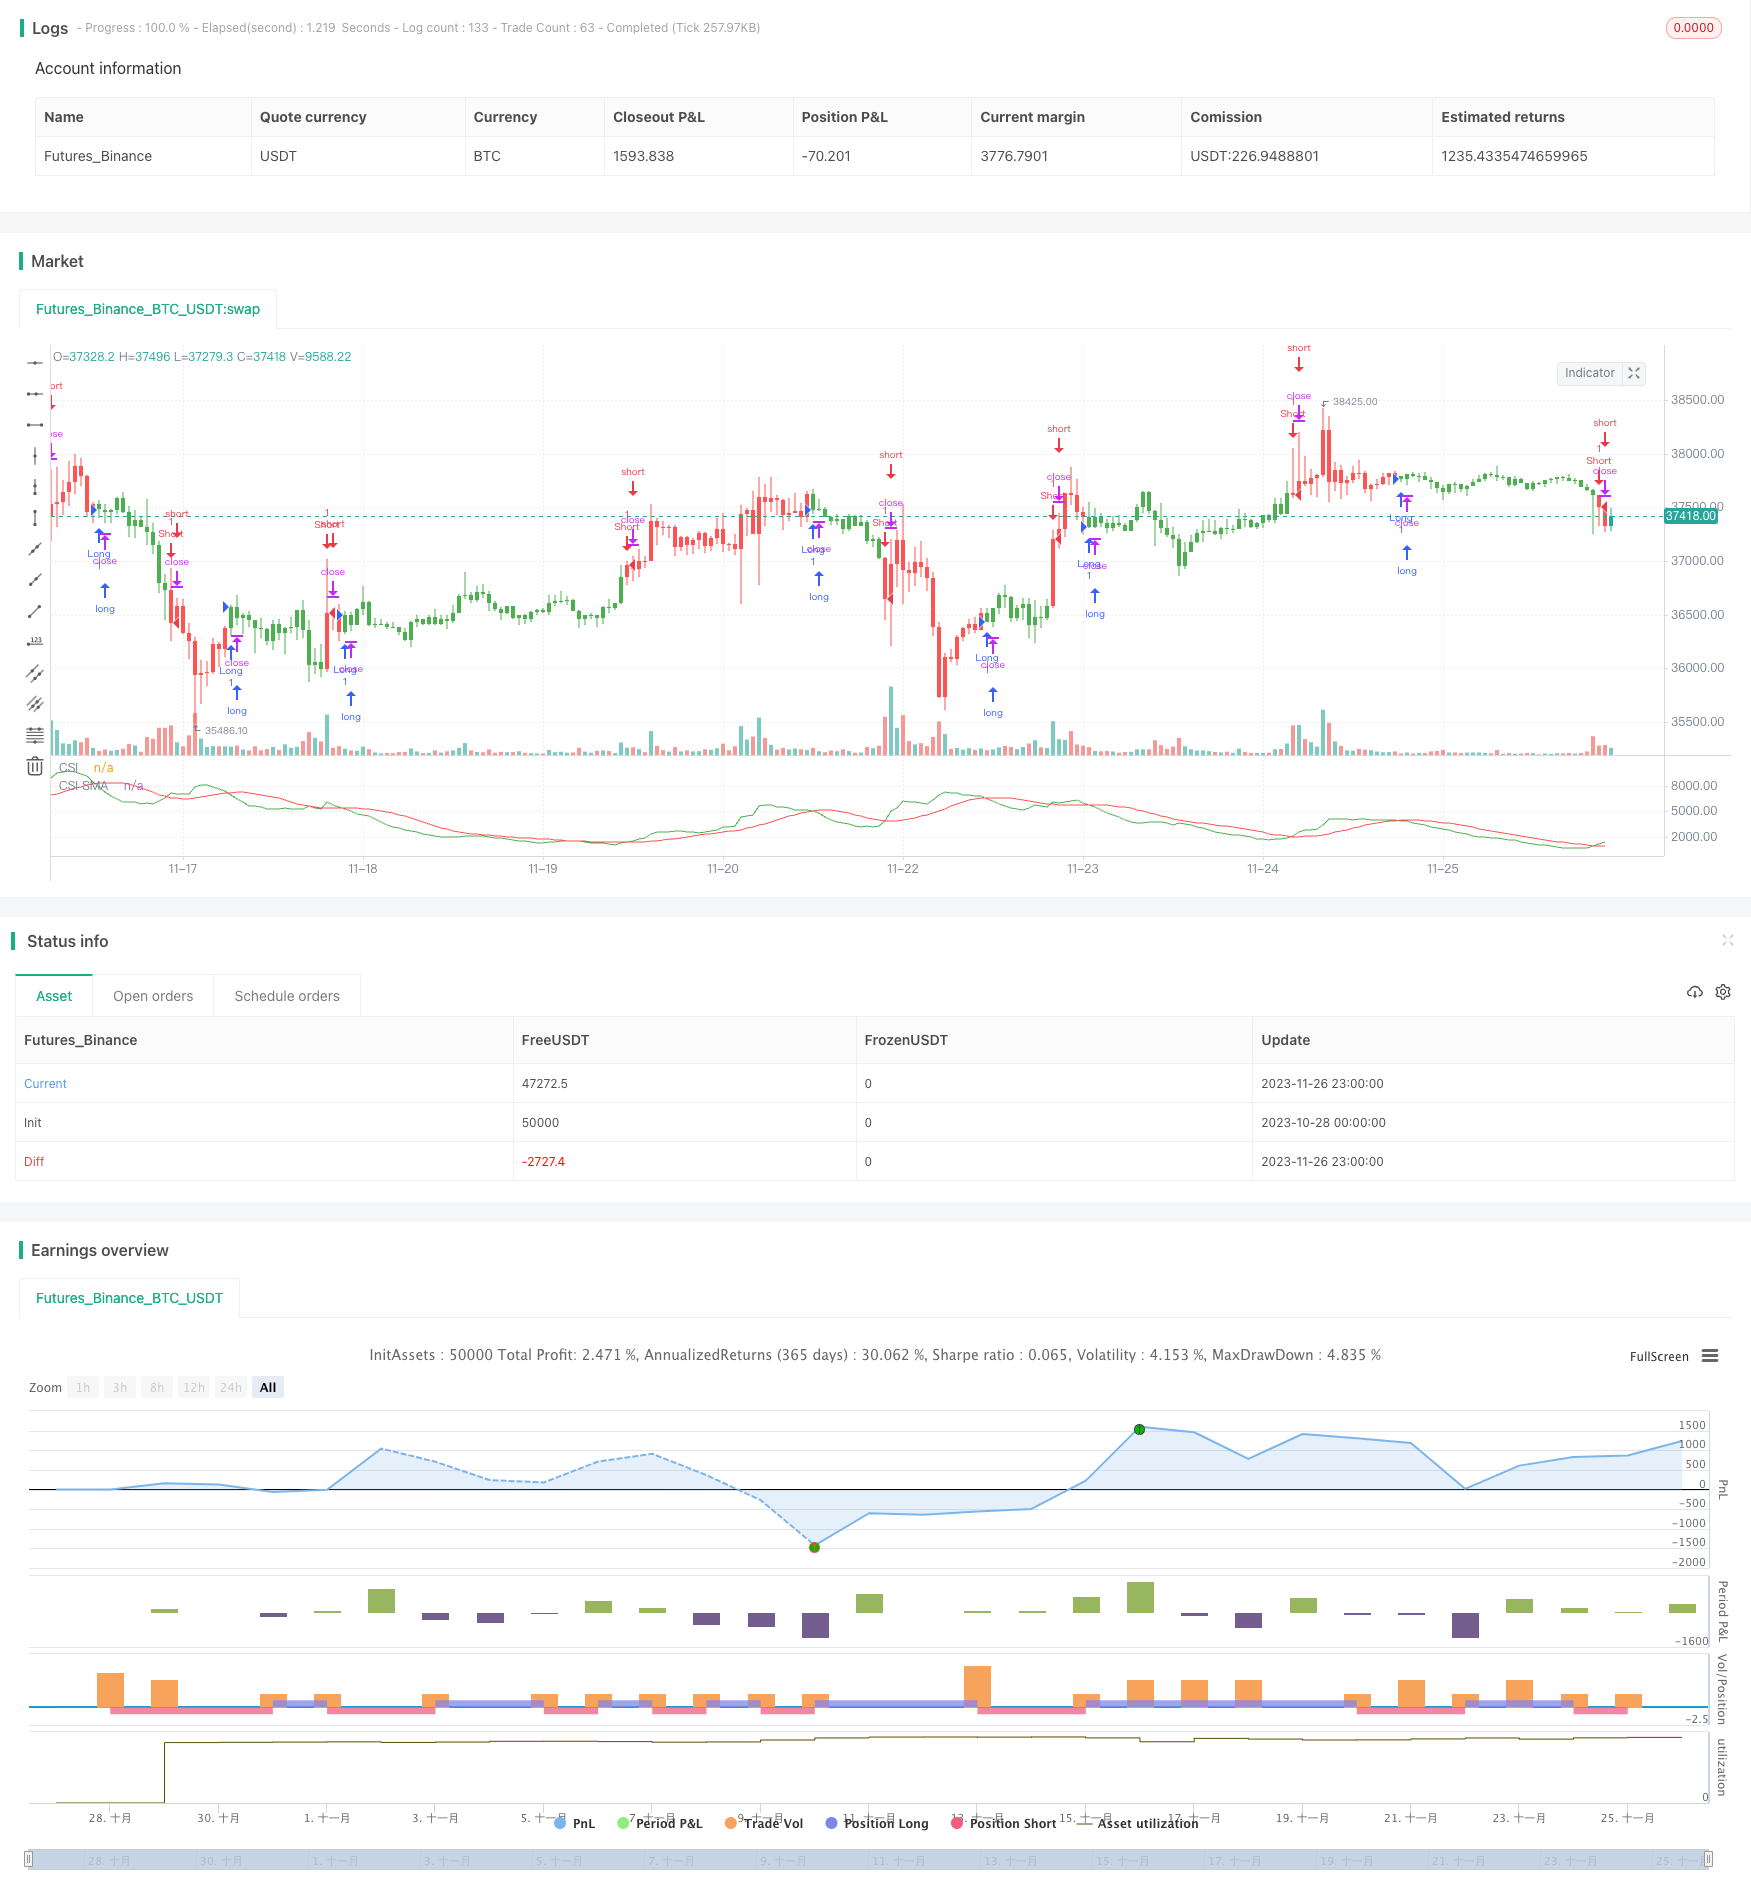
动量商品选择指数(Commodity Selection Index,CSI)策略是一种追踪市场动量的短线交易策略。它通过计算商品的趋势性和波动性,来识别出具有强劲动量的商品进行交易。该策略由威尔斯·怀尔德(Welles Wilder)在他的书《新技术分析交易系统概念》中提出。
该策略的核心指标是CSI指数,它综合考虑了商品的趋势性和波动性。具体计算方法是:
CSI = K × ATR × ((ADX + ADX的n日均线)/2)
其中,K是缩放系数,ATR代表平均真实波动幅度,它衡量市场的波动性。ADX代表平均方向指数,它反映市场的趋势性。
通过计算每个商品的CSI指数值,并与其n日简单移动均线进行比较,当CSI高于其移动均线时产生买入信号,当CSI低于其移动均线时产生卖出信号。
该策略选择CSI指数较高的商品进行交易。因为这些商品有很强的趋势性和波动性,能在短期内获得更大的盈利潜力。
该策略具有以下几个优势:
- 捕捉市场动量,能充分利用商品的趋势性和波动性特征。
- 采用双重指标,使交易信号更加可靠。
- 简单清晰的交易规则,适合自动化交易。
- 专门设计用于短线交易,能快速把握短期机会。
该策略也存在一些风险:
- 过于依赖技术指标,可能出现错误信号。
- 追踪动量的特性使其仅适合短线操作。
- 波动过大可能触发止损,给交易带来损失。
- 需要承受一定的杠杆水平,从而面临更大的资金风险。
为控制风险,应合理设定止损位置,控制单笔仓位规模,并适当调整参数以符合不同市场环境。
该策略可从以下几个方面进行优化:
- 测试更多参数组合,寻找最佳参数。
- 加入其它辅助指标进行信号过滤。
- 结合波动率反转等其他策略形成组合。
- 利用机器学习训练模型产生更可靠的交易信号。
动量商品选择指数策略通过捕捉市场中的趋势性强和波动性大的商品,实现了简单快速的短线交易。这种专门追踪动量的方法使其信号清晰,易于实施自动化。当然也需要注意控制风险,并持续改进升级以适应市场环境的变化。
||
The Commodity Selection Index (CSI) strategy is a short-term trading strategy that tracks market momentum. It identifies commodities with strong momentum by calculating the trend and volatility of commodities for trading. This strategy was proposed by Welles Wilder in his book New Concepts in Technical Trading Systems.
The core indicator of this strategy is the CSI index, which takes into account the trend and volatility of commodities. The specific calculation method is:
CSI = K × ATR × ((ADX + n-day moving average of ADX) / 2)
Where K is a scaling factor, ATR represents the Average True Range, which measures market volatility. ADX represents the Average Directional Index, which reflects the trend of the market.
By calculating the CSI index value of each commodity and comparing it with its n-day simple moving average, a buy signal is generated when the CSI is higher than its moving average, and a sell signal is generated when the CSI is lower than its moving average.
The strategy selects commodities with relatively high CSI indices for trading. Because these commodities have very strong trends and fluctuations that can generate greater profit potential in the short term.
This strategy has the following advantages:
- Capture market momentum and make full use of the trend and volatility characteristics of commodities.
- Use dual indicators to make trading signals more reliable.
- Simple and clear trading rules suitable for algorithm trading.
- Specially designed for short-term trading to quickly seize short-term opportunities.
The strategy also has some risks:
- Overly dependent on technical indicators, false signals may occur.
- The characteristic of chasing momentum makes it only suitable for short-term operations.
- Excessive fluctuations may trigger stop loss and cause losses to trading.
- Need to withstand a certain degree of leverage and thus face greater capital risk.
To control risks, stop loss positions should be reasonably set, single position size should be controlled, and parameters should be appropriately adjusted to suit different market environments.
The strategy can be optimized in the following aspects:
- Test more parameter combinations to find the optimal parameters.
- Add other auxiliary indicators for signal filtering.
- Combine with other strategies such as volatility reversal to form a portfolio.
- Use machine learning to train models to generate more reliable trading signals.
The commodity momentum index strategy realizes simple and fast short-term trading by capturing commodities with strong trends and high volatility in the market. This specialized approach of tracking momentum makes its signals clear and easy to implement algorithmically. Of course, it is also necessary to pay attention to risk control and continue to improve and upgrade to adapt to changes in market conditions.
[/trans]
Strategy Arguments
| Argument | Default | Description |
|---|---|---|
| v_input_1 | 50 | PointValue |
| v_input_2 | 3000 | Margin |
| v_input_3 | 10 | Commission |
| v_input_4 | 14 | Length |
| v_input_5 | false | Trade reverse |
Source (PineScript)
/*backtest
start: 2023-10-28 00:00:00
end: 2023-11-27 00:00:00
period: 1h
basePeriod: 15m
exchanges: [{"eid":"Futures_Binance","currency":"BTC_USDT"}]
*/

//@version=3
////////////////////////////////////////////////////////////
//  Copyright by HPotter v1.0 20/03/2019
// The Commodity Selection Index ("CSI") is a momentum indicator. It was
// developed by Welles Wilder and is presented in his book New Concepts in
// Technical Trading Systems. The name of the index reflects its primary purpose.
// That is, to help select commodities suitable for short-term trading.
// A high CSI rating indicates that the commodity has strong trending and volatility
// characteristics. The trending characteristics are brought out by the Directional
// Movement factor in the calculation--the volatility characteristic by the Average
// True Range factor.
// Wilder's approach is to trade commodities with high CSI values (relative to other
// commodities). Because these commodities are highly volatile, they have the potential
// to make the "most money in the shortest period of time." High CSI values imply
// trending characteristics which make it easier to trade the security.
// The Commodity Selection Index is designed for short-term traders who can handle
// the risks associated with highly volatile markets.
//
// WARNING:
// - For purpose educate only
// - This script to change bars colors.
////////////////////////////////////////////////////////////
fADX(Len) =>
    up = change(high)
    down = -change(low)
    trur = rma(tr, Len)
    plus = fixnan(100 * rma(up > down and up > 0 ? up : 0, Len) / trur)
    minus = fixnan(100 * rma(down > up and down > 0 ? down : 0, Len) / trur)
    sum = plus + minus
    100 * rma(abs(plus - minus) / (sum == 0 ? 1 : sum), Len)

strategy(title="Commodity Selection Index Backtest", shorttitle="CSI Backtest")
PointValue = input(50)
Margin = input(3000)
Commission = input(10)
Length = input(14)
reverse = input(false, title="Trade reverse")
K = 100 * ((PointValue / sqrt(Margin) / (150 + Commission)))
xATR = atr(Length)
xADX = fADX(Length)
nADXR = (xADX + xADX[Length]) * 0.5
xCSI = K * xATR * nADXR
xMACSI = sma(xCSI, Length)
pos = 0.0
pos := iff(xCSI < xMACSI, 1,
	   iff(xCSI > xMACSI, -1, nz(pos[1], 0)))
possig = iff(reverse and pos == 1, -1,
          iff(reverse and pos == -1, 1, pos))
if (possig == 1)
    strategy.entry("Long", strategy.long)
if (possig == -1)
    strategy.entry("Short", strategy.short)
barcolor(possig == -1 ? red: possig == 1 ? green : blue )
plot(xCSI, color=green, title="CSI")
plot(xMACSI, color=red, title="CSI SMA")
Detail
https://www.fmz.com/strategy/433579
Last Modified
2023-11-28 16:27:55
