Name
动量均线交叉EMA九股MACD策略Momentum-Line-Crossover-EMA-Nine-Stock-MACD-Strategy
Author
ChaoZhang
Strategy Description
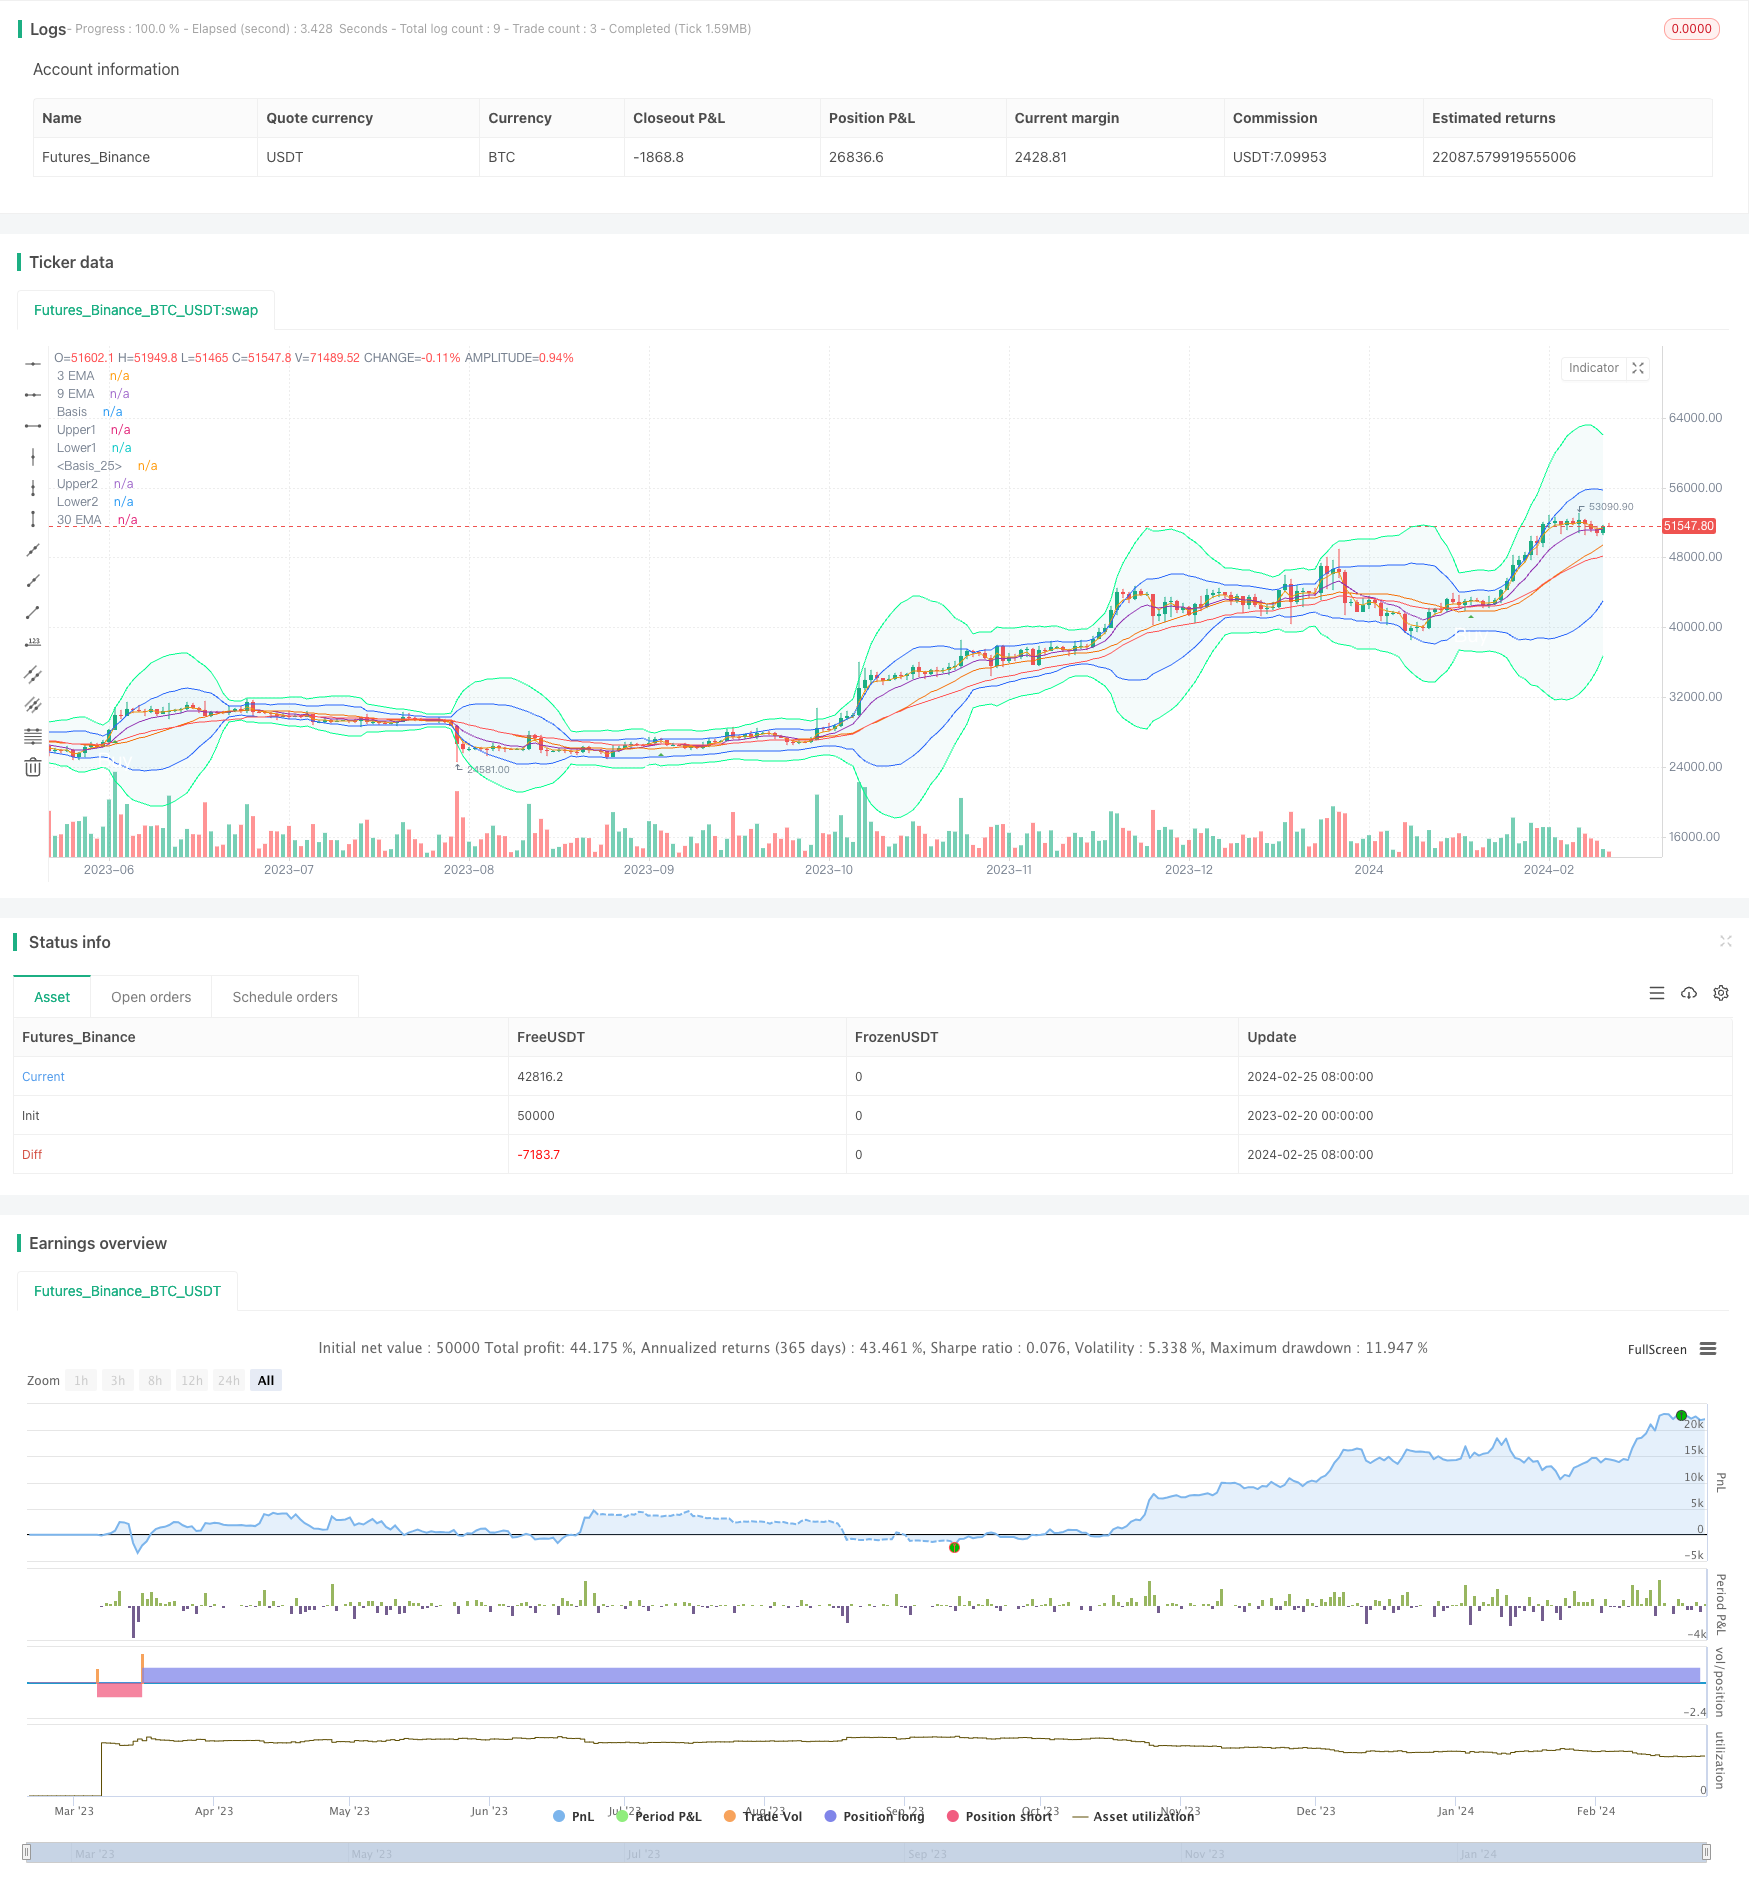
该策略综合运用EMA均线指标,Bollinger带指标和MACD指标,在实现EMA九均线和三十均线的金叉死叉的基础上,结合价格分布范围和动量指标判断买入卖出时机。
-
计算3日EMA、9日EMA和30日EMA。
-
计算20日内价格的标准差,并绘制1倍和2倍标准差范围的Bollinger带。
-
计算12日、26日MACD和9日信号线。
-
当9日EMA上穿30日EMA,并且价格超出1倍标准差Bollinger带上限时,发出买入信号。
-
当30日EMA下穿9日EMA,并且价格低于1倍标准差Bollinger带下限时,发出卖出信号。
该策略结合均线指标和动量指标,能较好地把握市场趋势和时机,具有以下优势:
-
EMA指标能快速响应价格变化,判断市场趋势;MACD指标判断力度,防止假突破。
-
Bollinger带标准差指标结合EMA,可以更精确判断买入卖出时机。
-
多种指标组合,可以互补。在一次突破中,不同指标可以验证判断。
该策略也存在一些风险,需要注意以下几点进行优化:
-
EMA均线组合可以调整和优化,不同周期可以更好捕捉趋势。
-
Bollinger带参数可以优化,变化倍数标准差以过滤假信号。
-
MACD指标参数可以优化和组合,判断力度效果可以提高。
该策略整合EMA均线指标判断大趋势,辅以Bollinger带指标可以准确在力度较大时把握买卖点;MACD指标补充趋势确认,可以有效过滤假信号。通过参数优化,该策略可以进一步提高效果。
||
This strategy comprehensively utilizes the EMA indicator, Bollinger Bands indicator and MACD indicator. On the basis of the golden cross and death cross of the 9-day EMA and 30-day EMA, it determines the timing of buying and selling in combination with the price distribution range and momentum indicators.
-
Calculate the 3-day EMA, 9-day EMA and 30-day EMA.
-
Calculate the standard deviation within 20 days of the price and draw the Bollinger Bands with 1 and 2 times the standard deviation.
-
Calculate the 12-day, 26-day MACD and 9-day signal line.
-
When the 9-day EMA goes above the 30-day EMA, and the price exceeds the upper limit of the 1x standard deviation Bollinger Bands, a buy signal is issued.
-
When the 30-day EMA goes below the 9-day EMA, and the price is lower than the lower limit of the 1x standard deviation Bollinger Bands, a sell signal is issued.
By combining moving average indicators and momentum indicators, this strategy can better grasp market trends and timing, with the following advantages:
-
The EMA indicator can respond quickly to price changes to determine market trends; the MACD indicator judges momentum to prevent false breakouts.
-
The combination of Bollinger Bands standard deviation indicators and EMAs can more accurately determine the timing of buying and selling.
-
The combination of multiple indicators can complement each other. Different indicators can verify the judgment in one breakthrough.
This strategy also has some risks. Pay attention to the following points for optimization:
-
The combination of EMA moving averages can be adjusted and optimized. Different cycles can better capture trends.
-
The parameters of Bollinger Bands can be optimized by changing the multiplication of standard deviations to filter out false signals.
-
The parameters and combination of the MACD indicator can be optimized to improve the effect of judging momentum.
This strategy integrates the EMA indicator to determine the major trend, supplemented by the Bollinger Bands indicator which can accurately seize buy and sell points when momentum is relatively large; the MACD indicator supplements trend confirmation and can effectively filter out false signals. Through parameter optimization, the effect of this strategy can be further improved.
[/trans]
Strategy Arguments
| Argument | Default | Description |
|---|---|---|
| v_input_1 | 3 | 3 EMA |
| v_input_2 | 9 | 9 EMA |
| v_input_3 | 30 | 30 EMA |
| v_input_4 | 12 | MACD Short |
| v_input_5 | 26 | MACD Long |
| v_input_6 | 9 | MACD Signal |
| v_input_int_1 | 20 | length |
| v_input_7_close | 0 | Source: close |
| v_input_float_1 | 2 | StdDev |
Source (PineScript)
/*backtest
start: 2023-02-20 00:00:00
end: 2024-02-26 00:00:00
period: 1d
basePeriod: 1h
exchanges: [{"eid":"Futures_Binance","currency":"BTC_USDT"}]
*/

//@version=5
strategy("emabb_collab", shorttitle="emabb", overlay=true)

// Input parameters
ema3 = input(3, title="3 EMA")
ema9 = input(9, title="9 EMA")
ema30 = input(30, title="30 EMA")
macdShort = input(12, title="MACD Short")
macdLong = input(26, title="MACD Long")
macdSignal = input(9, title="MACD Signal")
length = input.int(20, minval=1)
src = input(close, title="Source")
mult = input.float(2.0, minval=0.001, maxval=50, title="StdDev")
basis = ta.sma(src, length)
dev1 = mult * ta.stdev(src, length)
upper1 = basis + dev1
lower1 = basis - dev1
dev2 = mult * 2 * ta.stdev(src, length)
upper2 = basis + dev2
lower2 = basis - dev2
plot(basis, "Basis", color=#FF6D00)
p1 = plot(upper1, "Upper1", color=#2962FF)
p2 = plot(lower1, "Lower1", color=#2962FF)
fill(p1, p2, title = "Background", color=color.rgb(33, 150, 243, 95))
plot(basis, "Basis", color=#FF6D00)
p3 = plot(upper2, "Upper2", color=#00FF8C)
p4 = plot(lower2, "Lower2", color=#00FF8C)
fill(p3, p4, title = "Background", color=color.rgb(0, 153, 140, 95))

// Calculate EMAs
ema3Value = ta.ema(close, ema3)
ema9Value = ta.ema(close, ema9)
ema30Value = ta.ema(close, ema30)


// Calculate MACD
[macdLine, signalLine, _] = ta.macd(close, macdShort, macdLong, macdSignal)


// Conditions for buy signal
buyCondition = ta.crossover(ema9Value, ema30Value)  and ta.stdev(close, 20) > ta.stdev(close, 20)[1]

//Conditions for sell signal
sellCondition = ta.crossover(ema30Value, ema9Value)  and ta.stdev(close, 20) < ta.stdev(close, 20)[1]

// Plot signals on the chart

plotshape(buyCondition, title='Buy Label', style=shape.triangleup, location=location.belowbar, size=size.normal, text='Buy', textcolor=color.new(color.white, 0), color=color.new(color.green, 0))
plotshape(sellCondition, title='sell Label', style=shape.triangledown, location=location.abovebar, size=size.normal, text='sell', textcolor=color.new(color.white, 0), color=color.new(color.red, 0))

// Plot EMAs
plot(ema3Value, title="3 EMA", color=color.orange)
plot(ema9Value, title="9 EMA", color=color.purple)
plot(ema30Value, title="30 EMA", color=color.red)


if buyCondition
    strategy.entry('Long', strategy.long)
if sellCondition
    strategy.entry('Short', strategy.short)
Detail
https://www.fmz.com/strategy/442967
Last Modified
2024-02-27 16:49:10
