Name
动量孔隙交易策略Momentum-Gap-Trading-Strategy
Author
ChaoZhang
Strategy Description
[trans]
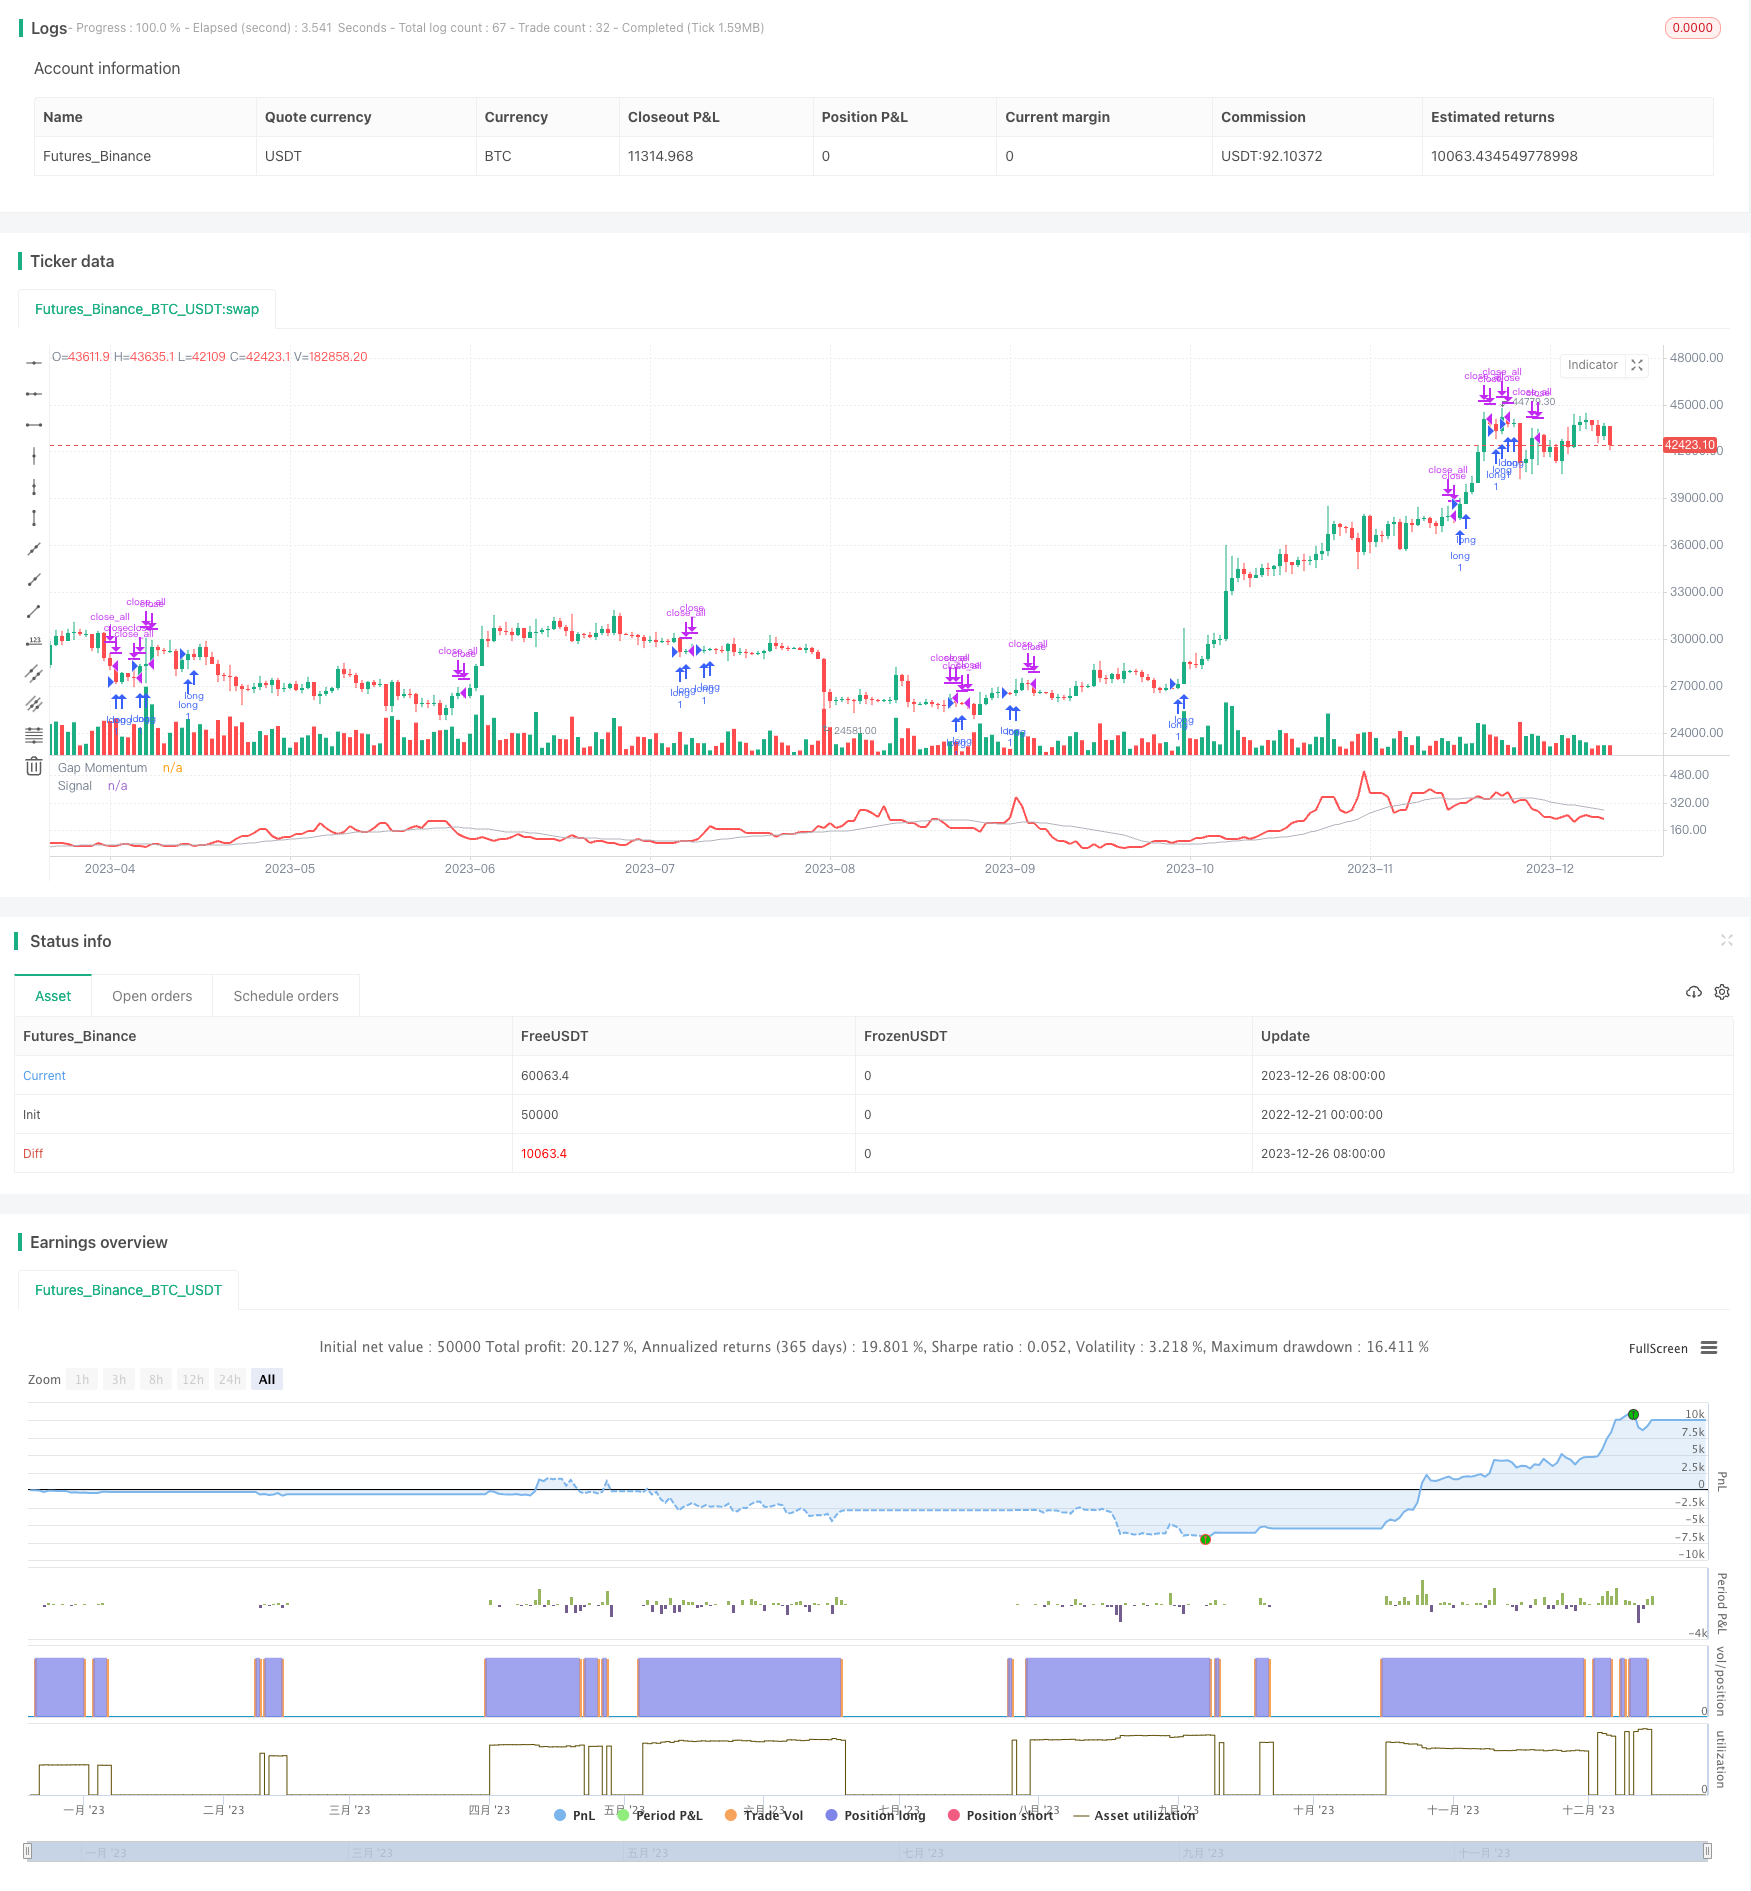
动量孔隙交易策略(Momentum Gap Trading Strategy)是一种追踪价格波动的量化交易策略。它利用开盘价与前一天收盘价之间的差距(称为孔隙)来构建一个动量指标,并以该指标生成交易信号。该策略适用于高波动性股票,可捕捉价格跳空后的继续运行。
本策略基于波音公司前量化分析师佩里·考夫曼(Perry J. Kaufman)在2024年1月《技术分析杂志》上发表的文章《孔隙动量指标》。考夫曼构建了一个跟踪孔隙的动量时间序列,并提出使用该时间序列的移动平均线作为交易信号。当动量指标上穿其移动平均线时做多,下穿其移动平均线时平仓。
动量孔隙策略的关键在于构建孔隙动量时间序列。构建思路类似于量化术语“弹性量”(On-Balance Volume,OBV),只不过使用的价格输入由每日收盘价变为每日孔隙。
具体计算流程是:
- 计算最近N天正孔隙总和与负孔隙绝对值之比
- 将比率累加构成孔隙动量序列
- 对孔隙动量序列应用移动平均生成信号
正孔隙定义为开盘价高于前一日收盘价的差值,负孔隙则相反。比率在本质上反映了最近一段时间内正孔隙与负孔隙的强度对比。
移动平均线抚平了原始波动序列,可用来发出交易信号。本策略采用了一个慢速移动平均线,当快速孔隙动量指标上穿慢速移动平均线时做多,下穿时平仓。
与传统技术指标相比,动量孔隙策略具有以下优势:
-
利用价格跳空捕捉市场失衡
价格跳空(Gap)代表了巨大的供需失衡,跳空方向代表了市场议价权转移。本策略通过空隙比较市场多空力量,可有效捕捉这种失衡。
-
具有持续性
价格跳空后往往伴随趋势的继续,追踪跳空动量可捕捉价格趋势波段。指标设计增强了这种持续性特征。
-
参数少,实施简单
整个指标只包含两个参数,一个追踪动量的窗口期和一个信号平滑期。非常易于实施。
-
可量化,适合自动交易
采用数值比较清晰的交易规则,标准化程度高,可直接连接自动交易系统,适合程序化交易。
尽管有许多优点,动量孔隙策略也存在一些风险:
-
容易产生错误信号
价格跳空短期内可能出现回补,进而使指标产生错误信号。may generate false signals as gaps may fill shortly after opening.
-
无法有效处理震荡行情
当价格出现频繁震荡时,指标将会发出大量互相抵消的交易信号。
-
潜在的过优化问题
仅仅两个参数很容易导致在历史数据上过度优化。must be careful not to overfit.
建议通过以下方式来控制风险:
-
采用止损来限制单笔损失
-
增加参数以适应更多市场状态
-
多组合优化以防范过优化
本策略可从以下几个维度进行扩展与优化:
-
多个时间周期组合
采用不同追踪动量窗口的多个孔隙指标,不同周期间可起到互补效果。
-
整合跳空指标
例如将真实间隙指标与ATR指标整合作为风险管理。manage risk with ATR.
-
考虑跳空各方面
例如跳空距离、跳空次数、跳空产生日等更多特征。incorporate more gap characteristics.
-
机器学习模型
使用跳空数据训练更复杂的机器学习模型,may achieve better performance.
动量孔隙策略是一个简单但实用的突破类策略。它跟踪价格跳空这一市场微观结构变化,挖掘隐藏在其中的剧烈供需变化。与其他技术指标相比,它能更清楚地反映市场失衡,并迅速抓住价格趋势转折点。尽管如此,仍需要辅以风险控制手段以避免潜在问题。本策略为我们提供了一个基于市场结构识别机会的范例,值得我们在实践中做进一步优化与创新。
||
The Momentum Gap Trading Strategy is a quantitative trading strategy that tracks price fluctuations. It utilizes the gap between the opening price and the previous day's closing price (called the gap) to construct a momentum indicator and generates trading signals with it. The strategy is suitable for high volatility stocks and can capture price continuations after gap openings.
This strategy is based on an article titled "Gap Momentum Indicator" published by Perry J. Kaufman, former quantitative analyst at Boeing, in the January 2024 issue of Technical Analysis magazine. Kaufman constructed a momentum time series tracking gaps and proposed using the moving average of that time series as trading signals. A long position is opened when the momentum indicator crosses above its moving average, and flattened when it crosses below.
The key to the Momentum Gap strategy lies in constructing the gap momentum time series. The construction logic is similar to the quantitative term "On-Balance Volume (OBV)", except that the price input is changed from the daily close to the daily gap.
The specific calculation process is:
-
Calculate the ratio of the sum of positive gaps over the past N days to the sum of negative gaps (absolute values) over the same period.
-
Add the resulting ratio to the cumulative time series called Gap Momentum.
-
Apply a moving average to the Gap Momentum sequence to generate signals.
A positive gap is defined as the difference when the opening price is higher than the previous day's closing price, and negative gap vice versa. The ratio essentially reflects the recent strength contrast between positive and negative gaps.
The moving average smoothes the original volatile sequence and can be used to issue trading signals. This strategy employs a slower moving average, establishing long positions when the fast Gap Momentum indicator crosses above it and flattening positions when crossing below it.
Compared with traditional technical indicators, the Momentum Gap Trading Strategy has the following strengths:
-
Captures market imbalances with price gaps
Gaps represent huge supply and demand imbalances. Tracking gaps compares market strength and effectively captures such imbalances.
-
Persistence
Price gaps are often followed by trend continuations. Tracking gap momentum captures price swings. The indicator design enhances this persistence.
-
Simple to implement
The whole indicator only contains two parameters, a window for tracking momentum and a period for smoothing signals. Extremely easy to implement.
-
Quantifiable rules suitable for automation
Adopting quantifiable trading rules with high standardization, it can be directly connected to auto-trading systems for algorithmic trading.
Despite many strengths, the Momentum Gap Trading Strategy also carries some risks:
-
Prone to false signals
Gaps may fill shortly after opening, causing the indicator to generate incorrect signals.
-
Ineffective in choppy markets
Frequent price whipsaws can lead to excessive offsetting signals.
-
Potential overfitting
Very easy to overfit with just two parameters.
It is advisable to manage risks by:
-
Adopting stops to limit losses
-
Increasing parameters to adapt more market states
-
Ensemble optimization to avoid overfitting
This strategy can be expanded and enhanced in the following dimensions:
-
Combining multiple time frames
Adopting Gap Momentum indicators tracking different momentum windows can achieve complementary effects across time frames.
-
Incorporating gap metrics
For instance, combining true gap size with ATR as risk management.
-
Considering more gap characteristics
Such as gap distance, frequency, opening days etc.
-
Machine learning models
Training more complex ML models on gap data may achieve better performance.
The Momentum Gap Trading Strategy is a simple yet practical breakout strategy. By tracking price gaps, an important market microstructure change, it uncovers the drastic supply and demand shifts hidden behind. Compared to other technical indicators, it reflects market imbalances more clearly and swiftly seizes price trend turning points. That said, risk controls are still necessary to address potential issues. This strategy exemplifies how identifying opportunities based on market structure can lead to effective techniques that can be further optimized and innovated in practice.
[/trans]
Strategy Arguments
| Argument | Default | Description |
|---|---|---|
| v_input_int_1 | 40 | Period: |
| v_input_int_2 | 20 | Signal Period: |
| v_input_bool_1 | true | Long Only: |
Source (PineScript)
/*backtest
start: 2022-12-21 00:00:00
end: 2023-12-27 00:00:00
period: 1d
basePeriod: 1h
exchanges: [{"eid":"Futures_Binance","currency":"BTC_USDT"}]
*/

//  TASC Issue: January 2024 - Vol. 42, Issue 1
//     Article: Gap Momentum Indicator
//              Taking A Page From The On-Balance Volume
//  Article By: Perry J. Kaufman
//    Language: TradingView's Pine Script™ v5
// Provided By: PineCoders, for tradingview.com


//@version=5
string title  = 'TASC 2024.01 Gap Momentum System'
string stitle = 'GMS'
strategy(title, stitle, false)


int period       = input.int( 40,   'Period:')
int signalPeriod = input.int( 20,   'Signal Period:')
bool longOnly    = input.bool(true, 'Long Only:')


float gap   = open - close[1]
float gapUp = 0.0
float gapDn = 0.0
switch
    gap > 0 => gapUp += gap
    gap < 0 => gapDn -= gap


float gapsUp   = math.sum(gapUp, period)
float gapsDn   = math.sum(gapDn, period)
float gapRatio = gapsDn == 0?1.0:100.0*gapsUp/gapsDn
float signal   = ta.sma(gapRatio, signalPeriod)


if strategy.opentrades <= 0 and signal > signal[1]
    // buy at next open:
    strategy.entry('long', strategy.long)
else if strategy.opentrades > 0 and signal < signal[1]
    if longOnly
        // close all at next open:
        strategy.close_all()
    else
        // sell at next open:
        strategy.entry('short', strategy.short)


plot(gapRatio, 'Gap Momentum', color.red,    2)
plot(signal,   'Signal',       color.silver, 1)
Detail
https://www.fmz.com/strategy/436872
Last Modified
2023-12-28 14:38:33
