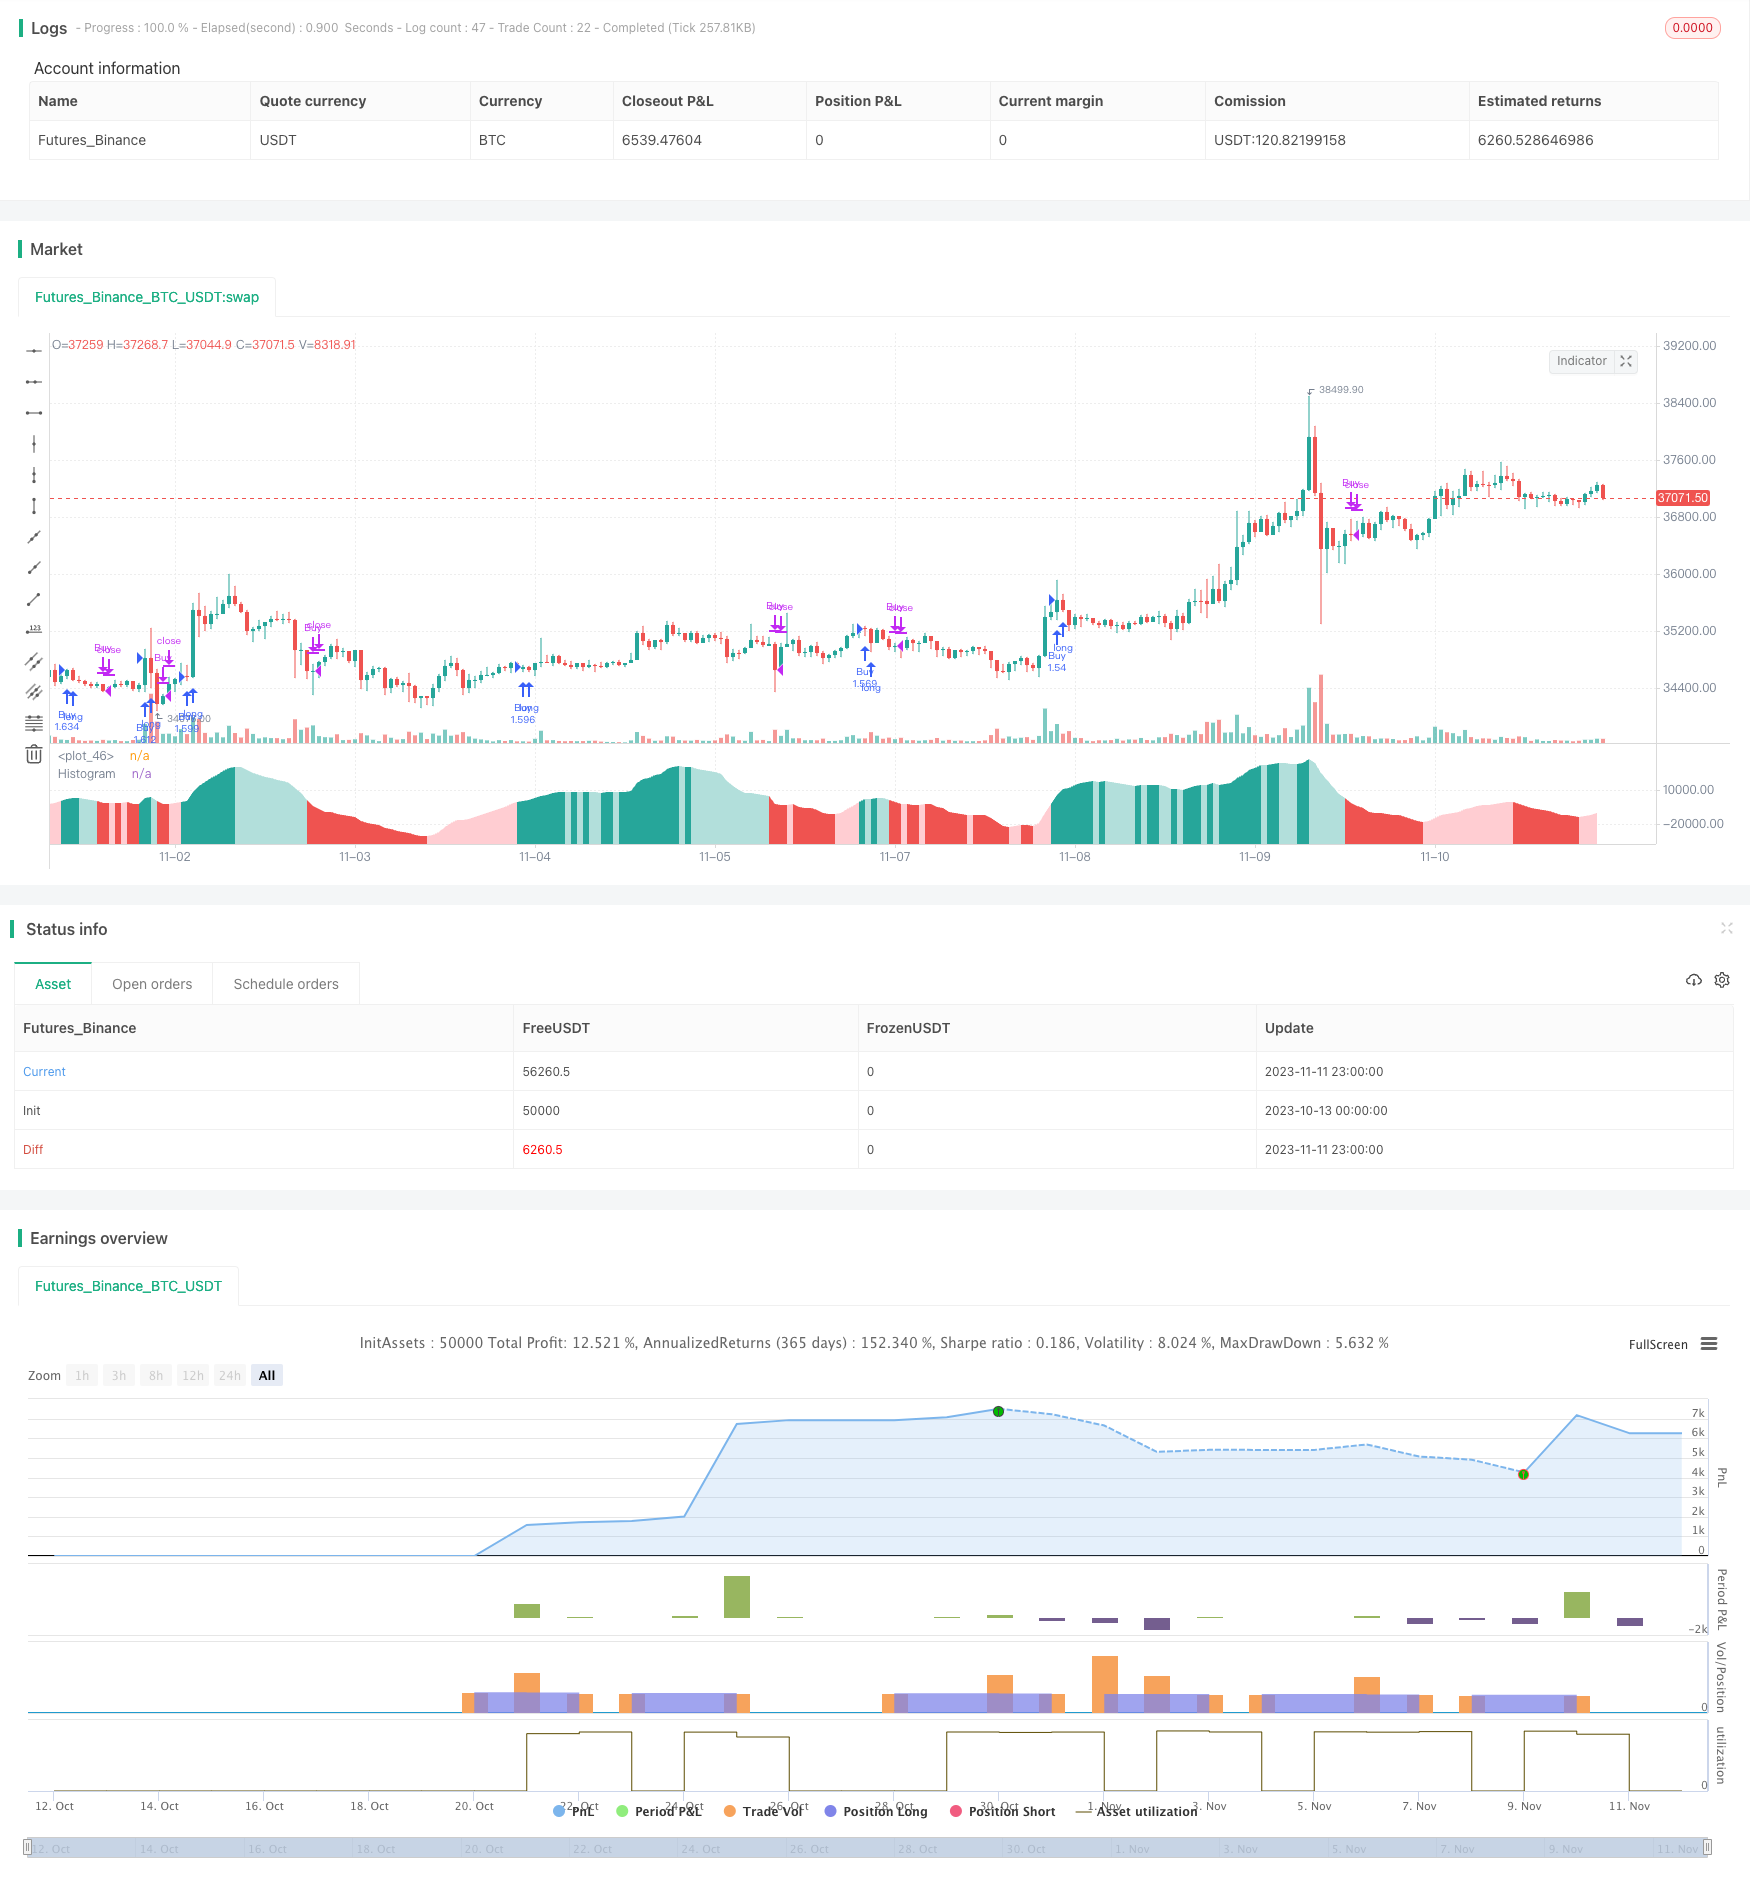
Name
动量市场情绪指标策略Momentum-Market-Sentiment-Indicator-Strategy
Author
ChaoZhang
Strategy Description
本策略通过比较价格变动和交易量,揭示市场参与者的情绪,以MACD的形式呈现并发出交易信号。
该策略主要通过以下几种计算方法揭示市场情绪:
-
每根K线的价格变动除以交易量。这可以直接看出买卖力量的强弱。
-
对价格变动和交易量分别应用指数平滑移动平均线,再将价格变动的EMA除以交易量的EMA。这样可以过滤掉部分噪音,得到较为平滑的“市场情绪”曲线。
-
在“市场情绪”上再计算快慢EMA,得到类似MACD的曲线。其中MACD线显示动量方向和强度,信号线是其移动平均,柱状图显示两条曲线的差值,代表动量变化。
当柱状图上穿0时为多头市场情绪增强的信号,下穿0时为空头市场情绪增强的信号。也可以观察柱状图的背离现象。
本策略具有以下优势:
-
利用成交量信息判断市场参与者情绪,更有说服力。
-
MACD形式直观,使用简便。
-
参数可调,适用于不同品种和周期。
-
可检测柱状图背离,发现潜在趋势转折点。
-
代码结构清晰,容易理解和优化。
本策略也存在以下风险:
-
成交量能反映市场情绪,但不能保证交易信号正确。需结合价格行情判断。
-
MACD参数设置不当可能导致错失信号或产生假信号。需针对品种和周期优化参数。
-
背离信号可能是假信号,无法确定趋势转折,需谨慎看待。
-
存在晚期入场被套的风险。可适当等待追踪止损,或与趋势和相关品种合理验证。
本策略可从以下方面进行优化:
-
testing不同品种和周期的参数组合,寻找最优参数。
-
加入止损策略,降低亏损风险。
-
与相关品种价格趋势进行组合,验证交易信号。
-
利用机器学习方法动态优化参数。
-
增加过滤条件,减少假信号。例如大级别趋势、波动率等。
本策略利用价格变动与交易量比值判断市场情绪,以MACD形式产生交易信号。相比仅看价格信息,考量交易量能更准确判断多空力量对比和市场热度。可根据不同品种和周期优化参数,且有进一步优化空间。总体来说,本策略思路新颖,使用简便,有效把握市场热点,值得进一步开发。
||
This strategy reveals market sentiment by comparing price changes to volume, and presents it in a MACD format to generate trading signals.
The strategy mainly uses the following methods to reveal market sentiment:
-
Price change per volume of each bar. This directly shows the strength of buying and selling forces.
-
Apply exponential moving averages to price change and volume separately, then divide the EMA of price change by the EMA of volume. This filters out some noise and results in a smoother "market sentiment" curve.
-
Apply fast and slow EMAs on "market sentiment" to get MACD-like lines. The MACD line shows momentum direction and strength, the signal line is its moving average, and the histogram shows their difference, representing momentum change.
The histogram crossing above 0 signals increasing bullish sentiment, while crossing below 0 signals increasing bearish sentiment. Divergences on the histogram can also be observed.
The strategy has the following advantages:
-
Uses volume information to judge market sentiment, more convincing.
-
MACD form is intuitive and easy to use.
-
Customizable parameters for different products and timeframes.
-
Can detect divergences on histogram to find potential trend reversals.
-
Clear code structure, easy to understand and optimize.
The strategy also has the following risks:
-
Volume reflects sentiment but does not guarantee correct signals. Need to combine with price action.
-
Improper MACD parameter setting may cause missed or false signals. Parameters need to be optimized for specific products and timeframes.
-
Divergences may be false signals, unable to confirm trend reversals, so need to be interpreted carefully.
-
Risk of late entry and being trapped. Can wait for trailing stop loss or validate with trends and related products.
The strategy can be optimized in the following aspects:
-
Test combinations of parameters on different products and timeframes to find optimal parameters.
-
Add stop loss to reduce loss risk.
-
Combine with related product price trends to validate signals.
-
Use machine learning to dynamically optimize parameters.
-
Add filters to reduce false signals, e.g. higher timeframe trends, volatility, etc.
The strategy judges market sentiment by comparing price change and volume, and generates signals in a MACD format. Considering volume in addition to just price can more accurately determine the strength of buyers and sellers. The parameters can be optimized for different products and timeframes, with further optimization potential. Overall, the strategy has a novel idea, easy to use, effectively captures market momentum, and is worth further development.
[/trans]
Strategy Arguments
| Argument | Default | Description |
|---|---|---|
| v_input_1 | 49 | Market Sentiment Lookback Length |
| v_input_2 | 40 | Fast EMA Length |
| v_input_3 | 204 | Slow EMA Length |
| v_input_4 | 20 | Signal Length |
| v_input_5 | false | Show Market Sentiment? |
| v_input_6 | true | Show Momentum? |
| v_input_7 | false | Show MACD Line? |
| v_input_8 | false | Show Signal Line? |
| v_input_9 | false | (Show Change/Volume for Each Bar?) |
| v_input_10 | false | (Show Fast EMA?) |
| v_input_11 | false | (Show Slow EMA?) |
Source (PineScript)
/*backtest
start: 2023-10-13 00:00:00
end: 2023-11-12 00:00:00
period: 1h
basePeriod: 15m
exchanges: [{"eid":"Futures_Binance","currency":"BTC_USDT"}]
*/

// This source code is subject to the terms of the Mozilla Public License 2.0 at https://mozilla.org/MPL/2.0/
// © dannylimardi

//@version=4
strategy("Sentiment Oscillator", "Sentiment", overlay=false, initial_capital=100, default_qty_type=strategy.percent_of_equity, default_qty_value=100, commission_type=strategy.commission.percent, commission_value=0.08)


//Inputs
msLen = input(49, type=input.integer, title="Market Sentiment Lookback Length")
emaLen1 = input(40, type=input.integer, title="Fast EMA Length")
emaLen2 = input(204, type=input.integer, title="Slow EMA Length")
signalLen = input(20, type=input.integer, title="Signal Length")
showMs = input(false, type=input.bool, title="Show Market Sentiment?")
showHist = input(true, type=input.bool, title="Show Momentum?")
showMacd = input(false, type=input.bool, title="Show MACD Line?")
showSignal = input(false, type=input.bool, title="Show Signal Line?")
showCpv = input(false, type=input.bool, title="(Show Change/Volume for Each Bar?)")
showEma1 = input(false, type=input.bool, title="(Show Fast EMA?)")
showEma2 = input(false, type=input.bool, title="(Show Slow EMA?)")

//Calculations
priceChange = close - close[1]
changePerVolume = (priceChange/volume) * 10000000  // (The 1000000 doesn't have any significance, it's just to avoid color-change errors when the values are too emall.)
priceChangeEma = ema(priceChange, msLen)
volumeEma = ema(volume, msLen)
marketSentiment = priceChangeEma/volumeEma * 100000000
msEma1 = ema(marketSentiment, emaLen1)
msEma2 = ema(marketSentiment, emaLen2)
macd = msEma1-msEma2
signal = ema(macd, signalLen)
hist = macd-signal

//Plot colors
col_grow_above = #26A69A
col_grow_below = #FFCDD2
col_fall_above = #B2DFDB
col_fall_below = #EF5350
col_macd = #0094ff
col_signal = #ff6a00

//Drawings
plot(showHist ? hist : na, title="Histogram", style=plot.style_area, color=(hist>=0 ? (hist[1] < hist ? col_grow_above : col_fall_above) : (hist[1] < hist ? col_grow_below : col_fall_below)), transp=0 )
plot(showMacd ? macd : na, title="MACD", color=col_macd, transp=0)
plot(showSignal ? signal : na, title="Signal", color=col_signal, transp=0)
plot(showCpv ? changePerVolume : na, color=changePerVolume > changePerVolume[1] ? color.teal : color.red)
plot(0, color=color.white, transp=80)
plot(showEma1 ? msEma1 : na, color=color.aqua)
plot(showEma2 ? msEma2 : na, color=color.yellow)
plot(showMs ? marketSentiment : na, color=color.lime)

//Strategy
strategy.entry("Buy", strategy.long, when=crossover(hist, 0))
strategy.close("Buy", when=crossunder(hist, 0))
Detail
https://www.fmz.com/strategy/431970
Last Modified
2023-11-13 17:51:20
