Name
动量平均倒数救济拉回策略Momentum-Average-Inverse-Relief-Pullback-Strategy
Author
ChaoZhang
Strategy Description
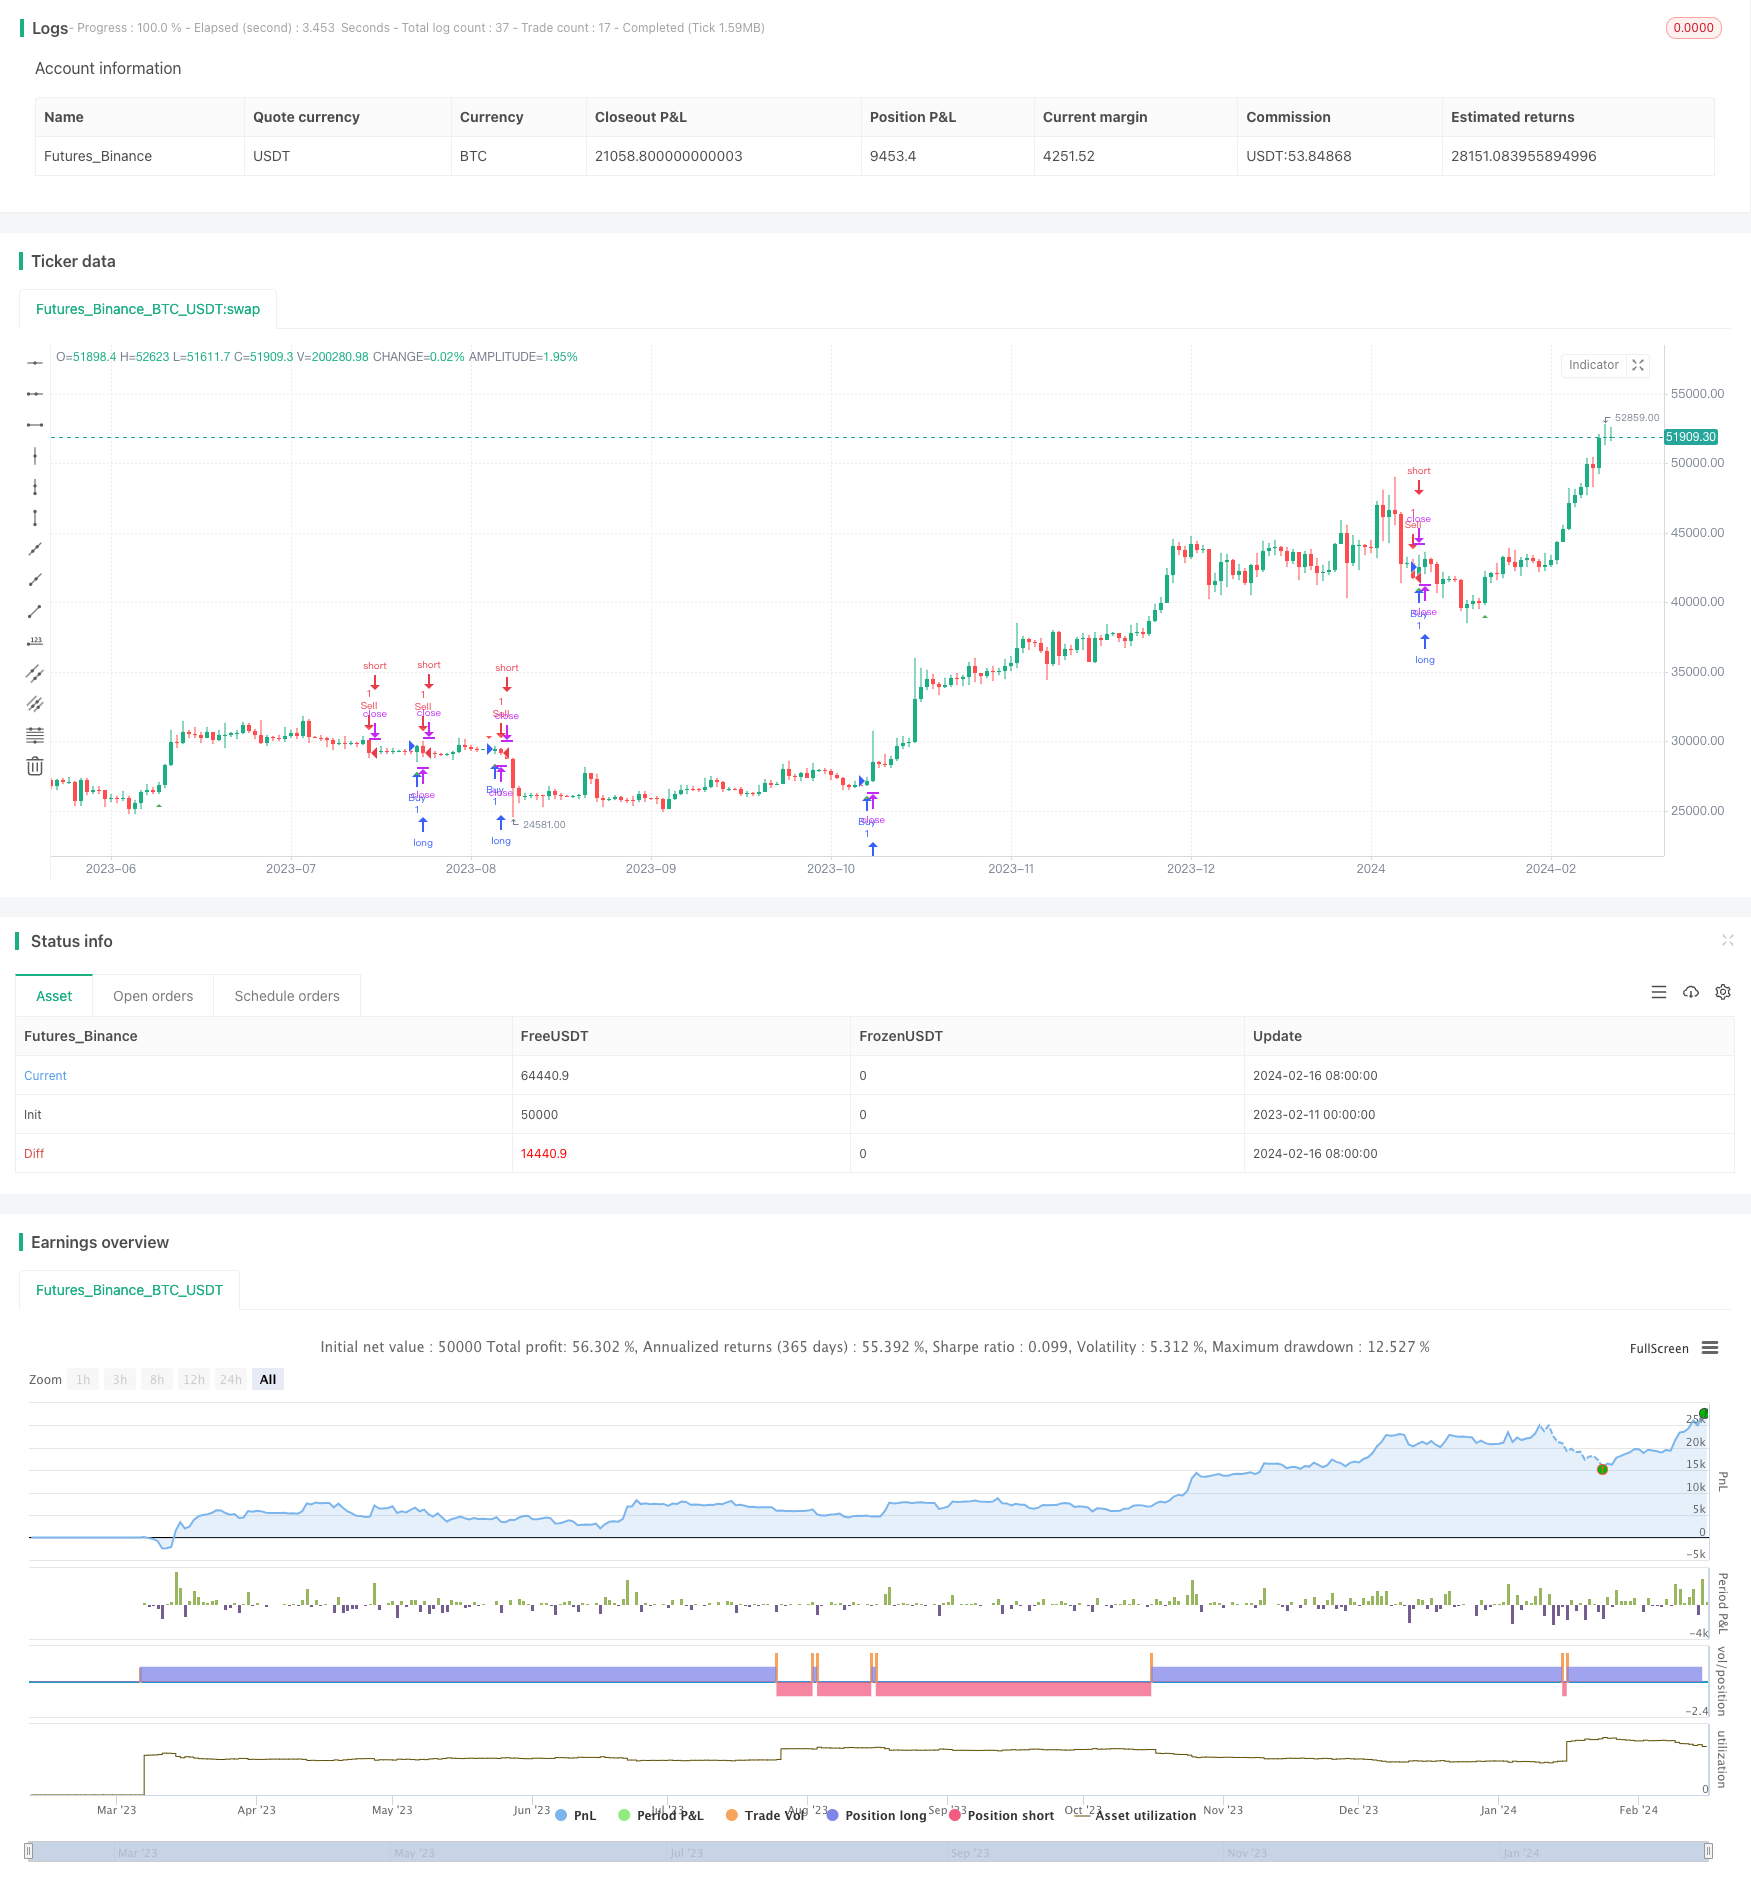
动量平均倒数救济拉回策略(Momentum Average Inverse Relief Pullback Strategy)是一种简单的在移动平均线附近进行反转操作的策略。该策略采用 50 期指数移动平均线作为主要的趋势判断指标,并结合形态学的吞没规则来寻找反转机会。在突破移动平均线后,等待第二根或第三根反向K线的形成,如果符合反转形态,则在下一根K线收盘时进行反向开仓,并设置一分钟的止损计时器。
该策略主要基于两个假设:
-
50期EMA可以有效判断市场趋势方向。当价格上穿时,视为多头行情;下穿时,视为空头行情。
-
在趋势突破EMA后,常出现短期的调整反弹,利用反转K线吞没的形态特征,可以捕捉到反弹结束的时机,从而进行反向操作。
具体来说,策略首先计算50期EMA,然后判断价格是否突破该EMA。如果突破多头,则等待2-3根向下的阴线K线,如果下一根K线为多头吞没,则在该K线收盘时做多;如果突破空头,则等待2-3根向上的阳线,如果下一根K线为空头吞没,则在该K线收盘时做空。做多做空后,设置1分钟计时器,超时后平仓。
该策略具有以下优势:
-
操作逻辑简单清晰,容易理解实现,适合初学者。
-
充分利用了移动平均线的趋势判断和K线形态的特征,使交易信号更有效。
-
设置了止损时间,可以控制单次交易的损失。
-
程序化规则明确,避免了主观判断的影响,使策略更可靠。
该策略也存在一定的风险:
-
50日EMA无法完全准确判断趋势,可能出现误断。
-
K线形态判断同样有一定的误判概率。
-
止损时间设置不当,可能增加损失或减少盈利。
-
机器交易中可能存在滑点、串单等问题,从而影响获利。
对策:
-
优化移动平均线的周期参数,找到更合适的数值。
-
结合其他指标进行组合判断,提高信号的可靠性。
-
测试和优化止损时间参数,找到最优参数。
-
在策略中设置滑点控制,避免严重的滑点损失。
该策略可以从以下几个方面进行优化:
-
优化移动平均线周期参数,找到最佳参数。
-
更换其他类型的移动平均线,如加权移动平均线等。
-
增加volume和波幅等过滤器,避免在盘整中出现错误信号。
-
结合 Stochastics, MACD等其他指标进行组合策略,提高信号质量。
-
根据不同品种特点和交易时段设定最佳的止损时间。
-
添加止盈策略,在利润达到一定标准后主动止盈。
动量平均倒数救济拉回策略是一个简单实用的短线交易策略,它主要使用移动平均线来判断趋势,并使用K线吞没来发现反转机会,从而进行短线操作。该策略具有操作清晰、实现简易的优点,但也存在一些参数优化空间。通过一定的测试和调整,该策略可以成为初学者量化交易的良好起点。
||
The Momentum Average Inverse Relief Pullback Strategy is a simple strategy to trade reversal around moving average lines. It uses 50-period Exponential Moving Average (EMA) as the main trend indicator, combined with candlestick engulfing patterns to identify reversal opportunities. After a penetration through the EMA, it waits for 2-3 candles in the opposite direction to form. If the next candle shows an engulfing reversal pattern, a reverse position will be taken at the candle close, with a 1-minute stop loss timer.
The key assumptions of this strategy are:
-
The 50-period EMA is effective in determining market trend. A close above it signals bull trend while a close below it signals bear trend.
-
After a trend penetration through the EMA, there are often short-term pullbacks. By identifying the end of pullbacks using reversal candlestick patterns, profitable reverse trades can be executed.
Specifically, the strategy first calculates the 50-period EMA, then checks if price breaks through it. If a bull breakout happens, it waits for 2-3 red candles downwards. If the next candle shows a bullish engulfing pattern, long position will be taken on close. Similarly for bear breakouts. After taking positions, a 1-minute stop loss timer is started. Positions will be closed on timer expiration.
The main advantages of this strategy:
-
The logic is simple and clear, easy to understand and implement, suitable for beginners.
-
It utilizes both the trending effectiveness of moving averages and the predictive power of candlestick patterns, making the signals more reliable.
-
The stop loss timer controls single trade risk.
-
The systematic rules avoid subjective judgements and improve consistency.
Some main risks are:
-
The 50-period EMA cannot fully capture trends accurately all the time. There can be misjudgements of trend.
-
Candlestick patterns also have probabilistic nature which leads to false signals.
-
Ineffective stop loss timer settings may lead to larger losses or profit giving up.
-
Slippage, partial fills etc. impacts strategy performance.
Some mitigations:
-
Optimize EMA period parameter to find the best fit.
-
Incorporate other indicators for strengthening signals.
-
Test and find optimal risk parameters.
-
Implement stop loss mechanisms against slippage in live trading.
Some ways to enhance the strategy:
-
Optimize EMA parameter to find best periods.
-
Test other EMA variants e.g. weighted moving average.
-
Add filters on volume or volatility to remove false signals during sideways periods.
-
Create combination strategies with other indicators e.g. Stochastics, MACD to improve signal quality.
-
Fine tune the stop loss timer duration based on product specification and trading sessions.
-
Consider adding profit taking mechanisms to lock gains after reaching profit targets.
The Momentum Average Inverse Relief Pullback Strategy is a simple and practical short term trading strategy. It uses EMA crossovers to determine trends and candlestick patterns to identify reversals for executing tactical trades. Despite some parameter optimization space, its clarity in logic makes it a good starting point strategy for novice quants. With proper testing and refinements, it can evolve into a robust tactical system. [/trans]
Strategy Arguments
| Argument | Default | Description |
|---|---|---|
| v_input_1 | 50 | EMA Period |
Source (PineScript)
/*backtest
start: 2023-02-11 00:00:00
end: 2024-02-17 00:00:00
period: 1d
basePeriod: 1h
exchanges: [{"eid":"Futures_Binance","currency":"BTC_USDT"}]
*/

//@version=5
strategy("LinoR EMA Pullback Strategy", shorttitle="EPS", overlay=true)

// Define EMA period
emaPeriod = input(50, title="EMA Period")

// Calculate 50 EMA
ema50 = ta.ema(close, emaPeriod)

// Calculate engulfing conditions
engulfingBullish = close[1] < open[1] and close > open and close > close[1] and open < open[1]
engulfingBearish = close[1] > open[1] and open > close and open > open[1] and close < close[1]

// Define a 1-minute timer
var timer = 0
if bar_index > 0
    timer := timer[1] + 1

// Long condition
longCondition = ta.crossover(close, ema50) and engulfingBullish
if longCondition
    strategy.entry("Buy", strategy.long)

// Short condition
shortCondition = ta.crossunder(close, ema50) and engulfingBearish
if shortCondition
    strategy.entry("Sell", strategy.short)

// Exit after 1 minute
if timer >= 1
    strategy.close("Exit")

plotshape(series=longCondition, title="Long Signal", location=location.belowbar, color=color.green, style=shape.triangleup, size=size.small)
plotshape(series=shortCondition, title="Short Signal", location=location.abovebar, color=color.red, style=shape.triangledown, size=size.small)
Detail
https://www.fmz.com/strategy/441965
Last Modified
2024-02-18 10:21:04
