Name
动量强度反转交易策略Momentum-Reversal-Trading-Strategy
Author
ChaoZhang
Strategy Description
本策略通过计算相对强度指数(RSI)识别市场潜在的买入和卖出机会。它利用RSI指标判断价格可能从趋势向反趋势转变的点,以捕捉反转机会。当RSI从超买或超卖区域反转时产生交易信号。
该策略的核心指标是RSI,它显示了一段时间内收盘价格上涨的天数相对于价格下跌的天数的比率,用来判断资产是否被高估或低估。RSI以0到100之间的数值展示,数值高表示市场强势向上,数值低表示市场强势向下。
策略首先设置RSI的参数,包括周期长度(默认14)、超卖区域的阈值(默认为70和30)。然后根据收盘价格计算RSI值。当RSI上穿超卖区域的阈值时,产生买入信号;当RSI下穿超卖区域的阈值时,产生卖出信号。
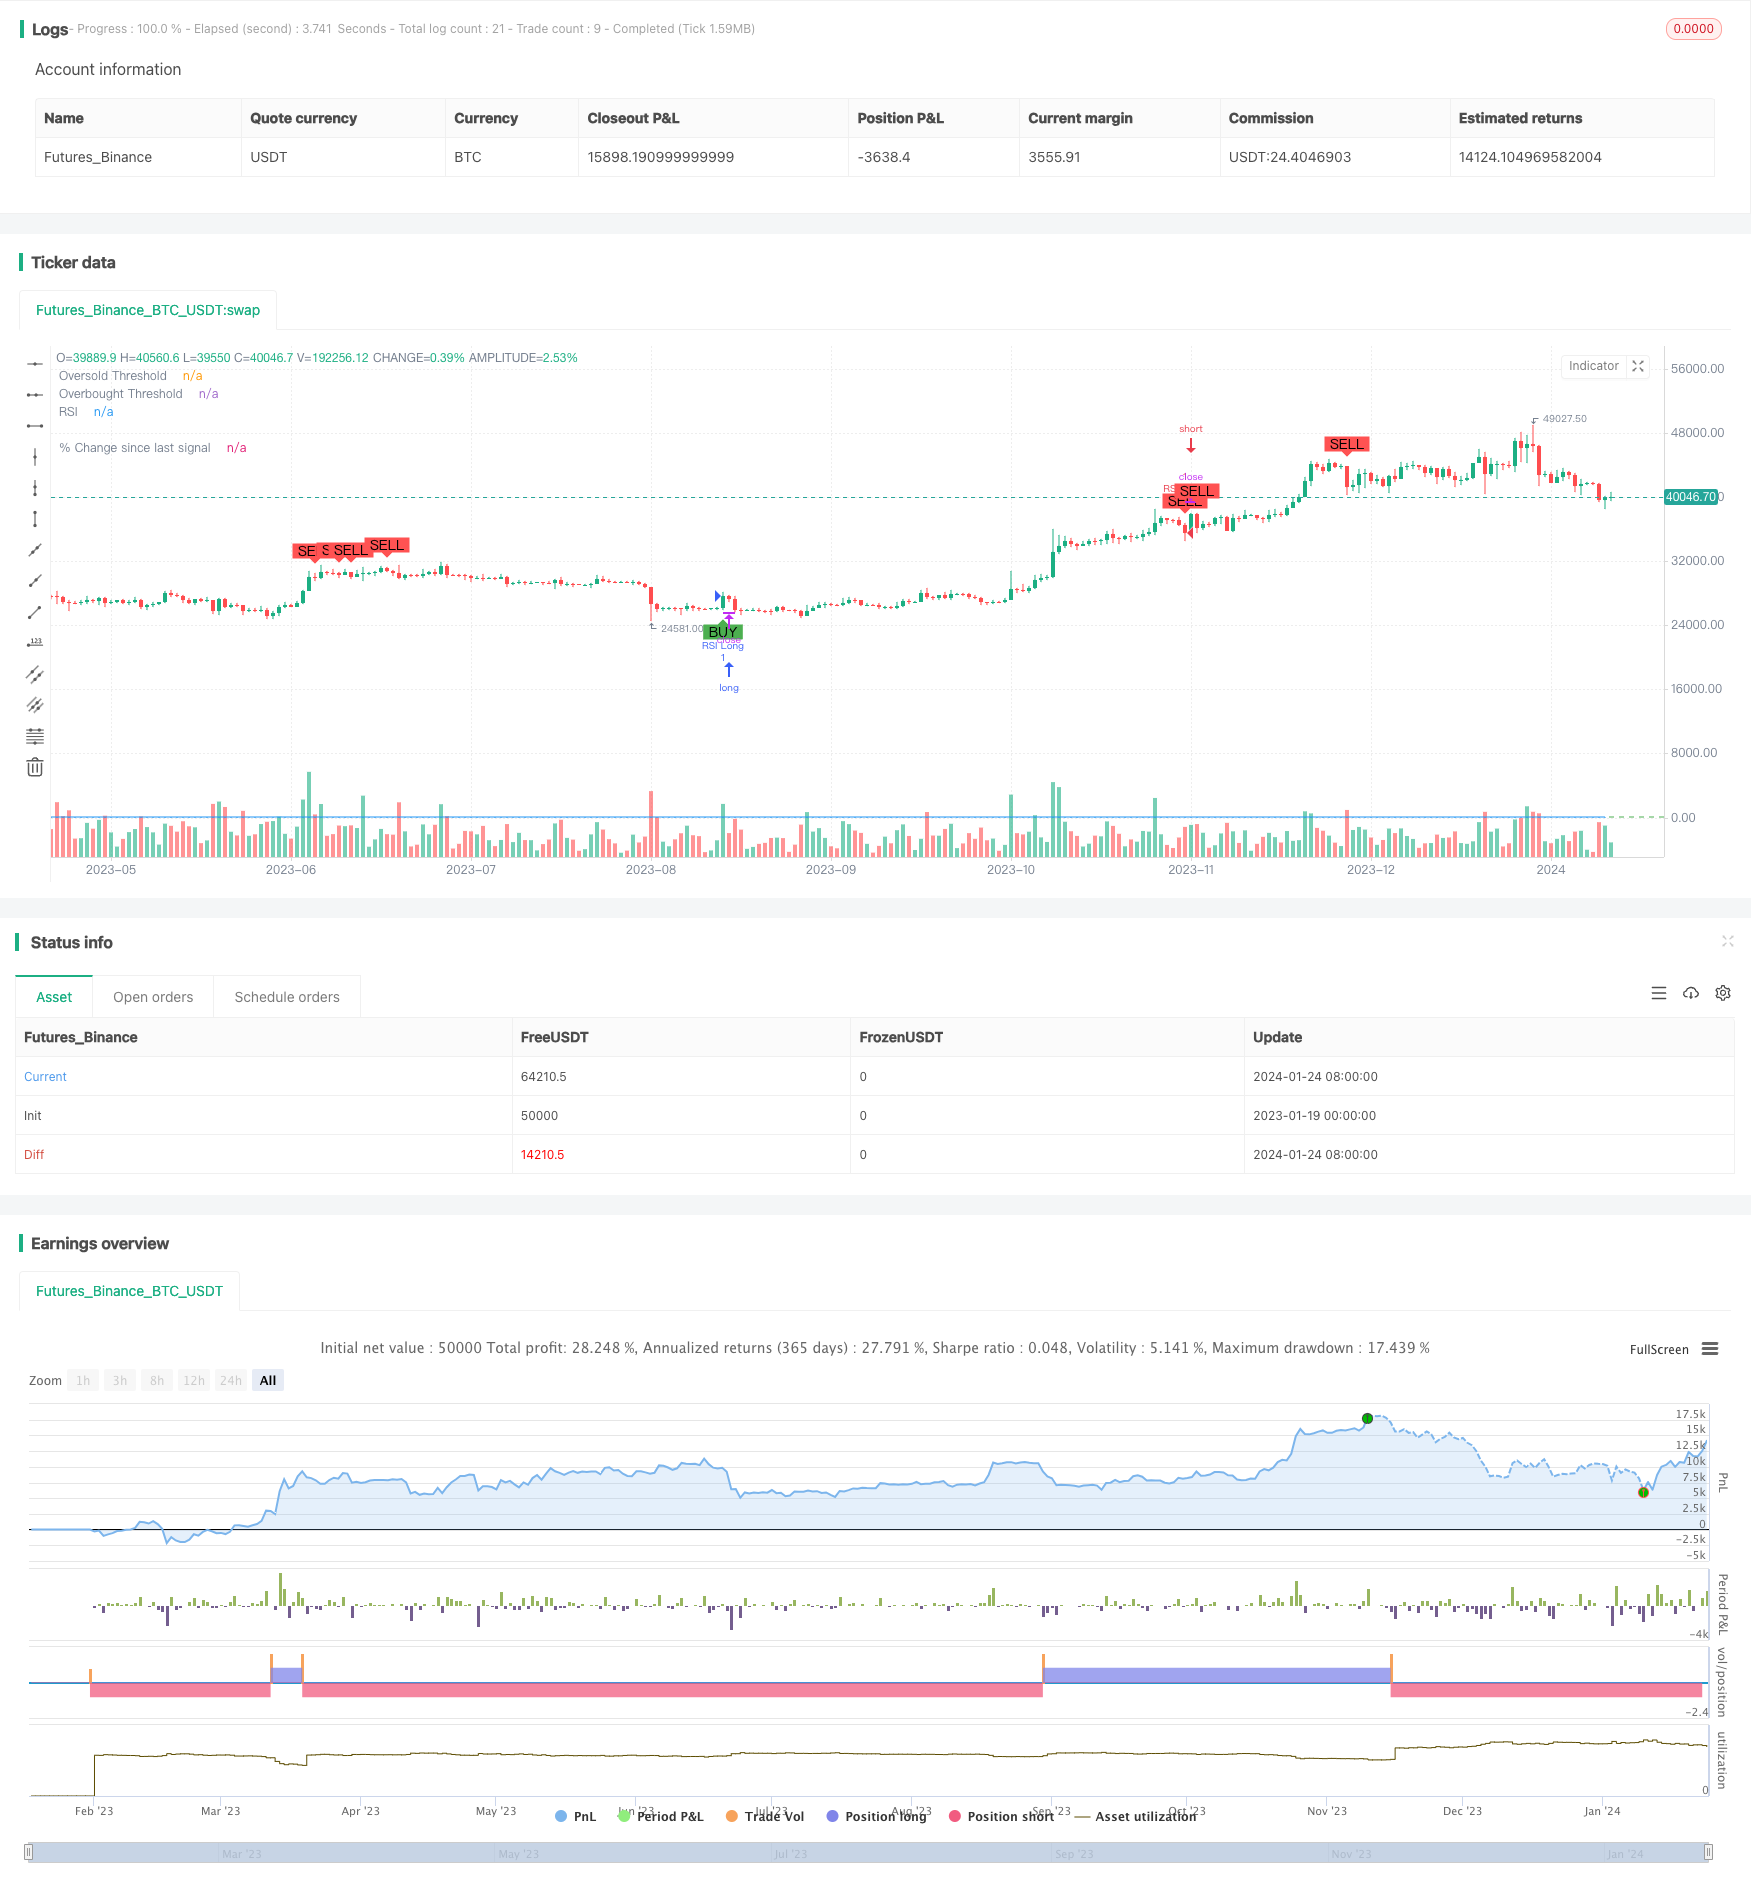
策略同时绘制RSI指标曲线,以及阈值线。在价格图上用文字和图形标记买入卖出信号。另外,策略计算并绘制自上一个交易信号以来价格变化的百分比,让交易者直观看到信号后的价格走势。
- 利用RSI指标判断超买超卖的能力,有效识别反转机会
- 结合视觉化的交易信号,可以清晰看到入场点位
- 计算并显示自上一个信号后的百分比变化,判断趋势反转的效果
- RSI参数可自定义设定,适用于不同周期和资产的交易
- 可单独使用,也可以和其他指标组合,提高策略效果
- RSI产生假信号的可能性,未实际触发反转
- 反转后的趋势延续性不足,可能是短期调整
- 高波动时期RSI指标失效的概率较大
- 建议与量价指标组合使用,确保交易信号的可靠性
- 阀值区域宜适当调整,以减少假信号
- 增加止损机制,以控制单笔损失
- 结合移动平均线等指标,避免假突破
- 测试不同长度周期的RSI参数效果
- 根据市场情况优化超买超卖区域的阈值
- 增加仓位管理模块,让盈利盘实现指数增长
本策略通过相对强度指数的反转交易原理设计而成,主要判断资产短期内是否出现明显的超买超卖现象,以捕捉随后的反转机会。计算百分比变化并配合可视化的交易提示,可以辅助交易决策。RSI参数可自定义设定,用户可以根据个人偏好进行调整。结合其他指标提高信号可靠性,以及适当优化可以减少假信号,是本策略的发展方向。
||
This strategy identifies potential buy and sell opportunities in the market by calculating the Relative Strength Index (RSI). It utilizes the RSI indicator to spot points where price may reverse from a trend to a counter-trend, in order to capture reversal opportunities. Trading signals are generated when the RSI reverses from overbought or oversold territories.
The core indicator of this strategy is RSI. It shows the ratio of upward price closes to downward price closes over a period of time, used to judge if an asset is overvalued or undervalued. RSI fluctuates between 0 to 100, with high values indicating a strong upward market and low values indicating a strong downward market.
The strategy first sets the parameters for RSI, including period length (default 14) and threshold values for overbought/oversold territories (default 70/30). It then calculates the RSI value based on closing prices. Buy signals are generated when RSI crosses above the oversold threshold, and sell signals when RSI crosses below the overbought threshold.
The strategy also plots the RSI line, as well as the threshold lines. Buy and sell signals are marked on the price chart with text and shapes. Additionally, the percentage change since the last signal is calculated and plotted to give traders an intuitive view of post-signal price moves.
- Utilizes RSI's ability to judge overbought/oversold to effectively identify reversals
- Clear visualization of entry points with trading signals
- Displays percentage change since last signal to judge effectiveness of reversals
- Customizable RSI parameters suit different periods and assets
- Can be used alone or combined with other indicators to improve strategy
- Possibilities of fake signals where no actual reversal is triggered
- Insufficient trend continuation after reversal, could be short-term corrections
- Higher probability of RSI failure in high volatility periods
- Recommend combining with volume/price indicators to ensure signal reliability
- Threshold zones should be adjusted properly to reduce fake signals
- Add stop loss to control single trade loss
- Combine with Moving Averages etc. to avoid false breakouts
- Test RSI periods of different lengths
- Optimize overbought/oversold threshold values based on market conditions
- Add position management for exponential growth of profitable positions
This strategy is designed based on the reversal trading logic of RSI, mainly judging if assets are significantly overbought or oversold in the short-term, in order to capture subsequent reversals. The percentage change calculation and visual trading prompts can aid in trading decisions. RSI parameters can be customized based on user preferences. Combining with other indicators to improve signal reliability and proper optimizations to reduce fake signals are future enhancement directions for this strategy.
[/trans]
Strategy Arguments
| Argument | Default | Description |
|---|---|---|
| v_input_1 | 14 | RSI Length |
| v_input_2 | 30 | Oversold Threshold |
| v_input_3 | 70 | Overbought Threshold |
Source (PineScript)
/*backtest
start: 2023-01-19 00:00:00
end: 2024-01-25 00:00:00
period: 1d
basePeriod: 1h
exchanges: [{"eid":"Futures_Binance","currency":"BTC_USDT"}]
*/

//@version=5
strategy("Improved RSI Strategy", overlay=true)

// Define RSI parameters
rsiLength = input(14, title="RSI Length")
rsiOversold = input(30, title="Oversold Threshold")
rsiOverbought = input(70, title="Overbought Threshold")

// Calculate RSI
rsiValue = ta.rsi(close, rsiLength)

// Define entry conditions
longCondition = ta.crossover(rsiValue, rsiOversold)
shortCondition = ta.crossunder(rsiValue, rsiOverbought)

// Plot RSI and thresholds
plot(rsiValue, title="RSI", color=color.blue)
hline(rsiOversold, title="Oversold Threshold", color=color.red)
hline(rsiOverbought, title="Overbought Threshold", color=color.green)

// Calculate percentage change since last signal
var float percentageChange = na
lastCloseValue = ta.valuewhen(longCondition or shortCondition, close, 1)

if longCondition or shortCondition
    percentageChange := (close - lastCloseValue) / lastCloseValue * 100

plot(percentageChange, color=color.blue, style=plot.style_histogram, linewidth=1, title="% Change since last signal")

// Execute strategy
if longCondition
    strategy.entry("RSI Long", strategy.long)

if shortCondition
    strategy.entry("RSI Short", strategy.short)

// Plot shapes and text for buy/sell signals
plotshape(series=longCondition, title="Buy Signal", location=location.belowbar, color=color.green, style=shape.labelup, text="BUY")
plotshape(series=shortCondition, title="Sell Signal", location=location.abovebar, color=color.red, style=shape.labeldown, text="SELL")
Detail
https://www.fmz.com/strategy/440097
Last Modified
2024-01-26 15:51:20
