Name
动量指标与恐慌指数交叉策略Momentum-and-Fear-Index-Crossover-Strategy
Author
ChaoZhang
Strategy Description
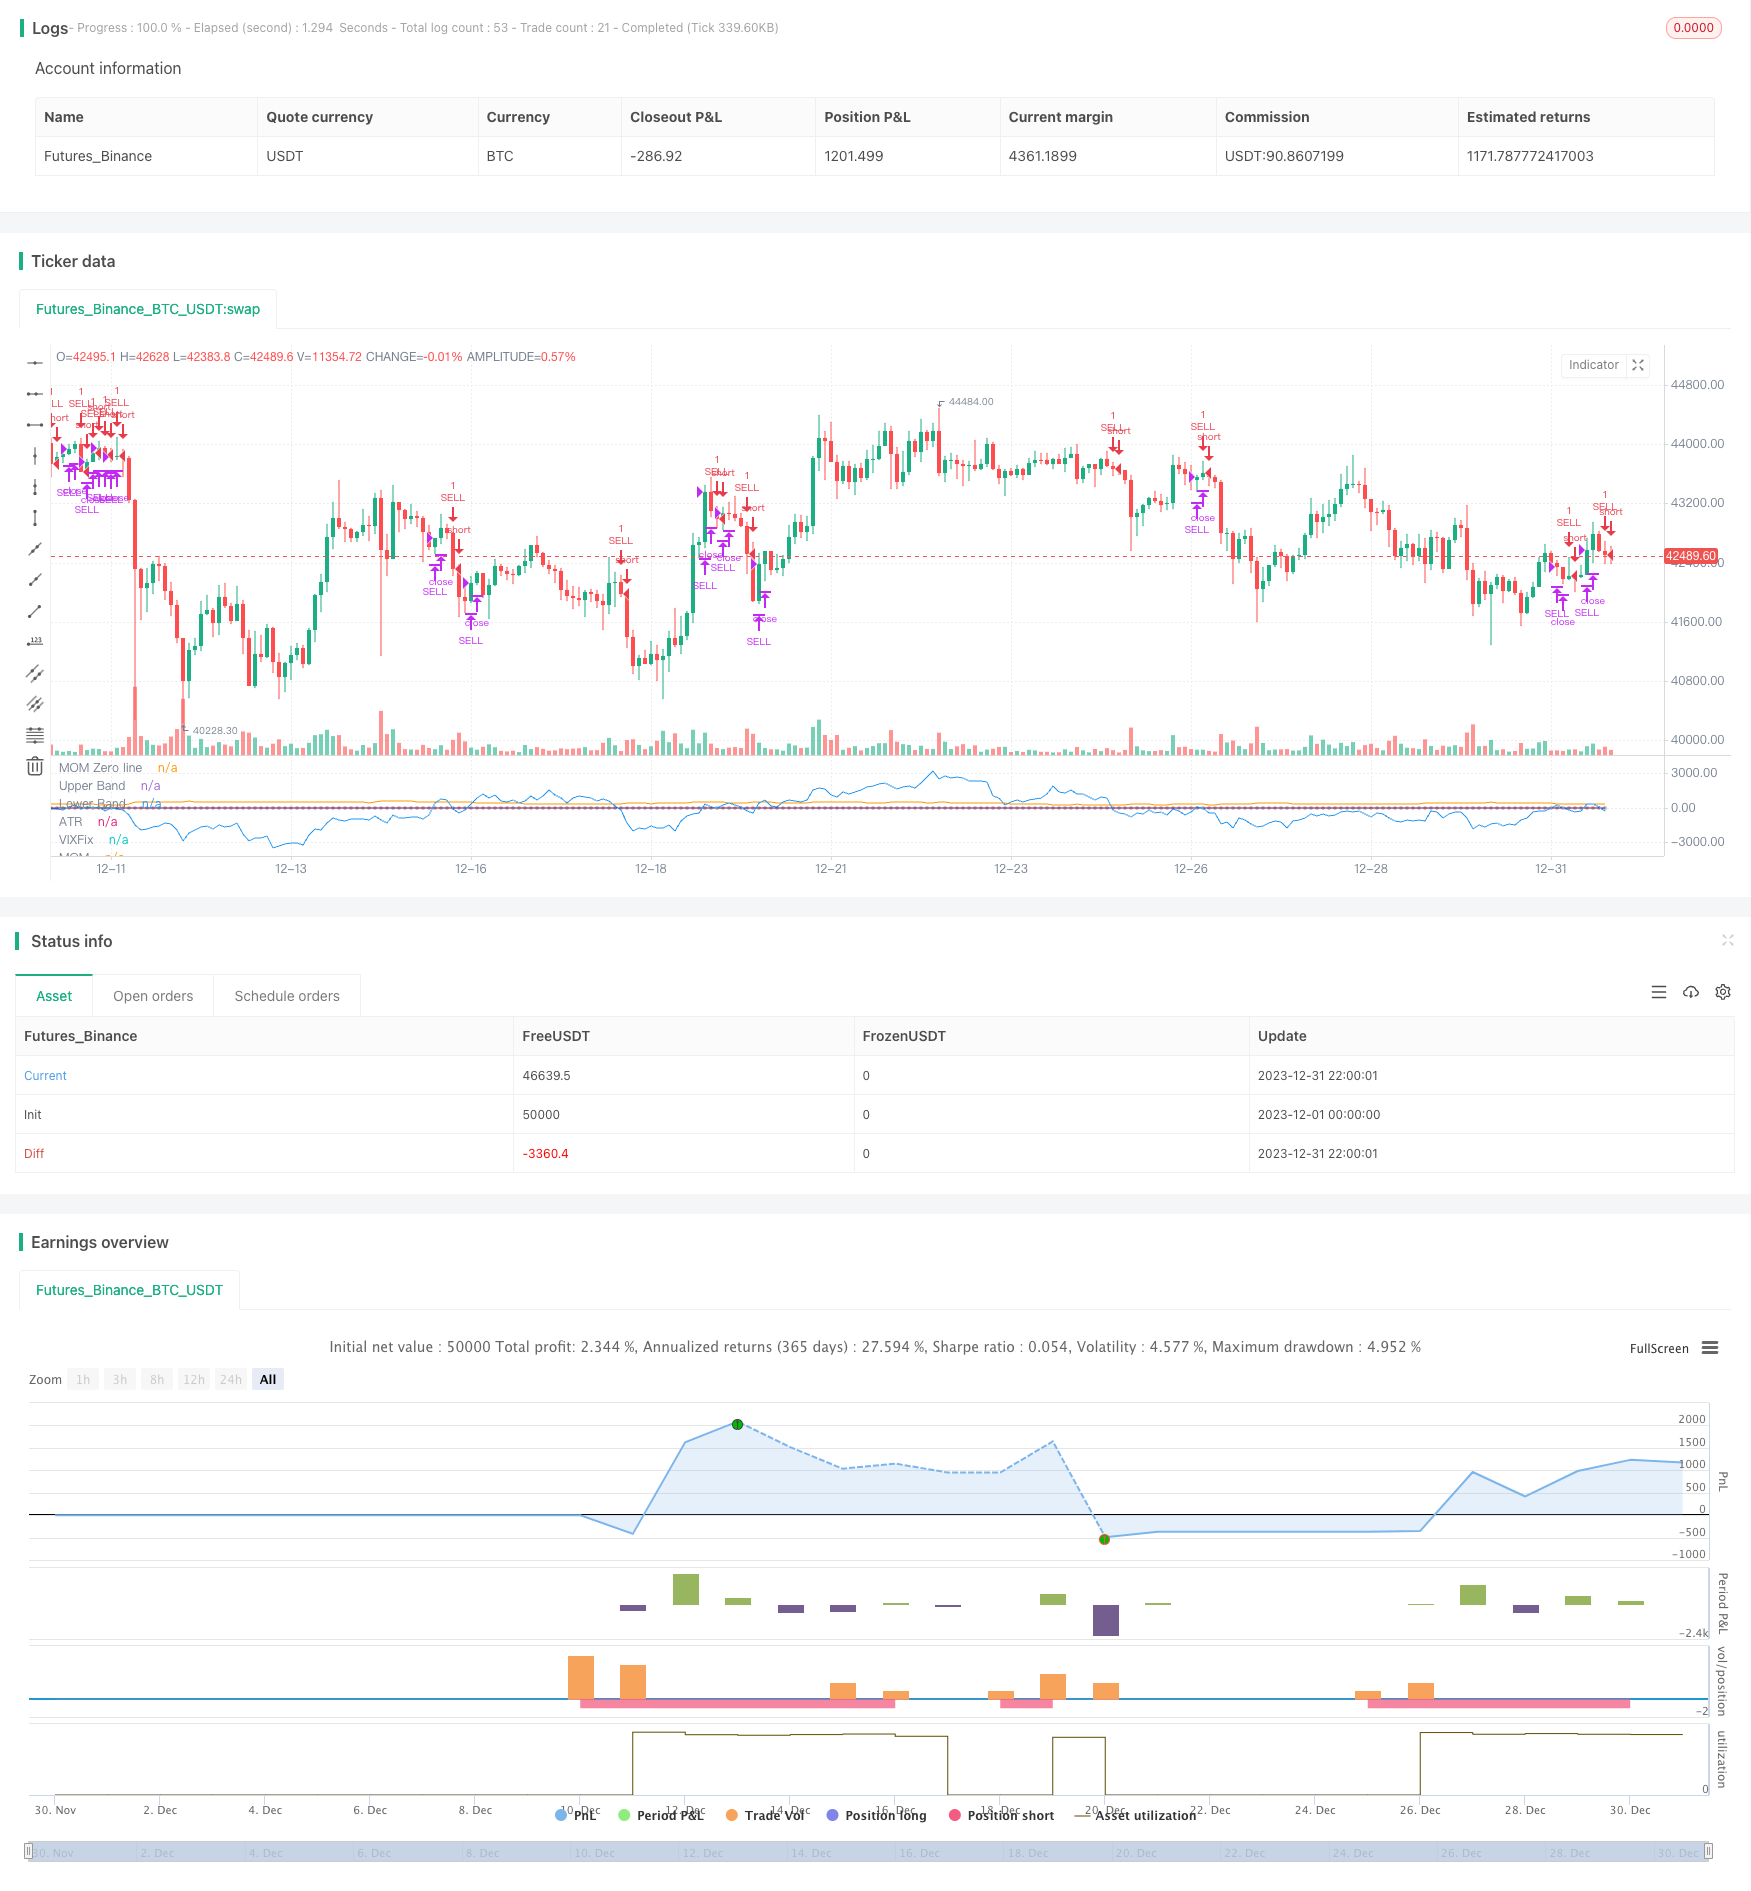
该策略通过计算动量指标和恐慌指数的交叉来判断市场走势,在两个指标发生特定交叉时发出卖出信号,以捕捉大幅下跌行情。
- 计算50周期动量指标。它表示价格相对于50周期前的变化。
- 计算22周期的恐慌指数修正值。它通过最高价和最低价的比值来表示市场的恐慌情绪。
- 当动量指标下穿恐慌指数时,表示市场存在下跌压力。
- 如果动量指标继续下跌进入危险区(-5到5之间),则发出强烈的卖出信号。
- 利用市场交易情绪指标恐慌指数,可以有效判断市场结构性变化。
- 动量指标可以判断价格变化速度和力度,辅助判断市场趋势变化。
- 结合两种不同类型指标,可以提高识别突发事件的准确性。
- 通过调整参数,可以灵活适应不同市场环境。
- 恐慌指数与动量指标交叉并不能保证每次都出现大幅下跌。需要综合其它指标确定最终决策。
- 卖出后没有设置止损,无法有效控制损失。
- 未考虑反转和再次入市问题。策略只适合捕捉突发性下跌。
- 在卖出后设置止损点,控制损失。
- 增加其它指标判断,提高信号的可靠性。如成交量,布林线等。
- 增加再次入市信号,使策略可以完整运行长期周期。
- 对参数进行优化,找到最佳参数组合。
该策略通过动量指标和恐慌指数的交叉来发出市场下跌警示。它可以有效捕捉市场的突发性下跌。但该策略仅适合短线应用,没有退出机制与风险控制。未来需要继续完善,使其成为一个长线可持续策略。
||
This strategy judges market trends by calculating the crossover between a momentum indicator and a fear index, and issues sell signals when the two indicators make specific crosses to catch sharp downturns.
-
Calculate the 50-period momentum indicator. It represents the price change relative to 50 periods ago.
-
Calculate the 22-period corrected fear index. It represents market panic through the ratio of highest and lowest prices.
-
When the momentum indicator crosses below the fear index, it indicates downside pressure in the market.
-
If the momentum continues to fall into the danger zone (between -5 and 5), a strong sell signal is issued.
-
Using the fear index, an indicator of market sentiment, can effectively determine structural changes in the market.
-
The momentum indicator can judge the speed and magnitude of price changes and aid in determining trend changes.
-
Combining two different types of indicators can improve the accuracy of identifying sudden events.
-
Adjusting parameters allows flexible adaptation to different market environments.
-
Crossovers of the fear index and momentum do not guarantee every large decline. Other indicators need to be considered to make the final decision.
-
No stop loss after selling fails to effectively control losses.
-
Reversals and re-entries are not considered. The strategy only suits capturing sudden crashes.
-
Set a stop loss after selling to control losses.
-
Add other indicators to judge and improve signal reliability, e.g. volume, Bollinger bands.
-
Add re-entry signals to enable the strategy to run long-term cycles.
-
Optimize parameters to find the best parameter combinations.
The strategy issues market decline alerts through crossovers of the momentum indicator and fear index. It can effectively capture sudden market crashes. But the strategy only suits short-term usage without exit mechanisms and risk control. Further improvements are needed to make it a sustainable long-term strategy.
[/trans]
Strategy Arguments
| Argument | Default | Description |
|---|---|---|
| v_input_1 | 50 | Length |
| v_input_2_close | 0 | Source: close |
| v_input_3 | 5 | bandUpper |
| v_input_4 | -5 | bandLower |
| v_input_5 | true | showVixFix |
| v_input_6 | true | showMomentum |
| v_input_7 | 22 | VIX Fix Length |
Source (PineScript)
/*backtest
start: 2023-12-01 00:00:00
end: 2023-12-31 23:59:59
period: 2h
basePeriod: 15m
exchanges: [{"eid":"Futures_Binance","currency":"BTC_USDT"}]
*/

// This source code is subject to the terms of the Mozilla Public License 2.0 at https://mozilla.org/MPL/2.0/
// © gary_trades

//THIS SCRIPT HAS BEEN BUIL TO BE USED AS A S&P500 SPY CRASH INDICATOR (should not be used as a strategy).
//THIS SCRIPT HAS BEEN BUILT AS A STRATEGY FOR VISUALIZATION PURPOSES ONLY AND HAS NOT BEEN OPTIMISED FOR PROFIT.
//The script has been built to show as a lower indicator and also gives visual SELL signal on top when conditions are met. BARE IN MIND NO STOP LOSS, NOR ADVANCED EXIT STRATEGY HAS BEEN BUILT.
//As well as the chart SELL signal an alert has also been built into this script.
//The script utilizes a VIX indicator (marron line) and 50 period Momentum (blue line) and Danger/No trade zone(pink shading).
//When the Momentum line crosses down across the VIX this is a sell off but in order to only signal major sell offs the SELL signal only triggers if the momentum continues down through the danger zone.
//To use this indicator to identify ideal buying then you should only buy when Momentum line is crossed above the VIX and the Momentum line is above the Danger Zone.
//This is best used as a daily time frame indicator

//@version=4
strategy(title="S&P Bear Warning", shorttitle="Bear Warning" )

//Momentum
len = input(50, minval=1, title="Length")
src = input(close, title="Source")
bandUpper = input( 5)
bandLower = input(-5)
// ————— Control plotting of each signal. You could use the same technique to be able to turn acc/dist on/off.
showVixFix = input(true)
showMomentum = input(true)

mom = src - src[len]
myAtr = atr(14)
plot(showMomentum ? mom : na, color=color.blue, title="MOM")
plot(showMomentum ? 0 : na, color=color.silver, title="MOM Zero line", style=plot.style_circles, transp=100)
plot(showMomentum ? myAtr : na, color=color.orange, title="ATR", transp=90)

//VIX
VIXFixLength = input(22,title="VIX Fix Length")
VIXFix = (highest(close,VIXFixLength)-low)/(highest(close,VIXFixLength))*100
plot(showVixFix ? VIXFix : na, "VIXFix", color=color.maroon)

band1 = plot(showVixFix ? bandUpper : na, "Upper Band", color.red, 1, plot.style_line, transp=90)
band0 = plot(showVixFix ? bandLower : na, "Lower Band", color.red, 1, plot.style_line, transp=90)
fill(band1, band0, color=color.red, transp=85, title="Background")

//Identify Triggers
//Back Test Range
start = timestamp("America/New_York", 2000, 1, 1, 9,30)
end   = timestamp("America/New_York", 2020, 7, 1, 0, 0)

//Momentum
Long1 = mom > bandUpper
Short1 = mom < bandLower

//VIX
Long2  = crossover(mom, VIXFix)
Short2 = crossunder(mom, VIXFix)

//Warning Alert
SellAlert = Short1
alertcondition(SellAlert, title="Sell SPY", message="Warning Selling off {{ticker}}, price= {{close}}")

//Entry and Exit
if true
    strategy.entry("SELL", false, when = Short1)

strategy.close("SELL", when = Long2)
Detail
https://www.fmz.com/strategy/439741
Last Modified
2024-01-23 14:27:23
