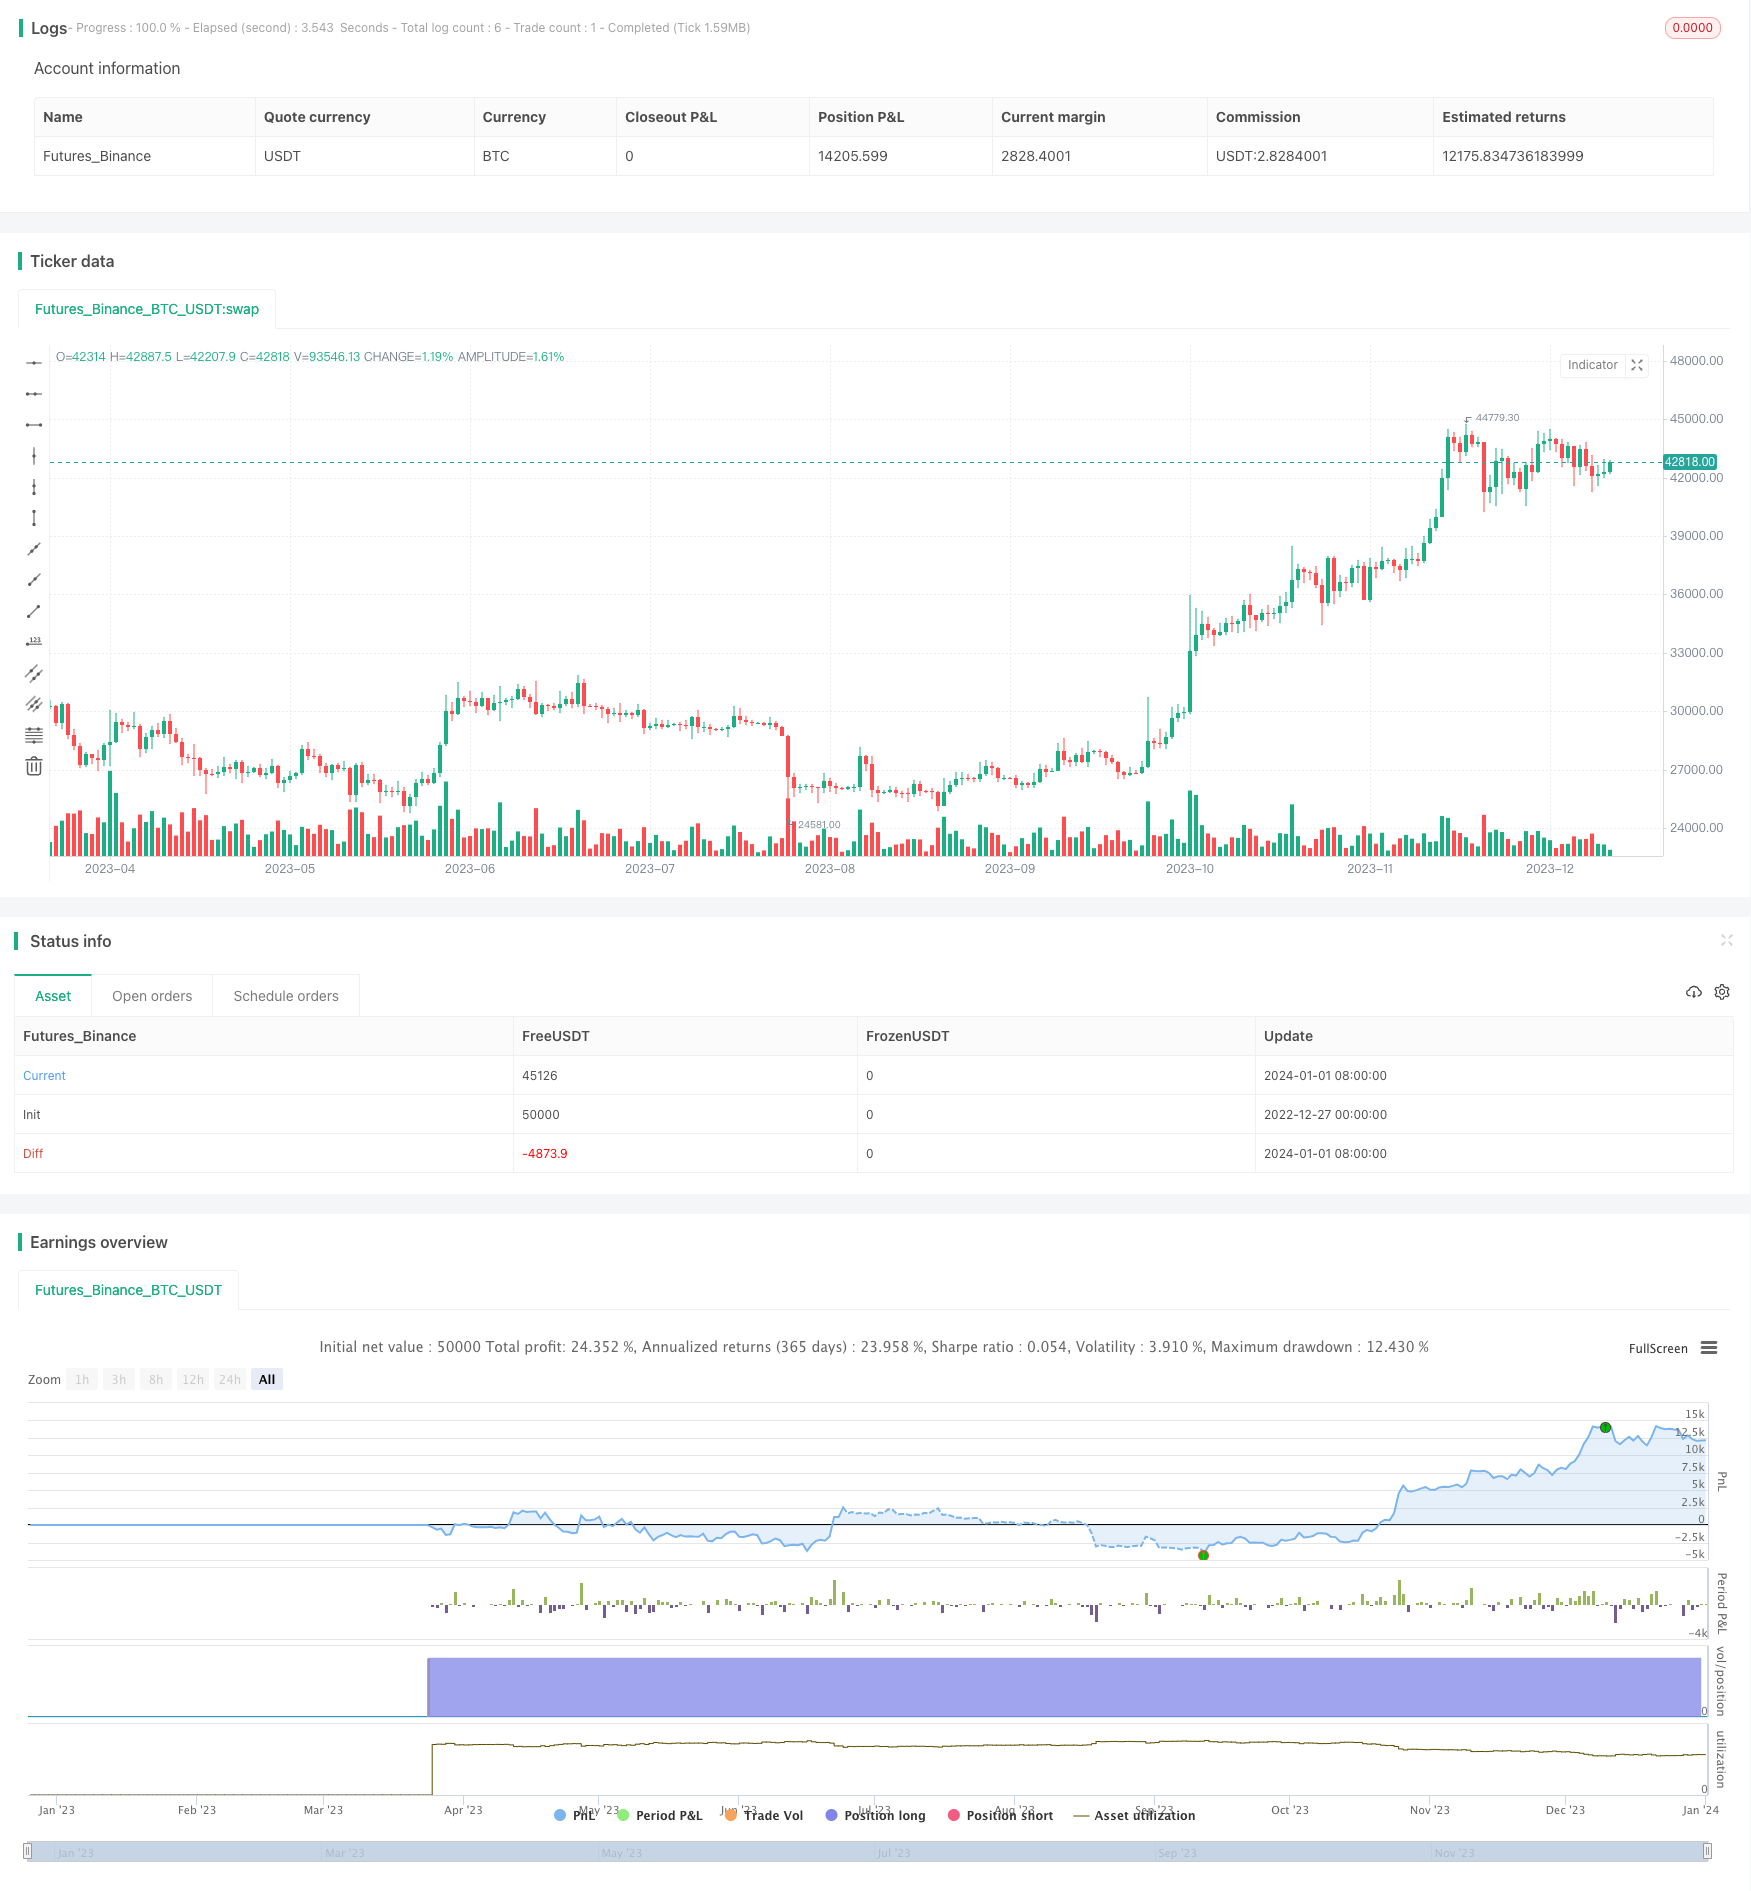
Name
动量指标RSI捕捉反转交易策略Momentum-Indicator-RSI-Reversal-Trading-Strategy
Author
ChaoZhang
Strategy Description
本策略首先在高时间框架上计算ADX和SMA,识别趋势方向和趋势变化。然后在低时间框架上计算RSI,识别超买超卖现象,形成交易信号。
-
在高时间框架上计算ADX判断趋势力度。ADX上涨代表趋势加强。
-
在高时间框架上计算SMA判断趋势方向。SMA上涨代表价格上涨,SMA下降代表价格下跌。
-
在低时间框架上计算RSI判断超买超卖现象。RSI高于阈值代表超买,RSI低于阈值代表超卖。
-
当ADX上涨,SMA上涨,低时间框架RSI超买时,认为趋势正在加强向上,这时可以做空。
-
当ADX上涨,SMA下降,低时间框架RSI超卖时,认为趋势正在加强向下,这时可以做多。
-
结合了趋势判断和反转交易,可以在较大的趋势中捕捉反转机会。
-
利用不同时间框架上的指标组合,可以提高信号的可靠性。
-
RSI策略 simplicity自己,容易理解和实现。
-
RSI产生假信号的可能性存在,使交易出现亏损。可通过参数优化降低假信号概率。
-
大周期趋势判断可能错误,使策略不适用该市场环境。可考虑结合更多指标判断趋势。
-
交易频率可能过高,交易成本影响盈利能力。可适当调整RSI参数,降低交易次数。
-
测试更多参数组合,寻找RSI参数和ADX,SMA参数的最佳匹配。
-
增加止损机制,以控制单笔亏损。
-
考虑结合波动率指标,在波动平缓时降低仓位。
-
优化进入和退出的具体价格,例如突破前一根K线的最高价进入做空。
本策略整合趋势判断和反转交易信号,在大周期趋势中寻找局部反转机会。相比单一使用RSI,可靠性更高,避免被套。整体而言是一种较为保守的策略,适合降低假信号概率的投资者。通过参数测试和机制优化,可期待获得更好的策略表现。
||
This strategy first calculates ADX and SMA on higher timeframes to identify trend direction and changes. Then RSI is calculated on lower timeframes to identify overbought and oversold conditions to generate trading signals.
-
ADX on higher timeframes judges the strength of the trend. Rising ADX represents strengthening trend.
-
SMA on higher timeframes judges the direction of the trend. Rising SMA represents rising prices, falling SMA represents falling prices.
-
RSI on lower timeframes judges overbought and oversold conditions. RSI above threshold means overbought, RSI below threshold means oversold.
-
When ADX rises, SMA rises, and RSI overbought on lower timeframe, it's considered the uptrend is strengthening, go short here.
-
When ADX rises, SMA falls, and RSI oversold on lower timeframe, it's considered the downtrend is strengthening, go long here.
-
Combines trend judgment and reversal trading, can capture reversal opportunities in major trends.
-
Utilizes indicators across timeframes, improves reliability of signals.
-
RSI strategy is simple to understand and implement.
-
Potential for false RSI signals, causing losing trades. Can optimize parameters to reduce false signals.
-
Major cycle trend judgment can be wrong, making strategy not suitable for market condition. Can consider more indicators for trend judgment.
-
Potentially high trading frequency, impacting profitability due to transaction costs. Can adjust RSI parameters to reduce number of trades.
-
Test more parameter combinations to find optimal match between RSI and ADX, SMA parameters.
-
Add stop loss mechanism to control single trade loss.
-
Consider volatility indicator to reduce position size when volatility is low.
-
Optimize specific entry and exit prices, like entering short upon breaking previous bar's high.
This strategy combines trend judgment and reversal signals to find local reversals within major trends. Compared to solely using RSI, it is more reliable and avoids being trapped. Overall a relatively conservative strategy suitable for investors looking to reduce false signals. Further parameter testing and mechanism optimization can improve strategy performance.
[/trans]
Strategy Arguments
| Argument | Default | Description |
|---|---|---|
| v_input_1 | true | Custom Resolution / TF ? |
| v_input_2 | 180 | Custom Resolution / TF |
| v_input_3 | 14 | ADX Smoothing |
| v_input_4 | 14 | DI Length |
| v_input_5 | 7 | RSI length |
| v_input_6 | 28 | RSI oversold |
| v_input_7 | 68 | RSI overbought |
| v_input_8 | 20 | SMA HTF Length |
Source (PineScript)
/*backtest
start: 2022-12-27 00:00:00
end: 2024-01-02 00:00:00
period: 1d
basePeriod: 1h
exchanges: [{"eid":"Futures_Binance","currency":"BTC_USDT"}]
*/

//@version=3
strategy("RSI scalping", overlay=true)

CustSession 	= input(defval=true,title= "Custom Resolution / TF ? ",type=bool)
SessionTF0	= input(title="Custom Resolution / TF", defval="180")
adxlen = input(14, title="ADX Smoothing")
dilen = input(14, title="DI Length")
length = input(7, title= "RSI length")
overSold = input( 28, title= "RSI oversold" )
overBought = input( 68, title= "RSI overbought" )

RSI = rsi(close, 7)

res		=	CustSession ? SessionTF0 : period

o = request.security(syminfo.tickerid, res, open)
c = request.security(syminfo.tickerid, res, close)
l = request.security(syminfo.tickerid, res, low)
h = request.security(syminfo.tickerid, res, high)

 // ADX higher time frame
dirmov(len) =>
	up = change(h)
	down = -change(l)
	plusDM = na(up) ? na : (up > down and up > 0 ? up : 0)
    minusDM = na(down) ? na : (down > up and down > 0 ? down : 0)
    truer = request.security(syminfo.tickerid, res, tr)
	truerange = rma(truer, len)
	plus = fixnan(100 * rma(plusDM, len) / truerange)
	minus = fixnan(100 * rma(minusDM, len) / truerange)
	[plus, minus]

adx(dilen, adxlen) =>
	[plus, minus] = dirmov(dilen)
	sum = plus + minus
	adx = 100 * rma(abs(plus - minus) / (sum == 0 ? 1 : sum), adxlen)

sig = adx(dilen, adxlen)

// SMA higher time frame
len = input(20, minval=1, title="SMA HTF Length")
smma = 0.0
smma := na(smma[1]) ? sma(c, len) : (smma[1] * (len - 1) + c) / len

ADXrising = (sig > sig[1]) and (sig[1] > sig[2]) and (sig[2]  > sig[3]) and (sig > 15)
SMAdrop= (smma < smma[1]) and (smma[1] < smma[2]) and (smma[2] < smma[3])
SMArising = (smma > smma[1]) and (smma[1] > smma[2]) and (smma[2] > smma[3])
longCondition = crossover(RSI, overBought) and ADXrising and SMArising
shortCondition = crossunder(RSI, overSold) and SMAdrop and ADXrising

if (longCondition)
    strategy.entry("Long entry", strategy.long)

if (shortCondition)
    strategy.entry("Short Entry", strategy.short)
Detail
https://www.fmz.com/strategy/437506
Last Modified
2024-01-03 12:09:48
