Name
动量波浪线布林带趋势策略Momentum-Wave-Bollinger-Bands-Trend-Strategy
Author
ChaoZhang
Strategy Description
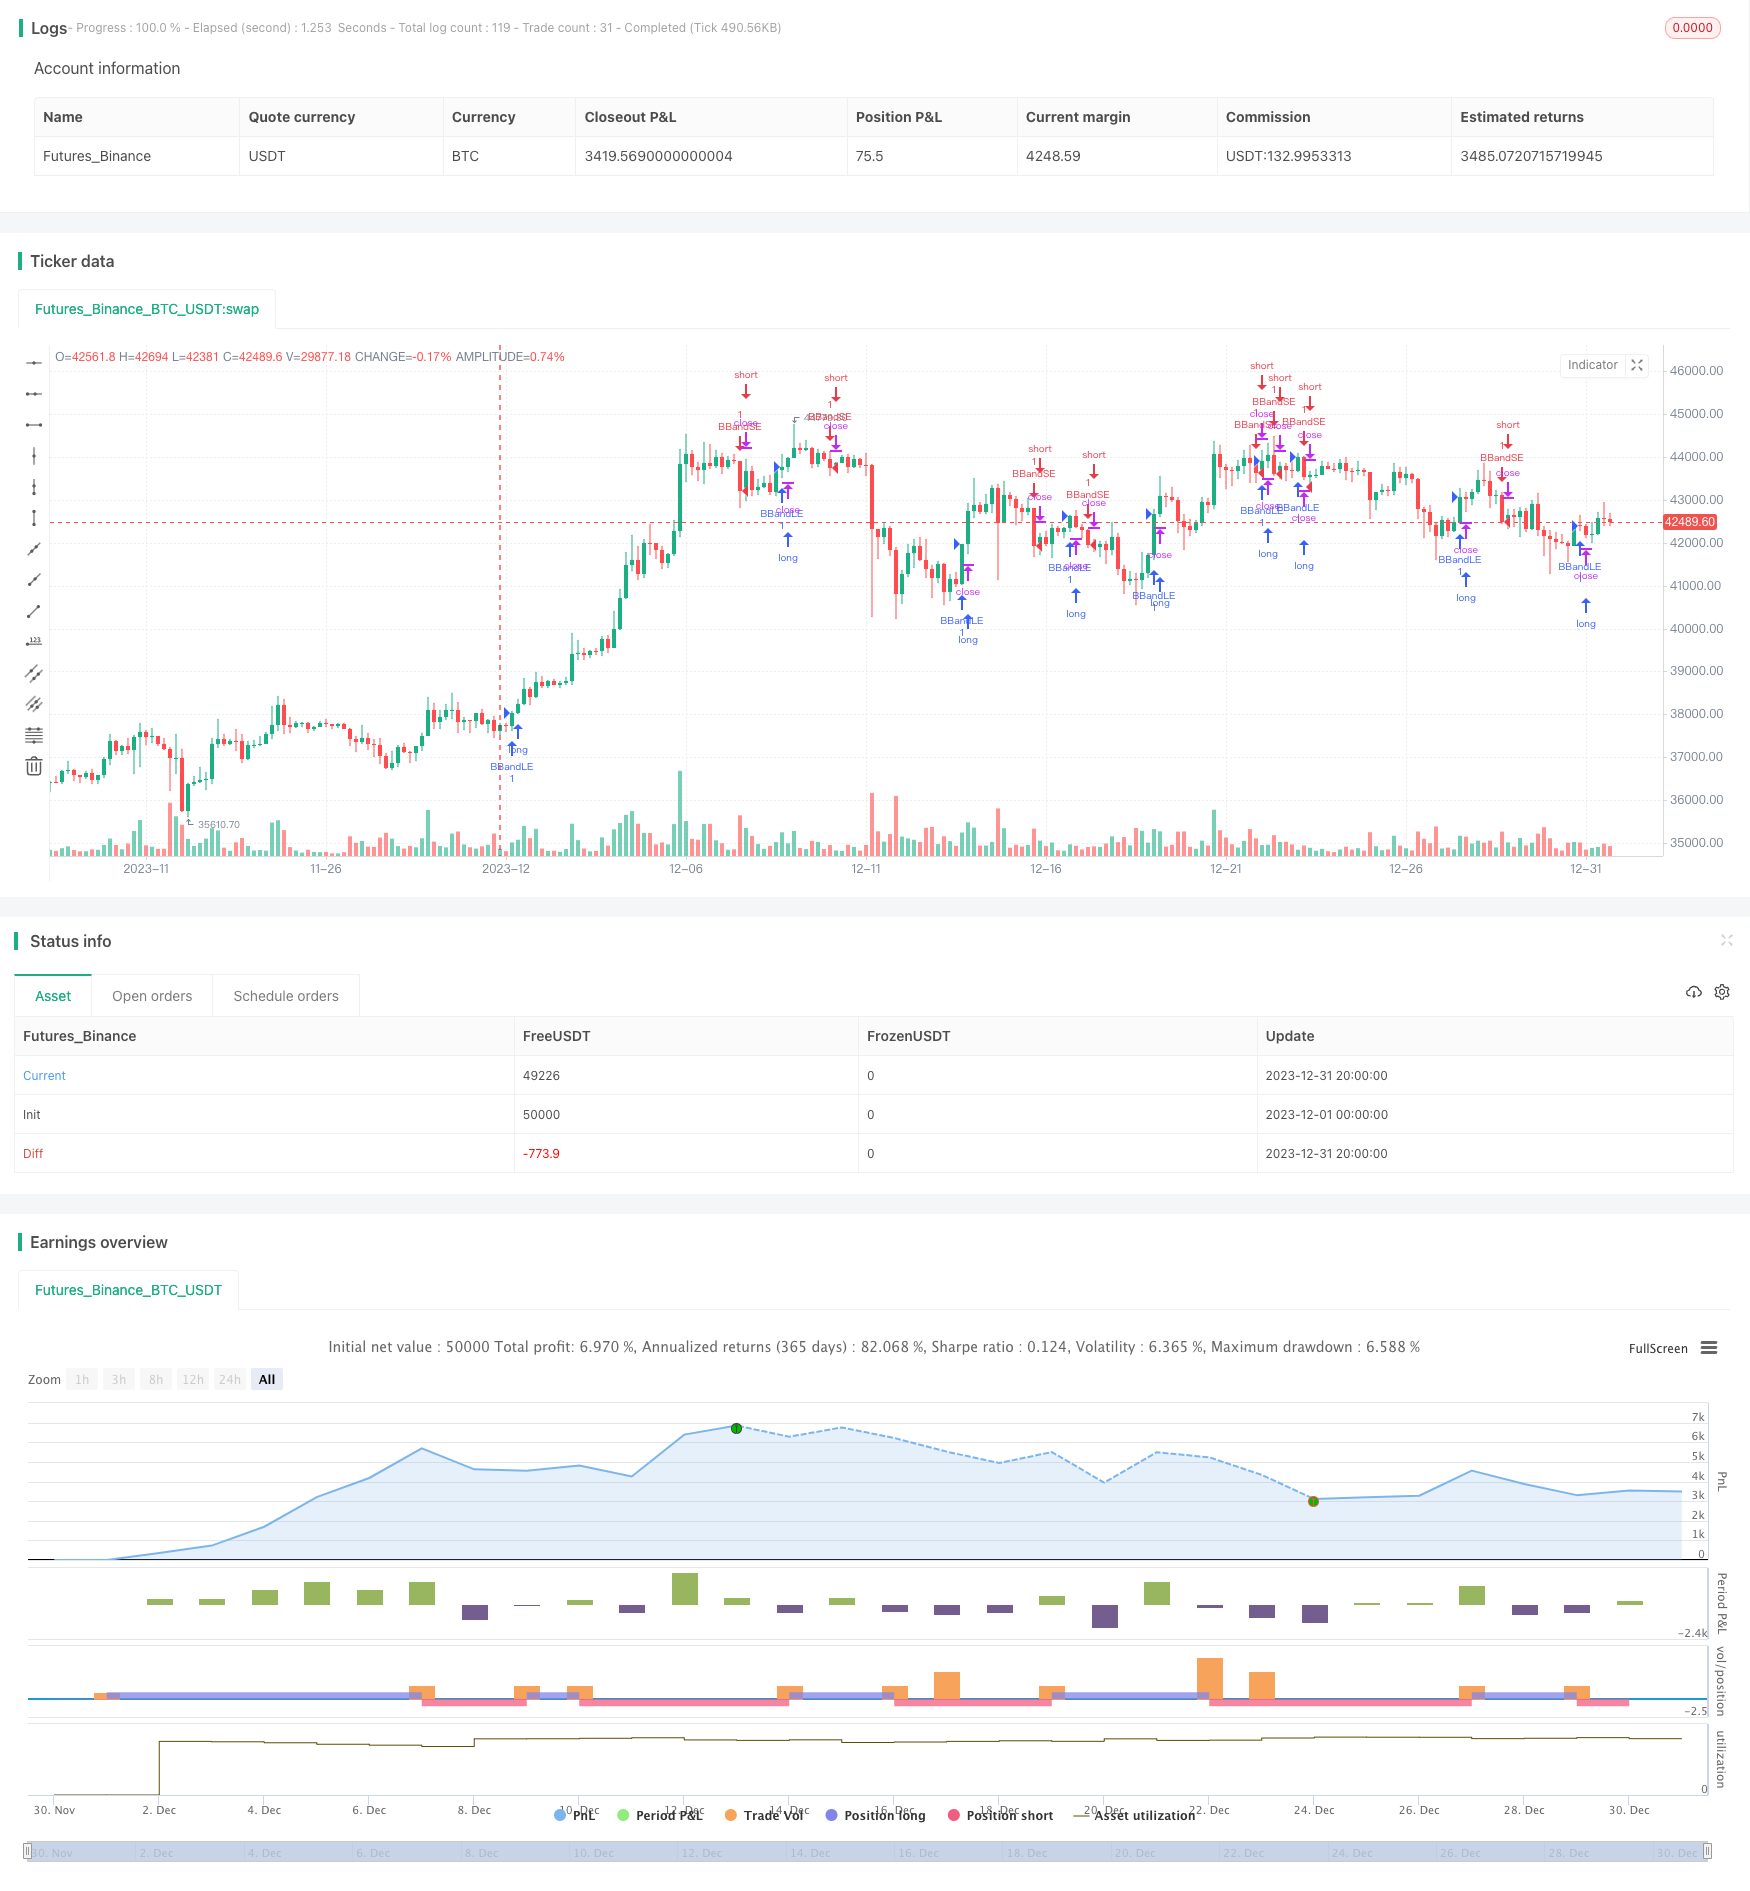
该策略是一个基于布林带的趋势追踪策略。它利用布林带上下轨来判断价格趋势,发出买入和卖出信号。具体来说,当收盘价上穿上轨时,做多;当收盘价下穿下轨时,做空。
该策略使用布林带的上下轨来判断趋势。布林带中线为n天收盘价的简单移动平均线,带宽为中线正负k倍的n天收盘价标准差。其公式如下:
中线:SMA(收盘价,n)
上轨:中线 + k * STDEV(收盘价,n)
下轨:中线 - k * STDEV(收盘价,n)
当价格突破上轨时,说明超过了中线上下波动的范围,表明目前处于上涨趋势;当价格跌破下轨时,说明超过了中线上下波动的范围,表明目前处于下跌趋势。
基于此,该策略判断如下:
- 当收盘价上穿上轨时,做多
- 当收盘价下穿下轨时,做空
利用布林带判断趋势针对中长线比较有效。
该策略主要优势有:
-
利用布林带判断趋势,比较可靠。布林带考虑了股价的波动性,能比较好地判断趋势转折点。
-
策略判断规则简单清晰,容易理解,容易实现。
-
无须预测股价,只要跟踪股价与布林带的关系,操作上比较容易。
-
利用突破上下轨发出信号,比较及时,不会错过趋势机会。
该策略也存在一些风险:
-
布林带并不能完全预测股价走势,上下轨突破后,股价走势不一定会持续,存在一定的错误信号概率。
-
股价可能会在上下轨附近震荡,导致多次小亏损。
-
参数设定不当也会导致失误信号。如n值取太小,布林带变化太快,信号频繁;k值取太大,布林带变化太慢,信号滞后。
-
大盘走势可能对单只股票产生影响,难以完全避免系统风险。
对应的风险控制措施有:
-
适当调整参数n和k值,平衡布林带的灵敏度。
-
增加止损,控制单笔亏损。
-
结合其他技术指标过滤信号。
该策略可从以下几个方面进行优化:
-
优化参数设定。可以测试不同n值参数对结果的影响;也可以使k值参数动态变化,在股价波动大时带宽扩大。
-
增加过滤条件,利用其他指标如MACD、KDJ等对买卖信号进行过滤,减少错误信号。
-
增加止损机制,设定移动止损或者缩量止损,控制亏损。
-
可以基于布林带幅度,判断目前股价波动幅度的高低,从而调整仓位。布林带越宽示波动越大,这个时候降低仓位。
-
结合趋势判断指标,在确定的大方向下使用布林带发信号。
该策略整体来说是一种较为可靠的趋势追踪策略。它利用布林带的上下轨判断价格趋势,简单易操作。主要优势是信号发出及时,能及时捕捉趋势机会。但也存在一定误信号概率和调参优化难度。可以通过参数优化、增加过滤器等方法来控制风险和提高策略稳定性。总体而言,该策略适合对趋势判断要求不高、追求高操作频率的投资者。
||
This is a trend-following strategy based on Bollinger Bands. It uses the upper and lower bands of Bollinger Bands to determine price trends and generate buy and sell signals. Specifically, it goes long when the close price breaks above the upper band and goes short when the close price breaks below the lower band.
The strategy uses the upper and lower bands of Bollinger Bands to determine trends. The middle band of Bollinger Bands is the Simple Moving Average of the close prices over n periods. The width of the bands is k times the standard deviation of close prices over n periods. The formulas are:
Middle Band: SMA(Close, n) Upper Band: Middle Band + k * STDEV(Close, n) Lower Band: Middle Band - k * STDEV(Close, n)
When price breaks above the upper band, it means that price has exceeded the normal fluctuation range around the middle band, indicating an uptrend. When price breaks below the lower band, it means price has fallen outside the normal range, indicating a downtrend.
Based on this, the strategy determines:
- Go long when close price breaks above the upper band
- Go short when close price breaks below the lower band
Using Bollinger Bands to determine trends works well for medium to long term trends.
The main advantages of this strategy are:
-
Using Bollinger Bands to determine trends is reliable. Bollinger Bands considers volatility and can determine turning points well.
-
The strategy rules are simple and clear, easy to understand and implement.
-
No need to predict prices, just track the relationship between price and Bollinger Bands. Easy to operate.
-
Signals are generated on band breaks, capturing trend shifts timely without missing opportunities.
The strategy also has some risks:
-
Bollinger Bands cannot fully predict price movements. Post band breakout, trends may not sustain and whipsaws are possible.
-
Price may oscillate near bands, causing multiple small losses.
-
Inadequate parameter settings may also lead to bad signals. A n that's too small may cause too frequent bands changes and signals. A k too large may lead to lagging signals.
-
Market trends could impact individual stocks and lead to systemic risks.
Corresponding risk control measures:
- Adjust n and k appropriately to balance sensitivity.
- Use stops to control losses on single trades.
- Add filters with other indicators to filter signals.
The strategy can be optimized in several ways:
-
Optimize n and test different settings. Also make k dynamic based on volatility.
-
Add filters using other indicators like MACD and KDJ to filter buy/sell signals and reduce false signals.
-
Add stop loss mechanisms like price based or volatility based stops to control losses.
-
Use Bollinger bandwidth to determine price volatility and adjust position sizes. Wider bands indicate higher volatility so reduce sizes.
-
Combine with trend determining indicators and use bands for entry signals in established trends.
Overall this is a reliable trend following strategy. It uses Bollinger Bands to determine trends and is simple to operate. Main advantages are timely signals capturing shifts in trend. But some whipsaws and parameter optimization difficulties exist. Methods like parameter optimization, adding filters can control risks and improve stability. It suits investors who have moderate trend accuracy needs and prefer high operation frequency.
[/trans]
Strategy Arguments
| Argument | Default | Description |
|---|---|---|
| v_input_1 | 8 | length |
| v_input_2 | true | mult |
Source (PineScript)
/*backtest
start: 2023-12-01 00:00:00
end: 2023-12-31 23:59:59
period: 4h
basePeriod: 15m
exchanges: [{"eid":"Futures_Binance","currency":"BTC_USDT"}]
*/

//@version=4
strategy("Bollinger Bands Trend Strategy", shorttitle="BB Trend", overlay=true)
source = close
length = input(8, minval=1)
mult = input(1.00, minval=0.001, maxval=50)

basis = sma(source, length)
dev = mult * stdev(source, length)

upper = basis + dev
lower = basis - dev

buyEntry = crossover(source, upper)
sellEntry = crossunder(source, lower)

if (crossover(source, upper))
    strategy.entry("BBandLE", strategy.long, stop=upper, oca_name="BollingerBands",  comment="BBandLE")
else
    strategy.cancel(id="BBandLE")

if (crossunder(source, lower))
    strategy.entry("BBandSE", strategy.short, stop=lower, oca_name="BollingerBands", comment="BBandSE")
else
    strategy.cancel(id="BBandSE")

//plot(strategy.equity, title="equity", color=color.red, linewidth=2, style=plot.style_areabr)
Detail
https://www.fmz.com/strategy/439102
Last Modified
2024-01-17 17:33:37
