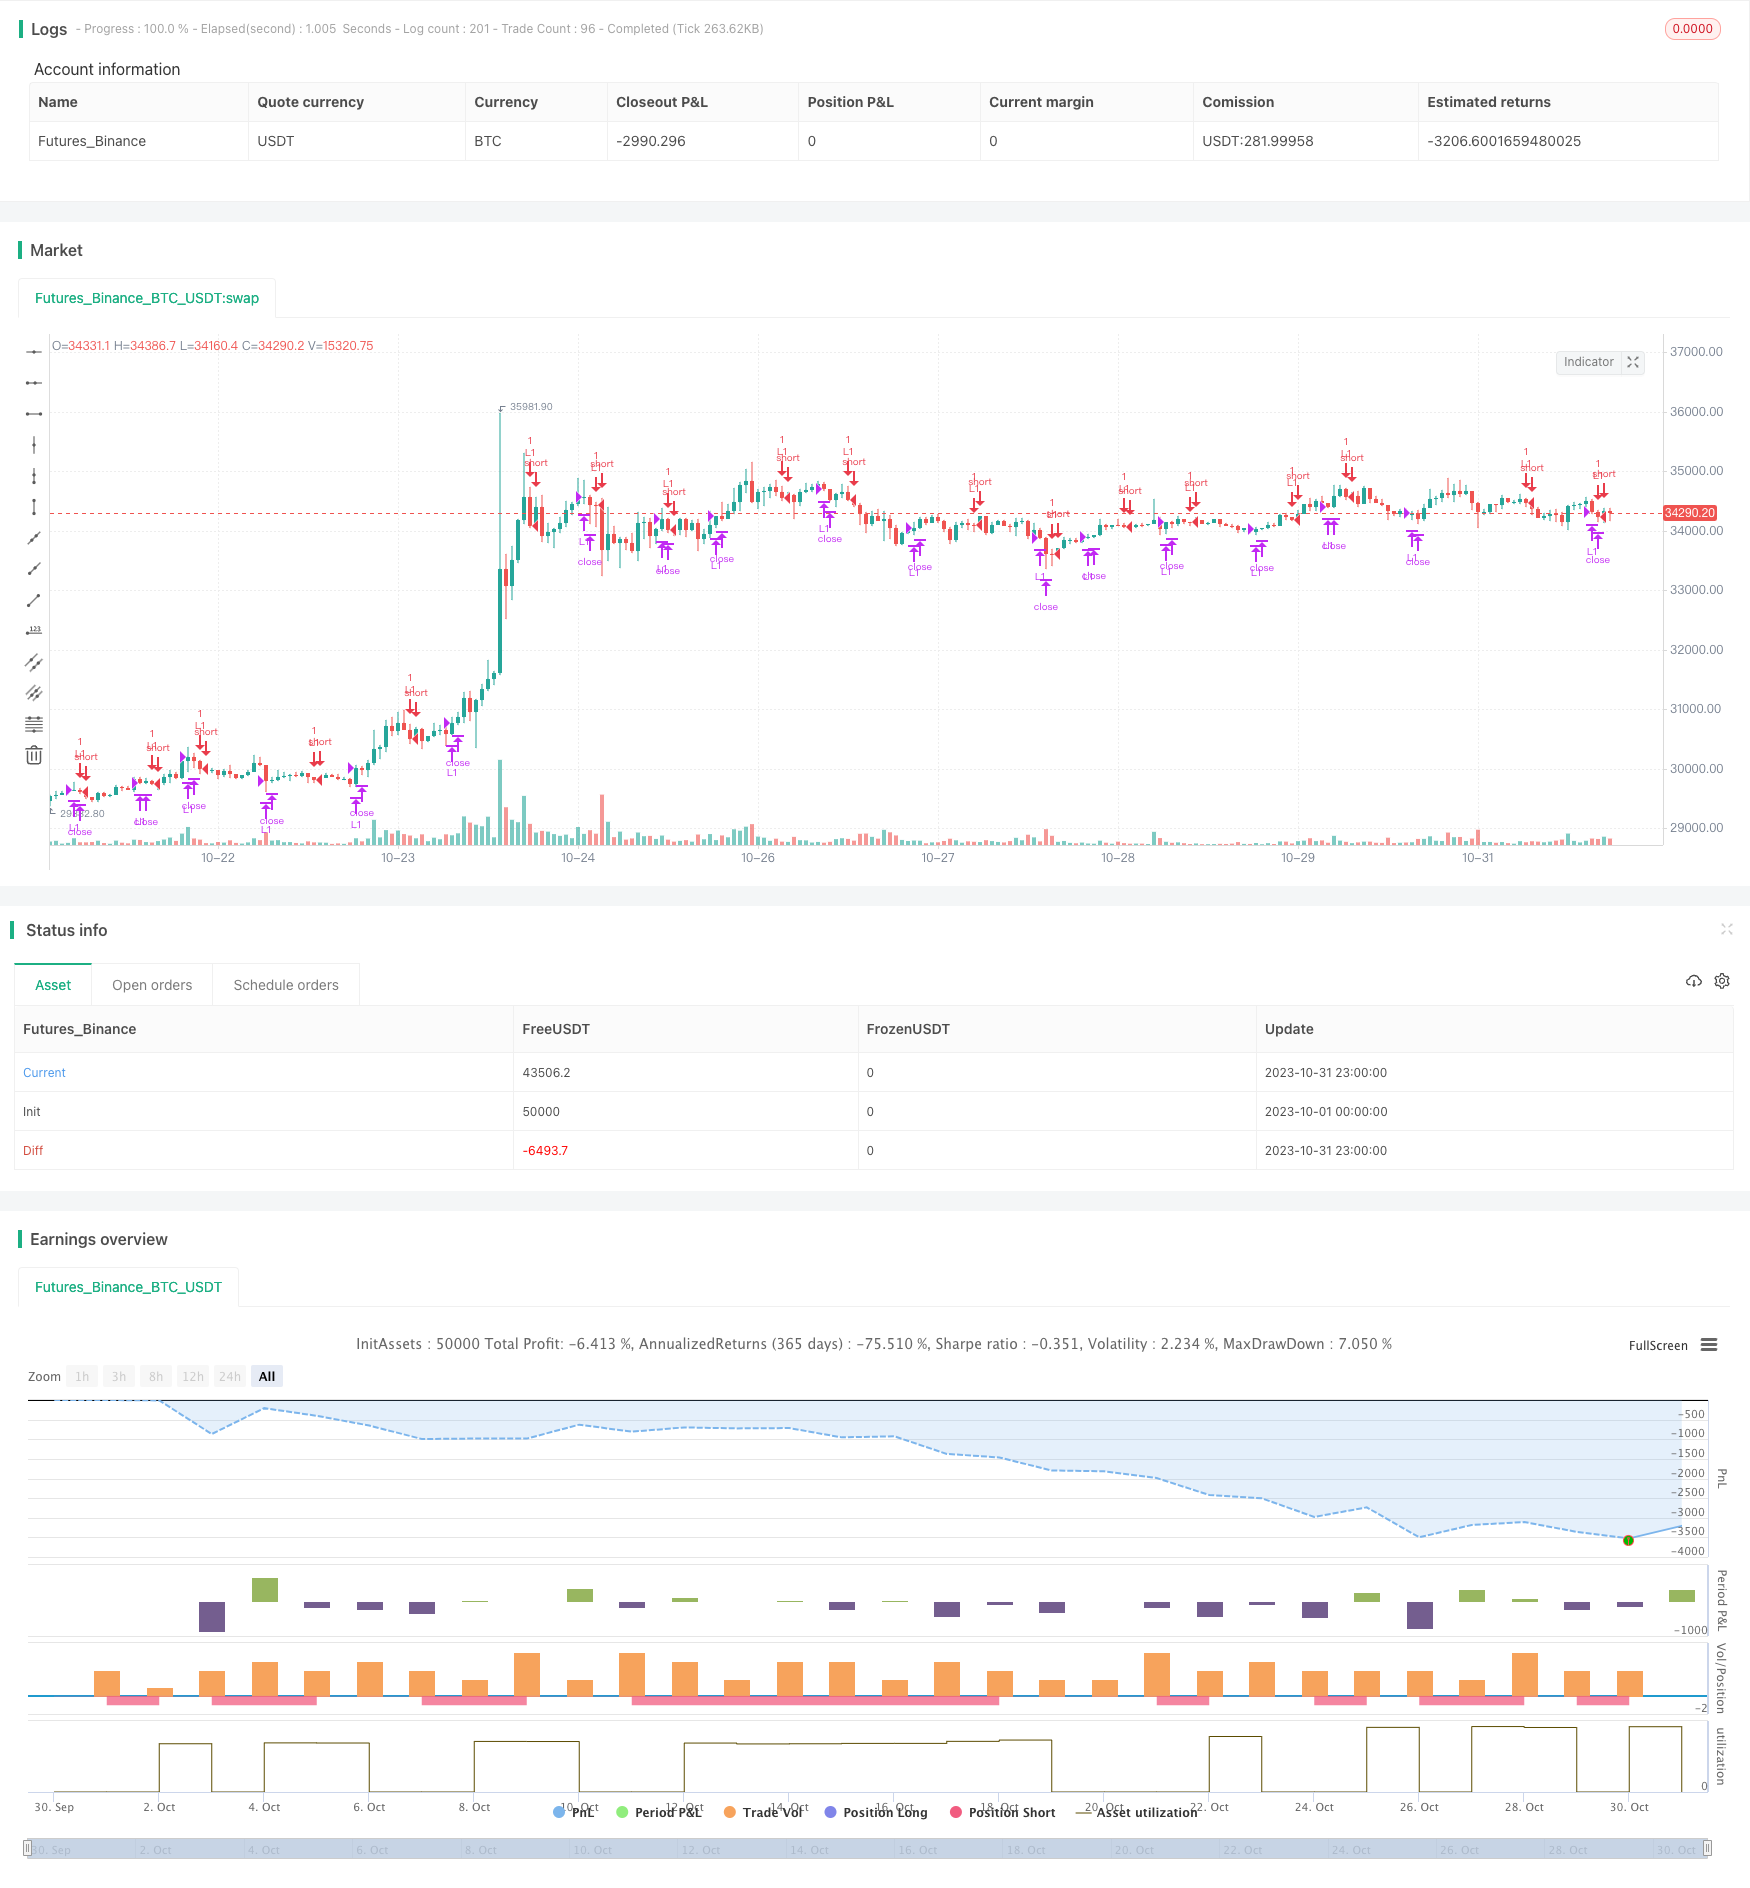
Name
动量突破均线策略Momentum-Breakout-Mean-Reversion-Strategy
Author
ChaoZhang
Strategy Description
该策略是一个基于动量突破和均线的短线交易策略。它结合了移动平均线、K线形态、交易量和波动性等多个指标,识别具有突破动能的方向性机会,以捕捉较短线的趋势行情。
-
使用3日EMA作为参考均线,当收盘价跌破该均线时,视为市场处于下跌趋势(Cond01)。
-
开盘价高于前一日的OHLC价格(开盘价、最高价、最低价、收盘价的平均价),表示有买盘成交推高开盘价,是上涨信号(Cond02)。
-
volume小于前一日volume,表示动量不足,利于方向性突破(Cond03)。
-
收盘价突破前一日的价格区间,表明有突破(Cond04)。
-
当上述4个条件同时满足时,做多开仓(Entries)。
-
止损条件:开仓超过10根K线或已获利平仓达到5次时,平仓(Exits)。
该策略综合多个指标判断市场突破方向,在短期内捕捉价格趋势,具有较强的方向性。但每个条件仅考虑1到3根K线的信息,对于长期趋势判断能力较弱。
-
使用多个指标综合判断,可以过滤假突破,识别有效突破。
-
动量不足利于价格产生方向性突破和趋势爆发,可以捕捉比较明确的方向性机会。
-
交易次数较多,适合短线操作,可以快速锁定每次小 profits。
-
止损和止盈设置合理,可以有效控制单笔损失和风险。
-
多条持仓同时打开,存在加仓风险。
-
单一指标参数设置可能过于死板,可引入自适应参数。
-
突破失败概率存在,可能形成破净。
-
仅关注短期信息,对大趋势把握不足。
-
停损点过近,可放宽至20至30根K线。
-
加入趋势判断,避免逆势开仓。可以考虑加入长期均线判定,只在大趋势方向打开仓位。
-
优化参数设置。可以对EMA周期、突破参数进行测试和优化,使之更符合不同市场状态。也可以设置自适应参数,让指标自动调整周期等。
-
条件优化。可以考虑添加其他辅助指标,如能量潮、布林带宽度、RSI等,来验证突破的有效性,减少假突破。
-
充分测试,检查极端行情下收益曲线。可以对过去行情进行回测,检验策略在特大涨跌、震荡等极端行情中的表现。
-
优化止损机制。可以考虑追踪止损、百分比止损、自适应止损等方式,让止损更具弹性。
该策略整合EMA、交易量、波动性等多个指标,识别短期内具有突破动能的机会,属于典型的短线突破策略。它回报频繁、运作敏捷,能快速锁定短线利润。但仅关注近期信息,对大行情把握不足。我们可以从加入趋势因素、优化参数设置、提高突破有效性、检验极端行情等方面进行优化,使策略更稳健、适应性更强。
||
This is a short-term trading strategy based on momentum breakout and mean reversion. It incorporates multiple indicators including moving average, candlestick patterns, volume and volatility to identify directional opportunities with breakout momentum for catching shorter-term trends.
-
Use 3-day EMA as the reference moving average line. When close price breaks below this line, it signals a downtrend in the market (Cond01).
-
Open price is higher than the previous day's OHLC price (average of open, high, low and close prices). This indicates strong buying interest at the open, which is a bullish signal (Cond02).
-
Volume is lower than previous day's volume. This shows insufficient momentum, which favors a directional breakout (Cond03).
-
Close price breaks out of the previous day's price range. This signals a breakout (Cond04).
-
When all the above 4 conditions are met, go long (Entries).
-
Exit rules: close position if bars since entry exceeds 10 or max profit closes reaches 5 (Exits).
This strategy combines multiple indicators to determine market breakout direction for capturing short-term trends. But each condition only looks at 1-3 bars, with weak capabilities in determining long-term trends.
-
Using multiple indicators helps filter false breakouts and identify valid breakouts.
-
Insufficient momentum favors directional breakout and trend ignition, allowing catching clearer directional opportunities.
-
High trading frequency suits short-term trading for locking quick small profits.
-
Reasonable stop loss and take profit allows effective single trade loss and risk control.
-
Multiple concurrent open trades pose risks of over-trading.
-
Static parameter settings could be too rigid. Adaptive parameters can be introduced.
-
Probability of failed breakouts exist, which may lead to losing trades.
-
Focus only on short-term information without comprehensive understanding of major trends.
-
Stop loss point might be too tight. Can consider widening to 20-30 bars.
-
Incorporate trend determination to avoid trading against major trends. Long-term moving averages can be added to only take trades along the major trend direction.
-
Optimize parameter settings. EMA period, breakout parameters can be tested and optimized to suit different market conditions. Adaptive parameters can also be used for automatic adjustments.
-
Improve conditions. Other auxiliary indicators like A/D, Bollinger Band Width, RSI can be added to verify breakout validity and reduce false breakouts.
-
Backtest extensively, inspect performance under extreme market conditions. Test on historical data to examine strategy performance under huge ups and downs, choppy markets, etc.
-
Optimize stop loss mechanisms. Consider trailing stop loss, percentage stop loss, adaptive stop loss etc. to make stops more flexible.
This strategy integrates EMA, volume, volatility and other indicators to identify short-term opportunities with momentum. It is a typical short-term breakout strategy with frequent returns and agile operations for locking quick profits. But it focuses too much on recent information without comprehensive understanding of major trends. We can optimize it by incorporating trend factors, optimizing parameters, improving breakout validity, testing extreme conditions to make the strategy more robust and adaptive.
[/trans]
Strategy Arguments
| Argument | Default | Description |
|---|---|---|
| v_input_1 | true | Quantity |
| v_input_2 | 3 | EMA Period |
| v_input_3 | 5 | Max Profit Close |
| v_input_4 | 10 | Max Total Bars |
Source (PineScript)
/*backtest
start: 2023-10-01 00:00:00
end: 2023-10-31 23:59:59
period: 1h
basePeriod: 15m
exchanges: [{"eid":"Futures_Binance","currency":"BTC_USDT"}]
*/

//@version=3
strategy("Free Strategy #01 (ES / SPY)", overlay=true)

// Inputs
Quantity = input(1, minval=1, title="Quantity")
EmaPeriod = input(3, minval=1, title="EMA Period")
MaxProfitCloses = input(5, minval=1, title="Max Profit Close")
MaxBars = input(10, minval=1, title="Max Total Bars")

// Misc Variables
src = close
BarsSinceEntry = 0
MaxProfitCount = 0
Ema = ema(close, EmaPeriod)
OHLC = (open + high + low + close) / 4.0

// Conditions
Cond00 = strategy.position_size == 0
Cond01 = close < Ema
Cond02 = open > OHLC
Cond03 = volume <= volume[1]
Cond04 = (close < min(open[1], close[1]) or close > max(open[1], close[1]))

// Update Exit Variables
BarsSinceEntry := Cond00 ? 0 : nz(BarsSinceEntry[1]) + 1
MaxProfitCount := Cond00 ? 0 : (close > strategy.position_avg_price and BarsSinceEntry > 1) ? nz(MaxProfitCount[1]) + 1 : nz(MaxProfitCount[1])

// Entries
strategy.entry(id="L1", long=true, qty=Quantity, when=(Cond00 and Cond01 and Cond02 and Cond03 and Cond04))

// Exits
strategy.close("L1", (BarsSinceEntry - 1 >= MaxBars or MaxProfitCount >= MaxProfitCloses))
Detail
https://www.fmz.com/strategy/432303
Last Modified
2023-11-16 10:47:41
