Name
动量趋势跟踪策略Momentum-Trend-Following-Strategy
Author
ChaoZhang
Strategy Description
[trans]
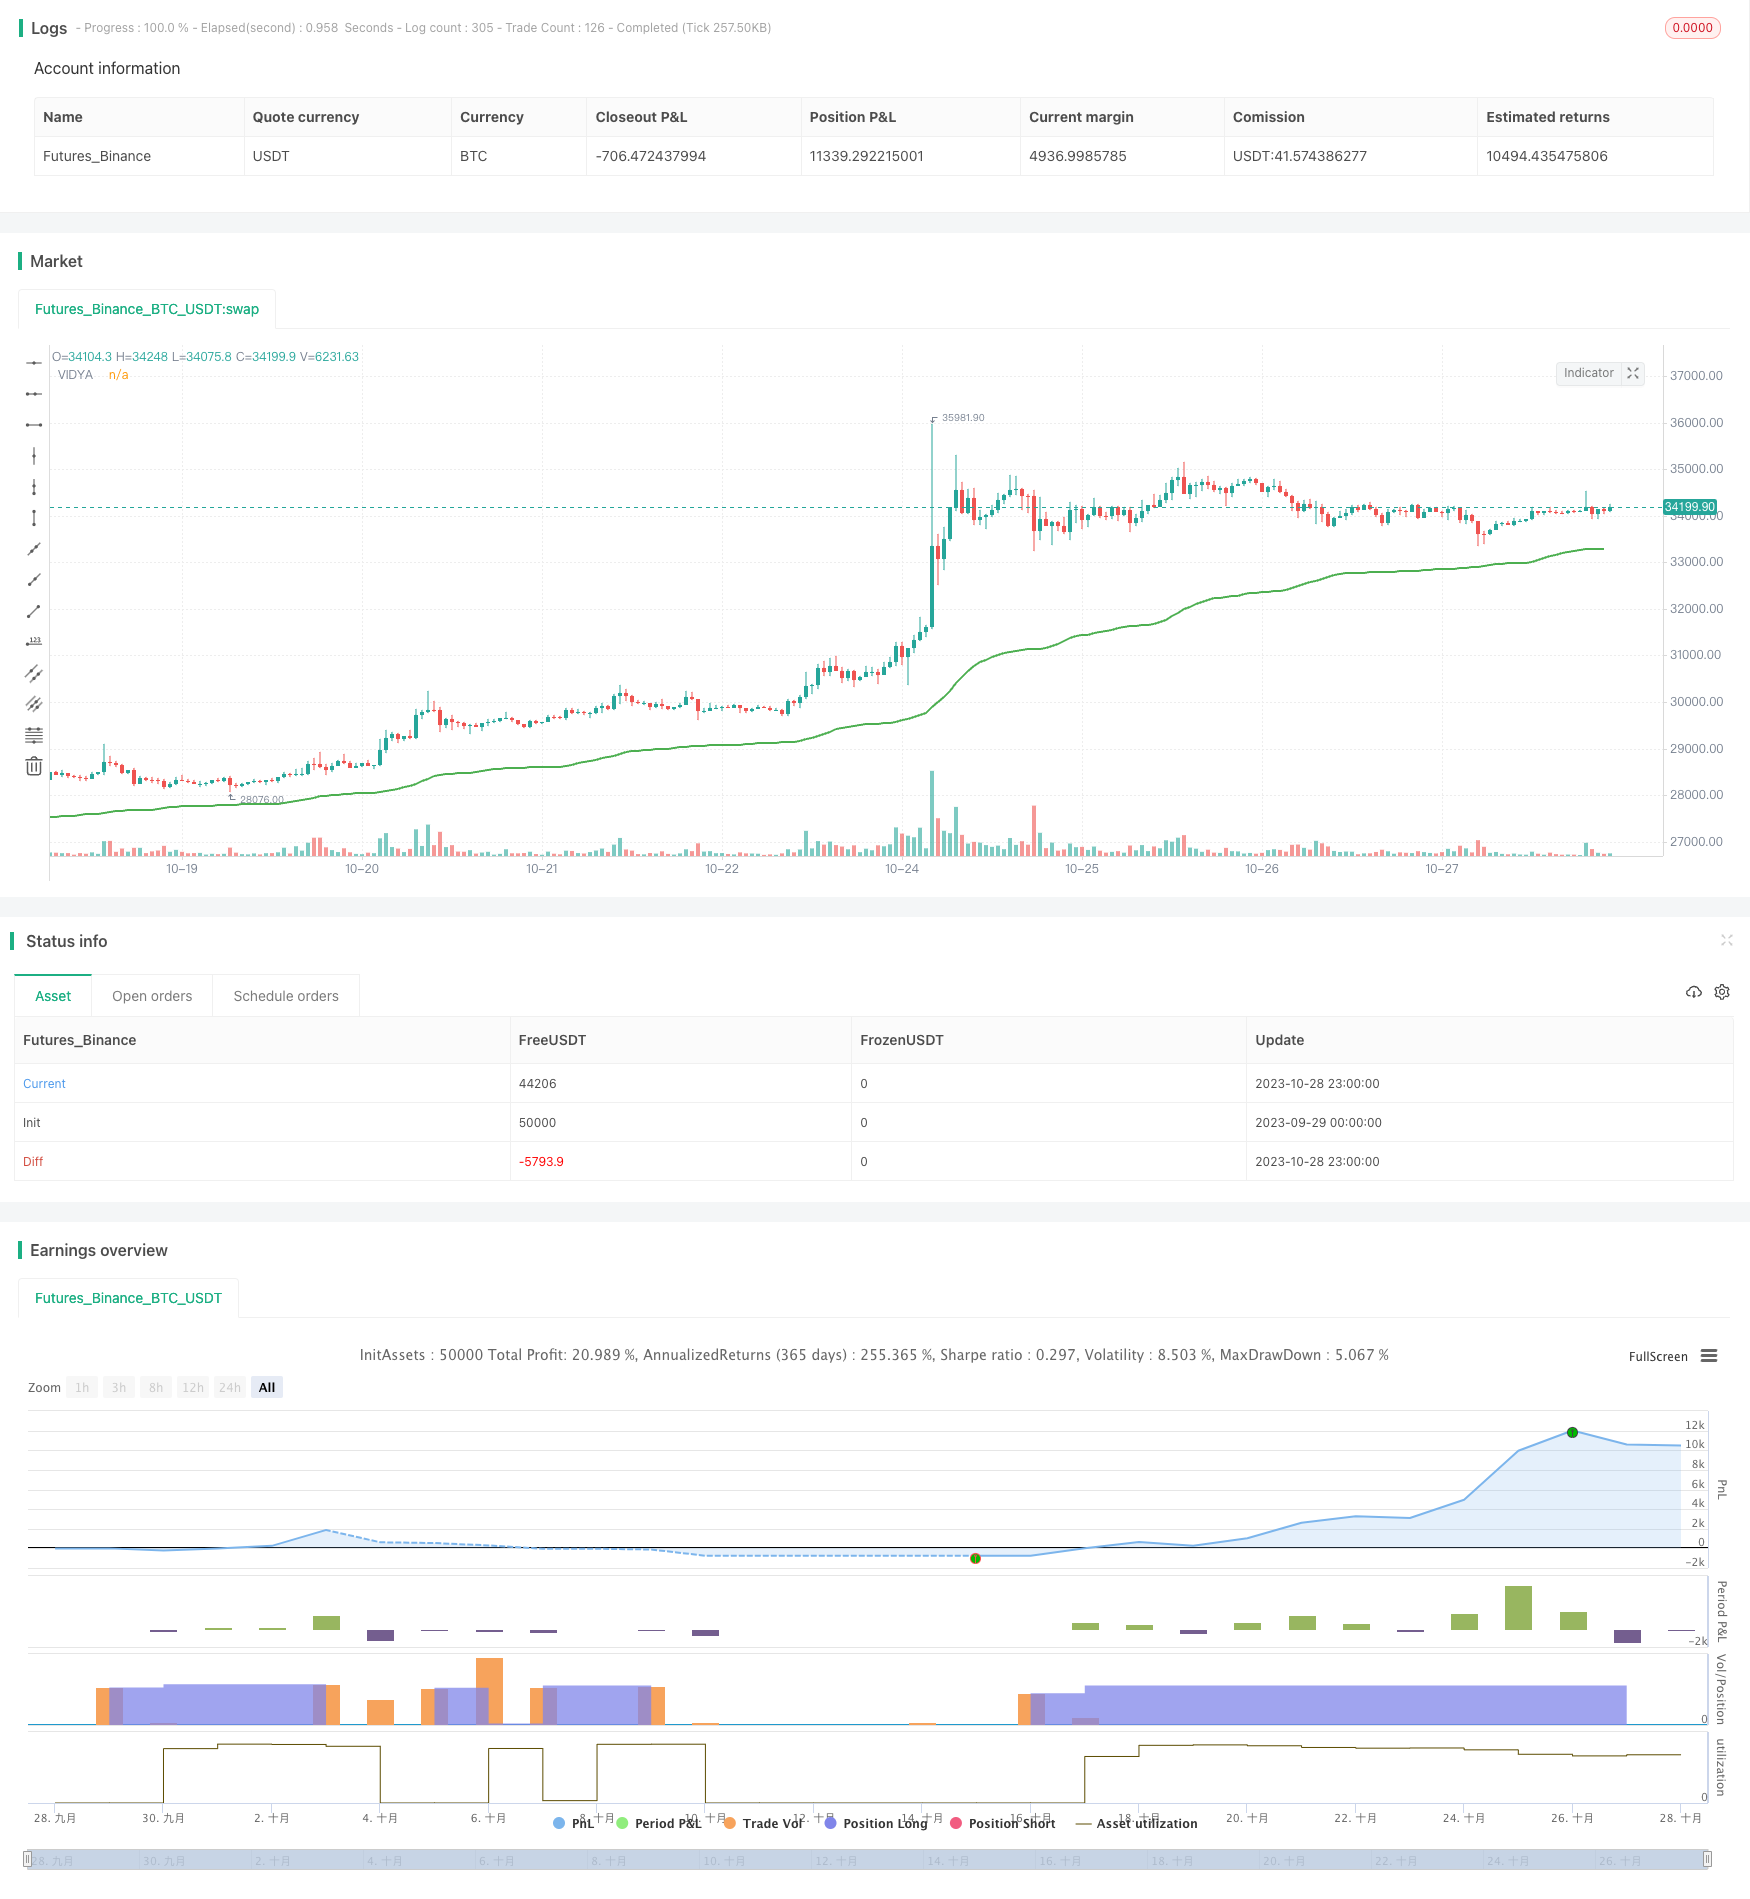
这个策略使用VIDYA(变量指数移动平均线)指标来识别加密货币市场的趋势方向,并以趋势为基础进行交易。它是一个量化的技术交易策略。
该策略首先计算VIDYA指标。VIDYA指标基于价格变化的动量,可以更快速地响应趋势变化。具体来说,它结合了Chande Momentum Oscillator(CMO)和简单移动平均线(SMA)。CMO衡量价格上涨动量和下跌动量之差,来判断趋势力度。SMA对价格进行平滑化处理。VIDYA根据CMO的值,动态调整SMA的权重,在趋势变化早期给予CMO更大权重,在趋势形成后给予SMA更大权重。这样,VIDYA可以快速响应趋势变化,同时也保持对趋势的平滑跟踪。
在计算出VIDYA后,策略以其曲线的方向判断趋势方向。当VIDYA上涨时,做多;当VIDYA下跌时,平仓。
-
VIDYA指标响应迅速,可以提早捕捉到趋势的转变,相比SMA等传统指标更有优势。
-
结合了趋势力度和趋势方向判断,可以有效区分强弱趋势,避免被震荡市场的假趋势误导。
-
只根据单一VIDYA指标判断,实现了策略的简单性。不会产生指标的冲突和误导。
-
采用长期VIDYA设置可以跟踪长期趋势,有利于把握主要趋势方向。
-
策略回测表现良好,具有正的期望收益。
-
VIDYA对市场突发事件反应可能滞后,无法立刻抓住短期交易机会。
-
长期VIDYA设置对短期趋势变化不敏感,可能中间出现较大的回撤。
-
纯粹的趋势跟踪策略,在震荡行情下表现不佳。可结合附加过滤条件提高表现。
-
回测数据不足,无法完全验证策略稳健性。实际交易中,参数需要反复优化测试。
-
加密货币市场波动大,须谨慎控制仓位规模和止损条件,严格风险管理。
-
测试添加量价指标或波动率指标,提高对趋势变化的识别灵敏度。
-
测试VIDYA与其他趋势指标的组合,形成指标集聚效应。
-
优化止损策略,在趋势反转时尽早止损。
-
优化仓位管理策略,根据市场情况动态调整仓位。
-
测试在不同的加密货币品种和周期参数下的稳健性。
该策略整体是一个量化的趋势跟踪策略。它使用VIDYA指标判断趋势方向,简单有效地把握了加密货币的长期趋势行情。但也存在一些局限性,需要对止损、仓位管理等方面进行进一步优化,才能使策略更稳健和实盘可行。总体来说,它为搭建加密货币趋势策略提供了一个基础框架和思路,但实际应用中还需谨慎评估。
||
This strategy uses the VIDYA (Variable Index Dynamic Average) indicator to identify the trend direction in cryptocurrency markets and trades based on the trend. It is a quantitative technical trading strategy.
The strategy first calculates the VIDYA indicator. The VIDYA indicator is based on price momentum and can respond to trend changes faster. Specifically, it combines the Chande Momentum Oscillator (CMO) and Simple Moving Average (SMA). CMO measures the difference between upward and downward momentum to gauge trend strength. SMA smoothes price data. VIDYA dynamically adjusts the weighting of SMA based on CMO values, giving more weight to CMO early in trend changes and more weight to SMA once the trend is established. Thus, VIDYA can quickly respond to trend changes while also maintaining a smooth tracking of the trend.
After calculating VIDYA, the strategy judges the trend direction based on the curve of VIDYA. It goes long when VIDYA rises and closes position when VIDYA falls.
-
VIDYA responds swiftly and can capture trend changes early compared to traditional indicators like SMA.
-
Combining trend strength and direction, it can effectively distinguish strong and weak trends and avoid false trends in ranging markets.
-
Relying solely on VIDYA makes the strategy simple. No conflicting or misleading signals from multiple indicators.
-
Longer VIDYA settings allow tracking long-term trends and capturing the main trend direction.
-
Good backtest results with positive expected returns.
-
VIDYA may lag in response to sudden market events and miss short-term trading opportunities.
-
Long VIDYA settings make it less sensitive to short-term trend changes and can lead to larger drawdowns.
-
Pure trend following performs poorly in choppy markets. Additional filters can improve performance.
-
Limited backtest data cannot fully verify robustness. Parameters need iterative optimization and testing in live trading.
-
High volatility in crypto markets. Position sizing and stop loss should be carefully controlled for strict risk management.
-
Test adding volume or volatility indicators to improve sensitivity to trend changes.
-
Try combining VIDYA with other trend indicators for ensemble effect.
-
Optimize stop loss strategy to exit early when trend reverses.
-
Optimize position sizing dynamically based on market conditions.
-
Test robustness across different cryptocurrencies and timeframes.
Overall this is a quantitative trend following strategy. It uses the VIDYA indicator to determine trend direction, capturing crypto trends simply and effectively. But it also has some limitations that require further optimizations in stop loss, position sizing etc. to make the strategy more robust and practically viable. In general, it provides a basic framework and approach for building crypto trend strategies, but prudent assessments are still needed for real-world applications.
[/trans]
Strategy Arguments
| Argument | Default | Description |
|---|---|---|
| v_input_1 | timestamp(01 Jan 2000 08:00) | (?Date Range)Start Time |
| v_input_2 | timestamp(01 Jan 2099 00:00) | End Time |
| v_input_int_1 | 50 | (?Trend Settings)VIDYA Length |
| v_input_source_1_ohlc4 | 0 | VIDYA Price Source: ohlc4 |
Source (PineScript)
/*backtest
start: 2023-09-29 00:00:00
end: 2023-10-29 00:00:00
period: 1h
basePeriod: 15m
exchanges: [{"eid":"Futures_Binance","currency":"BTC_USDT"}]
*/

// This source code is subject to the terms of the Mozilla Public License 2.0 at https://mozilla.org/MPL/2.0/
// @version=5
// Author = TradeAutomation


strategy(title="VIDYA Trend Strategy", shorttitle="VIDYA Trend Strategy", process_orders_on_close=true, overlay=true, pyramiding=25,  commission_type=strategy.commission.percent, commission_value=.075, slippage = 1, initial_capital = 1000000, default_qty_type=strategy.percent_of_equity, default_qty_value=4)


// Backtest Date Range Inputs //
StartTime = input(defval=timestamp('01 Jan 2000 08:00'), group="Date Range", title='Start Time')
EndTime = input(defval=timestamp('01 Jan 2099 00:00'), group="Date Range", title='End Time')
InDateRange = true

// Strategy Inputs //
len = input.int(title="VIDYA Length", defval=50, step=5,group="Trend Settings")
src = input.source(title="VIDYA Price Source",defval=ohlc4, group="Trend Settings")

// VIDYA Calculations //
valpha=2/(len+1)
vud1=src>src[1] ? src-src[1] : 0
vdd1=src<src[1] ? src[1]-src : 0
vUD=math.sum(vud1,9)
vDD=math.sum(vdd1,9)
vCMO=nz((vUD-vDD)/(vUD+vDD))
var VIDYA = 0.0
VIDYA := na(VIDYA[1]) ? ta.sma(src, len) : nz(valpha*math.abs(vCMO)*src)+(1-valpha*math.abs(vCMO))*nz(VIDYA[1])
plot(VIDYA, title="VIDYA",color=(VIDYA > VIDYA[1]) ? color.green : (VIDYA<VIDYA[1]) ? color.red : (VIDYA==VIDYA[1]) ? color.gray : color.black, linewidth=2)

// Entry & Exit Signals //
if (InDateRange)
    strategy.entry("Long", strategy.long, when = VIDYA>VIDYA[1])
    strategy.close("Long", when = VIDYA<VIDYA[1])
if (not InDateRange)
    strategy.close_all()
Detail
https://www.fmz.com/strategy/430552
Last Modified
2023-10-30 11:36:26
