Name
动量震荡交易策略Momentum-Oscillation-Trading-Strategy
Author
ChaoZhang
Strategy Description
[trans]
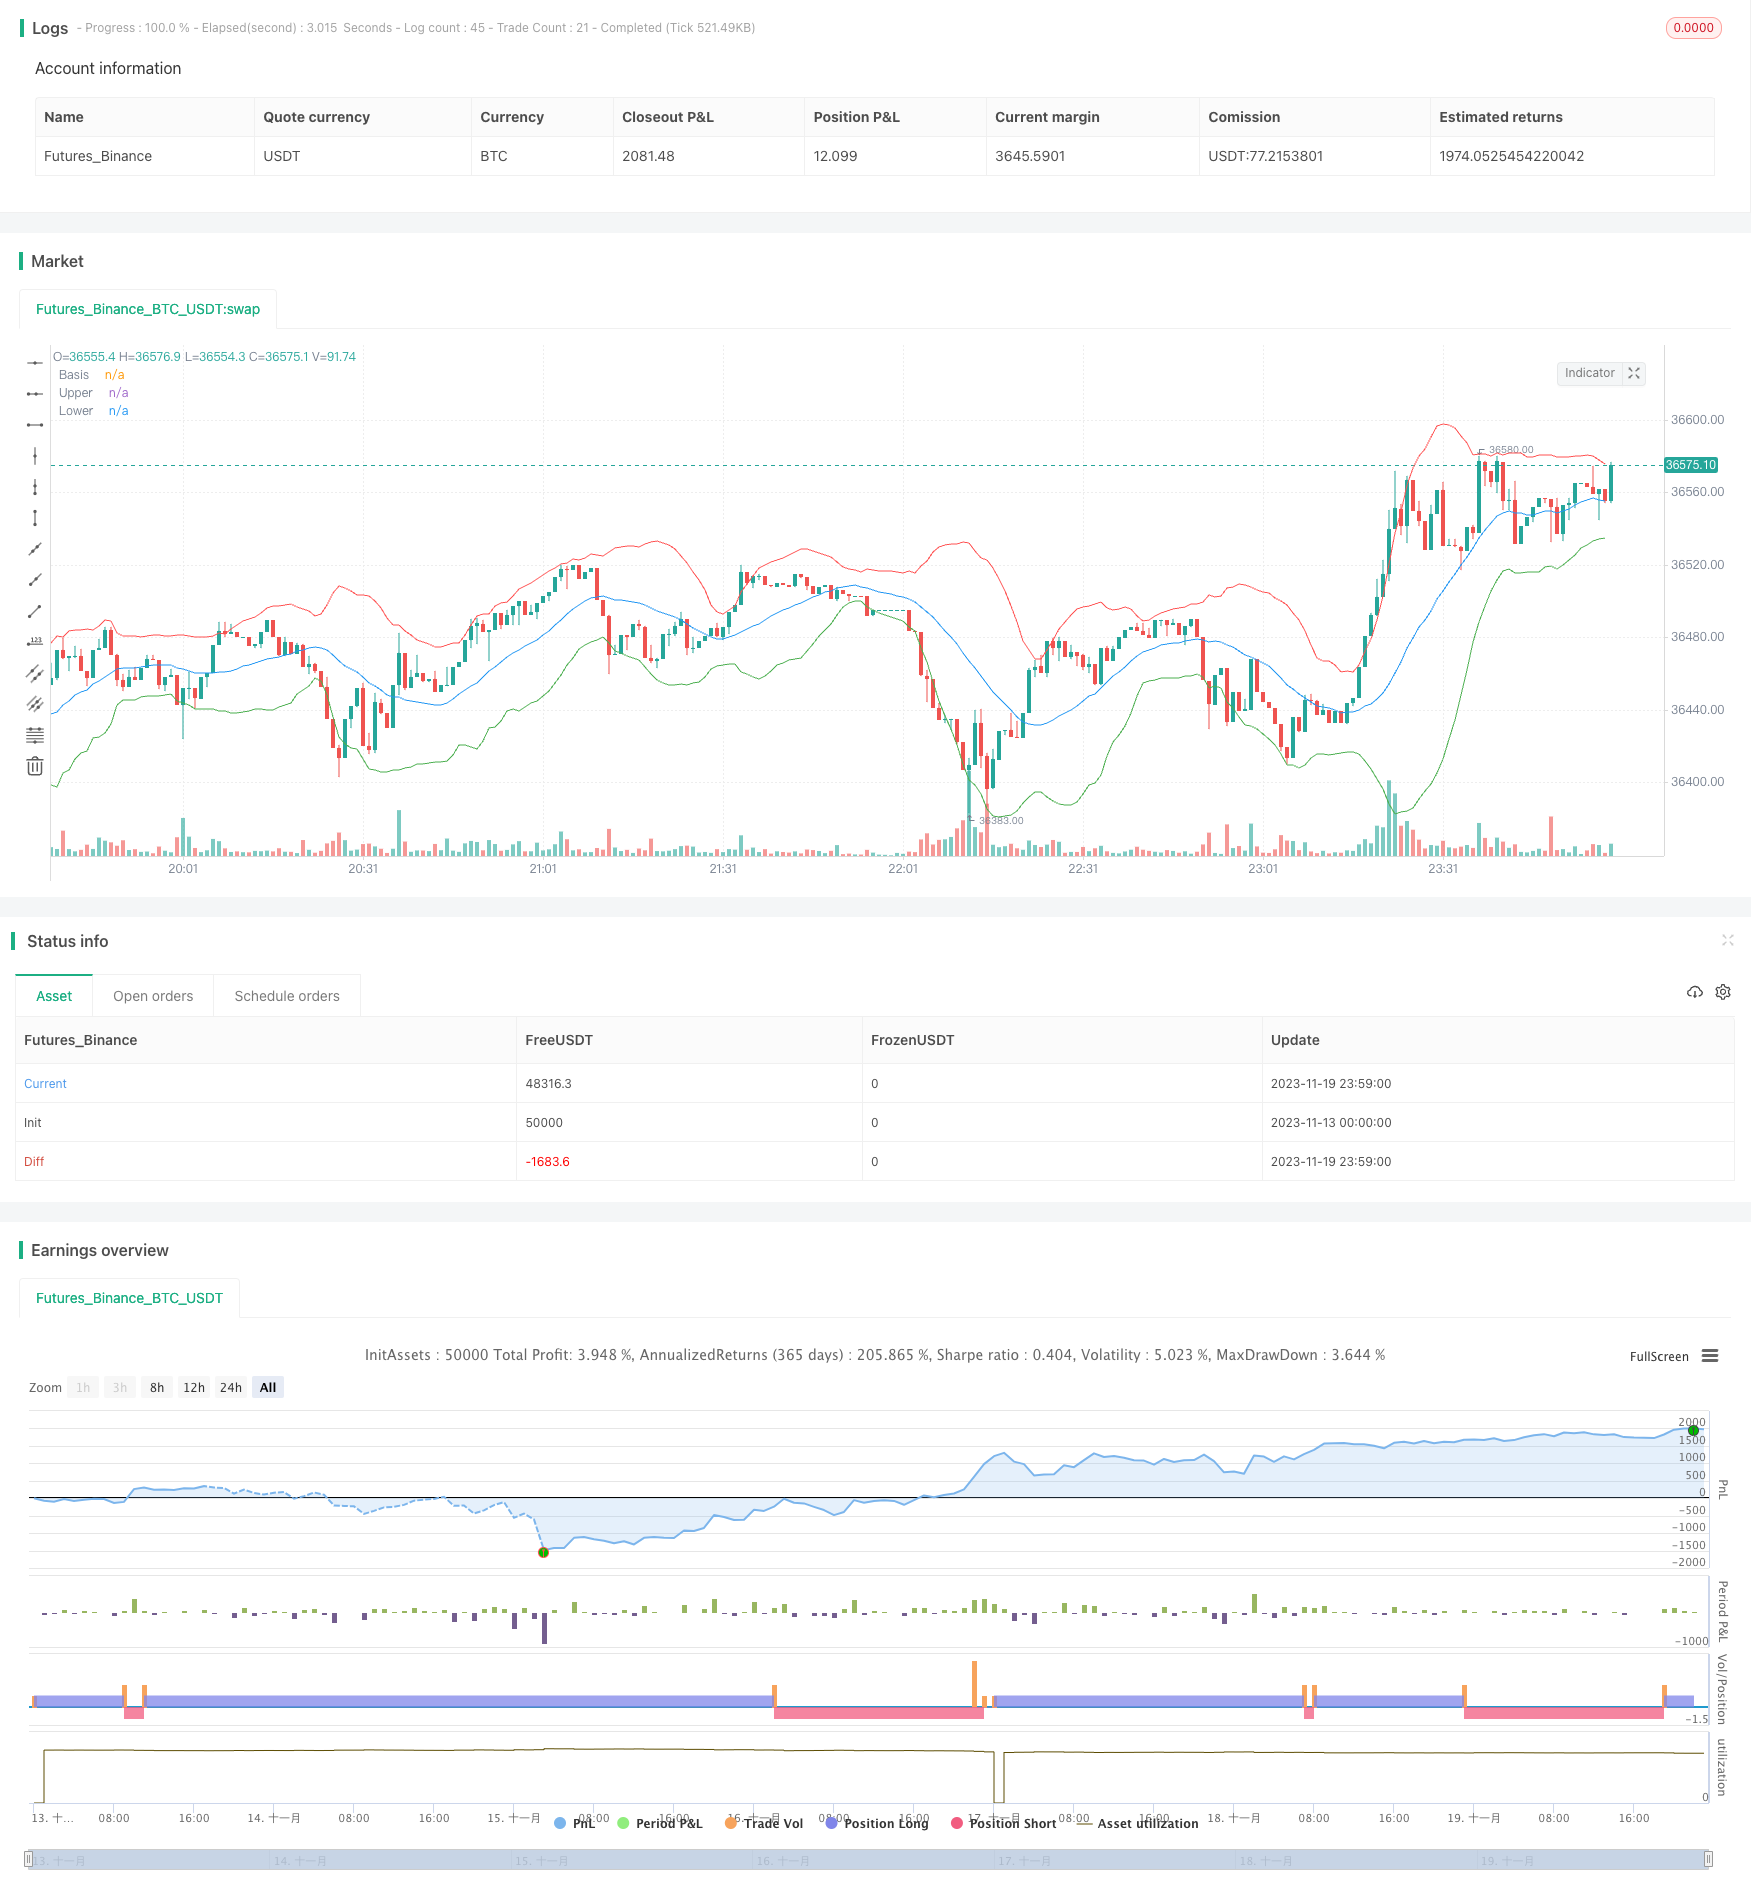
本策略基于布林带指标,结合动量指标,实现布林带回归和动量突破的组合交易策略。当价格从布林带下方突破中线时做多,当价格从布林带上方突破中线时做空,并追踪止损止盈情况,在达到目标盈亏比后平仓。
本策略使用布林带中线sma作为均线指标,带宽通过参数mult*stdev动态调整。当价格从下方突破中线时,说明价格获取上行动量,这时做多;当价格从上方突破中线时,说明价格获取下行动量,这时做空。做多做空后设置止盈止损参数,用于追踪利润和控制风险。
具体来说,布林带的计算通过length和mult两个参数完成,长度length决定中线的周期,mult决定带宽的大小。enterLong和enterShort判断突破的时机,exitLong和exitShort根据入场价格和目标止盈止损比例计算止损止盈价格。
本策略结合了均线回归和动量指标,能够在趋势开始阶段顺势捕捉较大行情。与简单跟踪均线相比,增加了基于布林带宽度的动量判断,可以过滤掉部分假突破。止盈止损设置直接基于入场价格计算,无需人工干预。
- 布林带拟合价格时存在滞后,可能错过部分行情
- 止损设置过于宽松会增加亏损风险
- 多头行情中做空的信号可能获取不佳
可以通过调整布林中线周期、带宽参数以及止损范围来优化,使得策略更加适应不同市场情况。
- 加入交易量或波动率指标,避免低量的假突破
- param分批优化布林周期长度、宽度系数、止损幅度
- 在特定市场阶段只做多或只做空
- 加入机器学习模型判定趋势方向
本策略整合布林带回归和动量指标的优点,可以在趋势开始的时候顺势捕捉部分行情,通过参数调整可以适应不同阶段市场,是一种较为通用的突破系统。止盈止损设置直接从价格计算可以减少人工干预。本策略也存在一些改进空间,例如加入更多辅助判决指标等,这些将在后续的研究和优化中进一步完善。 ||
This strategy is based on the Bollinger Bands indicator, combined with momentum indicators to implement a combination trading strategy of Bollinger Bands reversion and momentum breakout. It goes long when the price breaks through the middle line of the Bollinger Bands from below and goes short when the price breaks through the middle line from above. It also tracks stop loss and take profit based on entry price to close positions when target risk-reward ratio is met.
The strategy uses Bollinger Bands middle line sma as the moving average indicator, and dynamically adjusts the band width through param mult*stdev. When price breaks through the middle line from below, it indicates upward momentum is gained and thus goes long. When price breaks down through the middle line from above, it shows downward momentum is gained and thus goes short. After entering long/short positions, stop loss and take profit parameters are set to track profits and control risks.
Specifically, Bollinger Bands are calculated with two parameters - length and mult. Length determines the period of the middle line and mult decides the band width. enterLong and enterShort judge the breakout timing. exitLong and exitShort calculate stop loss and take profit prices based on entry price and target percentage.
This strategy combines reversion to the mean and momentum, which enables it to capture major trends early on. Compared to simply tracking moving averages, the added momentum judgment based on Bollinger Bands width can filter out some false breakouts. Stop loss and take profit are set directly based on entry price without manual intervention.
- Lagging in Bollinger Bands fitting prices, may miss some moves
- Stop loss set too wide may increase loss risks
- Short signals in bull market may not turn out well
Parameters like periods, band width and stop loss range can be optimized to make the strategy adaptable to different market conditions.
- Add trading volume or volatility to avoid low volume false breakouts
- Param grid search to optimize periods, width coefficient and stop loss percentage
- Go only long or short based on market regime
- Add Machine Learning model to determine trend direction
This strategy combines the strengths of Bollinger Bands reversion and momentum, which enables it to capture some trends early on. Through parameter tuning it can adapt to different market stages. The direct stop loss/take profit calculation reduces manual intervention. There is still room for improvement, e.g. incorporating more auxiliary indicators. These will be incrementally enhanced in further research and optimization.
[/trans]
Strategy Arguments
| Argument | Default | Description |
|---|---|---|
| v_input_1 | 20 | Length |
| v_input_2 | 2 | Multiplier |
| v_input_3 | 0.5 | Target Percent |
| v_input_4 | 95 | Stop Loss Percent |
Source (PineScript)
/*backtest
start: 2023-11-13 00:00:00
end: 2023-11-20 00:00:00
period: 1m
basePeriod: 1m
exchanges: [{"eid":"Futures_Binance","currency":"BTC_USDT"}]
*/

//@version=4
strategy("BURATINO", overlay=true)

// Входные параметры
length = input(20, minval=1, title="Length")
mult = input(2.0, minval=0.1, maxval=5, title="Multiplier")
target_percent = input(0.5, minval=0.1, title="Target Percent")
stop_loss_percent = input(95, minval=0.1, title="Stop Loss Percent")

// Расчет полос Боллинджера
basis = sma(close, length)
dev = mult * stdev(close, length)
upper = basis + dev
lower = basis - dev

// Переворот снизу вверх через среднюю линию Боллинджера для открытия лонга
enterLong = cross(close, basis) and close[1] < basis[1]

// Переворот сверху вниз через среднюю линию Боллинджера для открытия шорта
enterShort = cross(basis, close) and close[1] > basis[1]

// Закрытие лонга после роста цены на указанный процент или падения на указанный процент
exitLong = close >= strategy.position_avg_price * (1 + (target_percent / 100)) or close <= strategy.position_avg_price * (1 - (stop_loss_percent / 100))

// Закрытие шорта после падения цены на указанный процент или роста на указанный процент
exitShort = close <= strategy.position_avg_price * (1 - (target_percent / 100)) or close >= strategy.position_avg_price * (1 + (stop_loss_percent / 100))

// Управление позициями и ограничениями на открытие противоположных позиций
strategy.entry("Long", strategy.long, when = enterLong and strategy.position_size == 0)
strategy.entry("Short", strategy.short, when = enterShort and strategy.position_size == 0)

strategy.close("Long", when = exitLong)
strategy.close("Short", when = exitShort)

// Визуализация полос Боллинджера
plot(basis, color=color.blue, title="Basis")
plot(upper, color=color.red, title="Upper")
plot(lower, color=color.green, title="Lower")
Detail
https://www.fmz.com/strategy/432804
Last Modified
2023-11-21 16:57:20
