Name
动量顺势双策略Momentum-Trend-Dual-Strategy
Author
ChaoZhang
Strategy Description
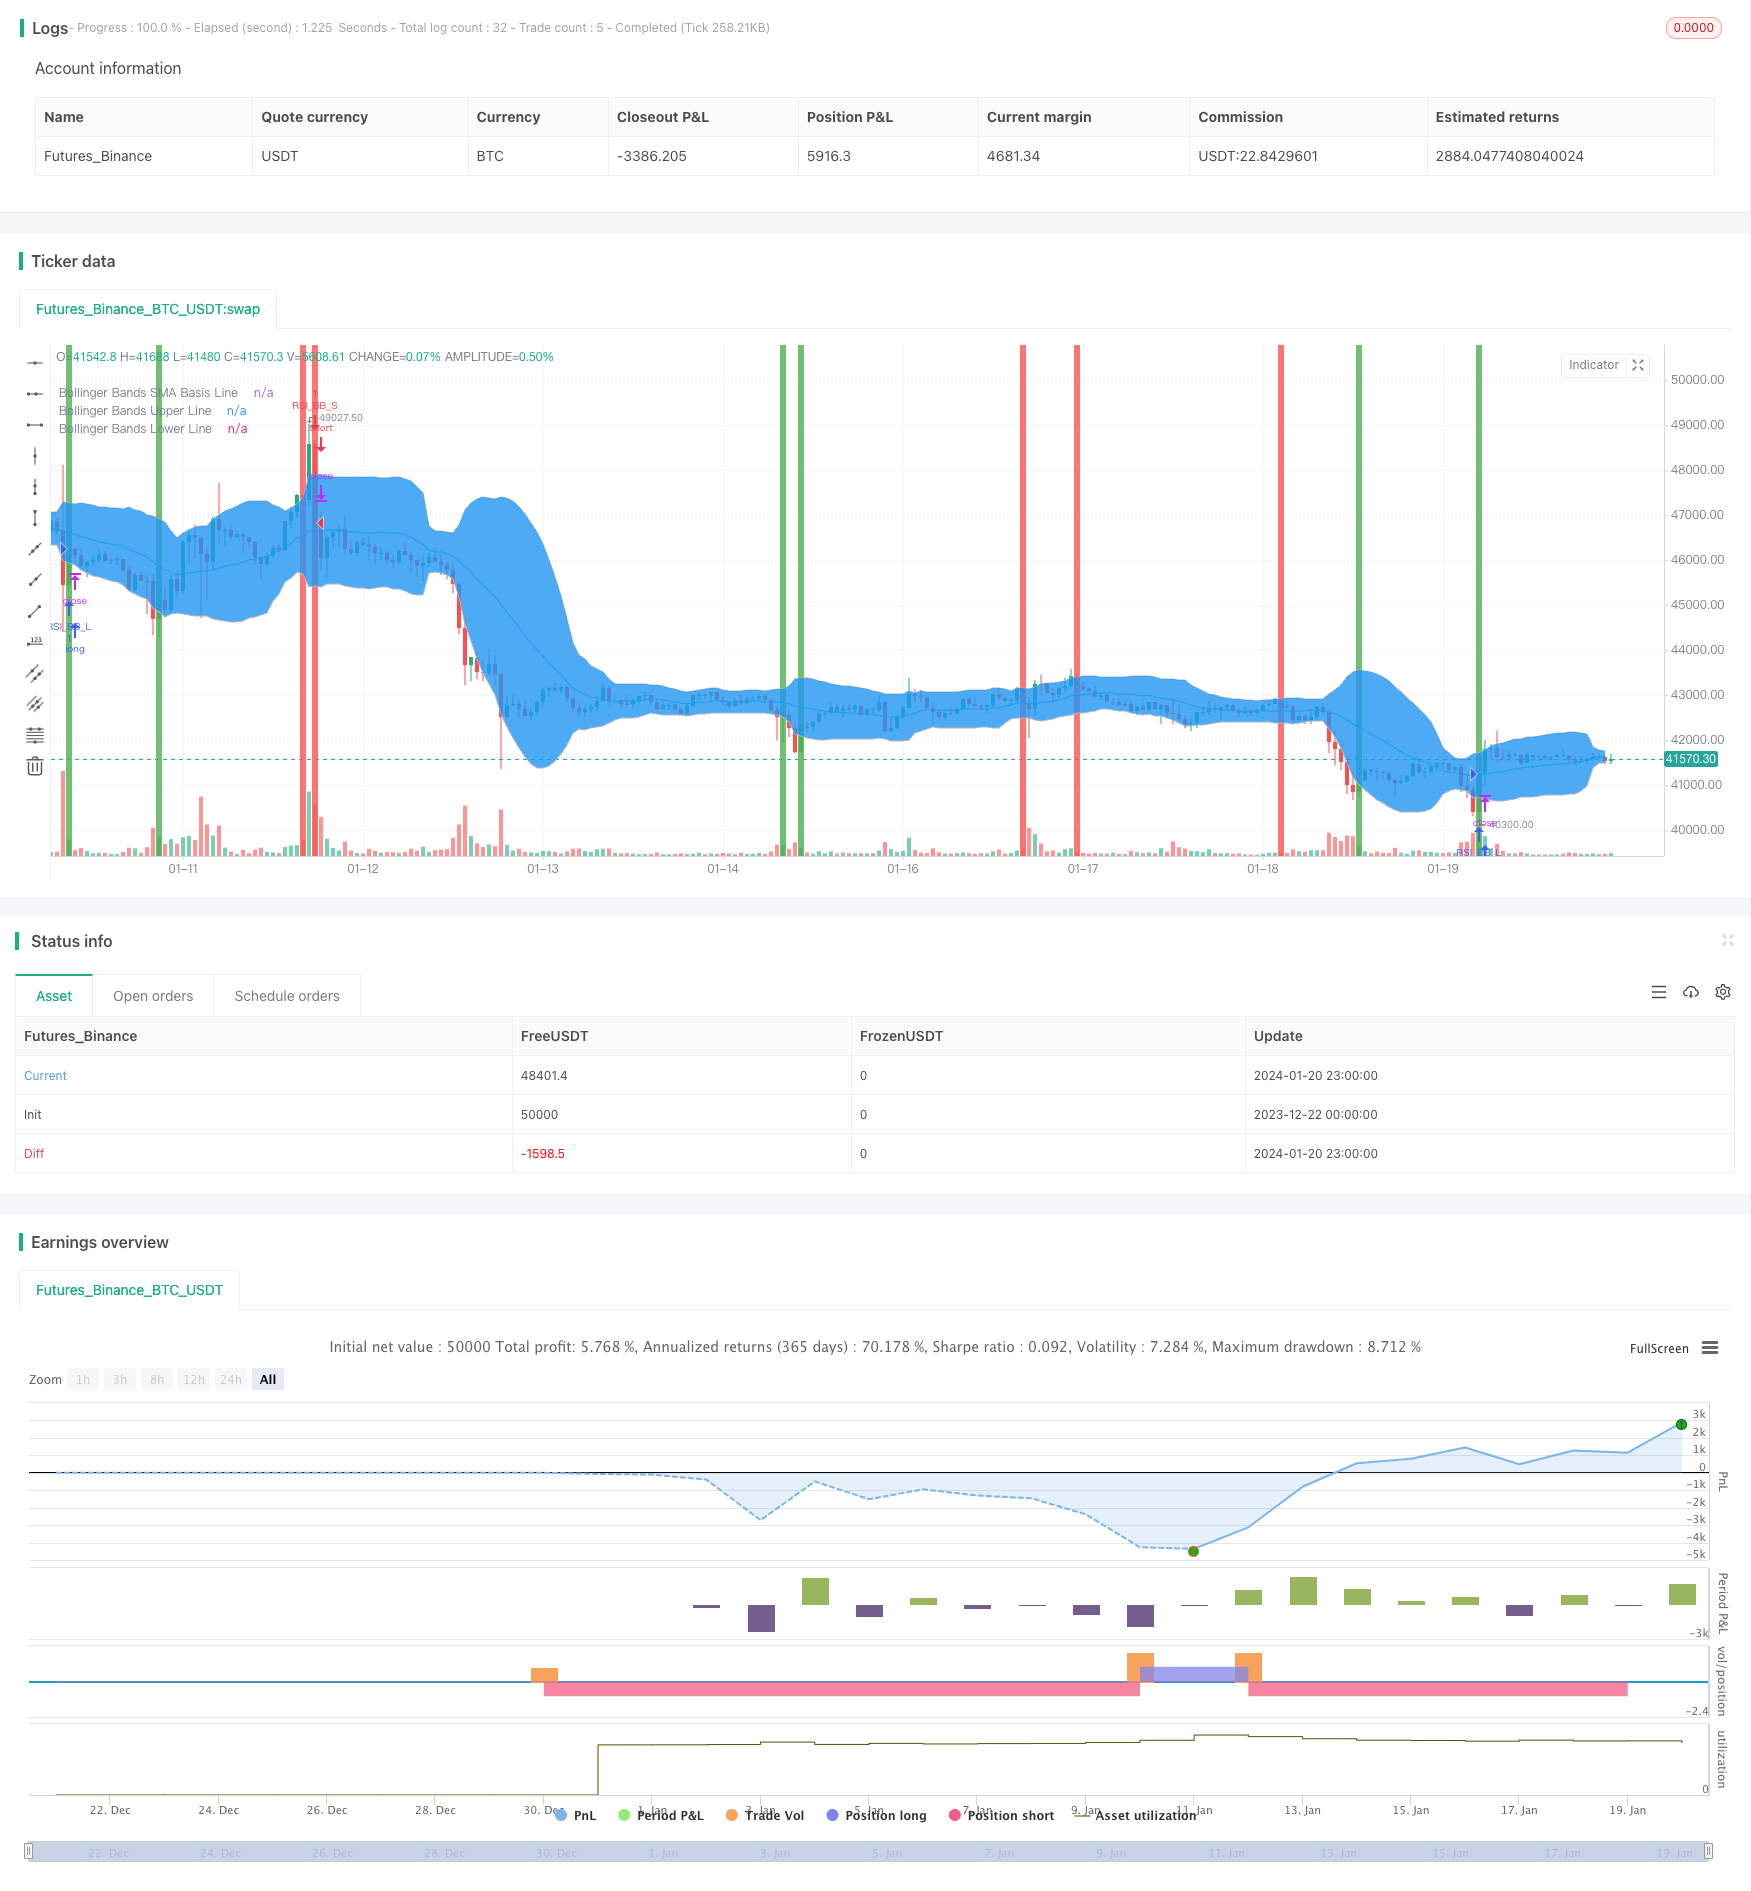
本策略结合了相对强弱指数(RSI)和布林带两个指标,实现了一个双重确认的开仓和平仓逻辑。当RSI和布林带同时显示超买或超卖信号时,该策略才会发出交易信号。这可以有效减少假信号,提高策略稳定性。
- RSI指标判断逻辑
- RSI上穿45时,视为超卖信号
- RSI下穿55时,视为超买信号
- 布林带判断逻辑
- 价格上穿布林带下轨时,视为超卖
- 价格下穿布林带上轨时,视为超买
- 双重确认逻辑
- 只有当RSI和布林带同时显示超卖信号时,才会开多仓
- 只有当RSI和布林带同时显示超买信号时,才会开空仓
以上逻辑实现了一个稳定的双重确认的开平仓策略。
-
双重确认机制,可以过滤掉大量噪音交易,避免不必要的交易次数,从而降低交易成本,提高盈利率。
-
RSI指标可以有效识别趋势和反转,布林带指标可以有效判断支持阻力。两者结合,形成完美的配合。
-
参数设置灵活,可以根据不同品种和交易偏好进行调整,适应性强。
-
在震荡行情中,RSI和布林带指标可能同时发出错误信号,导致不必要的亏损。可以通过优化参数来降低误判概率。
-
双重确认机制会略微提高入场延迟,可能会错过极短线的交易机会。不适合对延迟非常敏感的策略。
-
该策略对参数非常敏感,不适当的参数设置可能大幅降低收益率。需要充分的回测和复盘,找到最佳参数组合。
-
可以测试不同周期的RSI指标,找到最匹配的周期参数,提高指标效果。
-
可以加入止损逻辑,设置合理的移动止损或者固定止损,控制单笔亏损风险。
-
可以测试布林带通道宽度参数,优化通道范围,提高布林带的识别效果。
-
可以测试不同的价格输入,例如收盘价,最高价,最低价等,寻找最佳的价格输入来提升策略稳定性。
本策略成功结合RSI指标和布林带指标,实现双重确认逻辑,既保证了足够的交易机会,又能有效降低噪音交易。通过合理的参数优化和风险控制,该策略可以成为一个非常稳定可靠的趋势追踪和交易策略。
||
This strategy combines the Relative Strength Index (RSI) and Bollinger Bands indicators to implement a dual confirmation logic for entries and exits. It generates trading signals only when both RSI and Bollinger Bands show overbought or oversold signals at the same time. This can effectively reduce false signals and improve the stability of the strategy.
- RSI Judgment Logic
- RSI crossing above 45 is considered oversold signal
- RSI crossing below 55 is considered overbought signal
- Bollinger Bands Judgment Logic
- Price crossing above Bollinger Lower Band is considered oversold
- Price crossing below Bollinger Upper Band is considered overbought
- Dual Confirmation Logic
- Long position is opened only when both RSI and Bollinger Bands show oversold signal
- Short position is opened only when both RSI and Bollinger Bands show overbought signal
The above logic implements a stable dual confirmation strategy for entries and exits.
-
The dual confirmation mechanism filters out a lot of noise trades, avoids unnecessary trades, reduces trading costs, and improves profitability.
-
RSI is effective in identifying trends and reversals. Bollinger Bands is effective in judging supports and resistances. The two complement each other perfectly.
-
Flexible parameter settings, can be adjusted based on different products and trading preferences, highly adaptable.
-
In ranging markets, RSI and Bollinger Bands may give out wrong signals at the same time, causing unnecessary losses. The misjudgment probability can be reduced by optimizing parameters.
-
The dual confirmation mechanism slightly increases entry delay, possibly missing very short-term trading opportunities. Not suitable for strategies that are very sensitive to delay.
-
The strategy is very sensitive to parameters. Inappropriate parameter settings may greatly reduce profitability. Sufficient backtesting and review are needed to find the optimal parameter combination.
-
Test RSI indicators with different periods to find the best matching period parameter to improve efficiency.
-
Add stop loss logic, set reasonable moving stop loss or fixed stop loss to control single trade loss risk.
-
Test Bollinger bandwidth parameter to optimize the channel range and improve efficiency.
-
Test different price inputs like close, high, low etc to find the best price input to enhance stability.
The strategy successfully combines the RSI and Bollinger Bands indicators to implement a dual confirmation logic, ensuring sufficient trading opportunities while effectively reducing noise trades. With proper parameter optimization and risk control, it can become a very stable and reliable trend tracking and trading strategy. [/trans]
Strategy Arguments
| Argument | Default | Description |
|---|---|---|
| v_input_1 | 16 | RSI Period Length |
| v_input_2 | 45 | RSI Value Range |
| v_input_3 | 20 | Bollinger Bands SMA Period Length |
| v_input_4 | 2 | Bollinger Bands Standard Deviation |
| v_input_5 | true | Enable Bar Color? |
| v_input_6 | true | Enable Background Color? |
Source (PineScript)
/*backtest
start: 2023-12-22 00:00:00
end: 2024-01-21 00:00:00
period: 1h
basePeriod: 15m
exchanges: [{"eid":"Futures_Binance","currency":"BTC_USDT"}]
*/

//@version=2
strategy("Bollinger + RSI, Double Strategy (by ChartArt)", shorttitle="CA_-_RSI_Bol_Strat", overlay=true)

// ChartArt's RSI + Bollinger Bands, Double Strategy
//
// Version 1.0
// Idea by ChartArt on January 14, 2015.
//
// This strategy uses a modfied RSI to sell
// when the RSI increases over the value of 55
// (or to buy when the value falls below 45),
// with the classic Bollinger Bands strategy
// to sell when the price is above the
// upper Bollinger Band (and to buy when
// this value is below the lower band).
//
// This simple strategy only triggers when
// both the RSI and the Bollinger Bands
// indicators are at the same time in
// a overbought or oversold condition.
//
// List of my work:
// https://www.tradingview.com/u/ChartArt/
//
//  __             __  ___       __  ___
// /  ` |__|  /\  |__)  |   /\  |__)  |
// \__, |  | /~~\ |  \  |  /~~\ |  \  |
//
//


///////////// RSI
RSIlength = input( 16 ,title="RSI Period Length")
RSIvalue = input( 45 ,title="RSI Value Range")
RSIoverSold = 0 + RSIvalue
RSIoverBought = 100 - RSIvalue
price = close
vrsi = rsi(price, RSIlength)


///////////// Bollinger Bands
BBlength = input(20, minval=1,title="Bollinger Bands SMA Period Length")
BBmult = input(2.0, minval=0.001, maxval=50,title="Bollinger Bands Standard Deviation")
BBbasis = sma(price, BBlength)
BBdev = BBmult * stdev(price, BBlength)
BBupper = BBbasis + BBdev
BBlower = BBbasis - BBdev
source = close
buyEntry = crossover(source, BBlower)
sellEntry = crossunder(source, BBupper)
plot(BBbasis, color=aqua,title="Bollinger Bands SMA Basis Line")
p1 = plot(BBupper, color=silver,title="Bollinger Bands Upper Line")
p2 = plot(BBlower, color=silver,title="Bollinger Bands Lower Line")
fill(p1, p2)


///////////// Colors
switch1=input(true, title="Enable Bar Color?")
switch2=input(true, title="Enable Background Color?")
TrendColor = RSIoverBought and (price[1] > BBupper and price < BBupper) ? red : RSIoverSold and (price[1] < BBlower and price > BBlower)  ? green : na
barcolor(switch1?TrendColor:na)
bgcolor(switch2?TrendColor:na,transp=50)


///////////// RSI + Bollinger Bands Strategy
if (not na(vrsi))

    if (crossover(vrsi, RSIoverSold) and crossover(source, BBlower))
        strategy.entry("RSI_BB_L", strategy.long, stop=BBlower,  comment="RSI_BB_L")
    else
        strategy.cancel(id="RSI_BB_L")

    if (crossunder(vrsi, RSIoverBought) and crossunder(source, BBupper))
        strategy.entry("RSI_BB_S", strategy.short, stop=BBupper, comment="RSI_BB_S")
    else
        strategy.cancel(id="RSI_BB_S")

//plot(strategy.equity, title="equity", color=red, linewidth=2, style=areabr)
Detail
https://www.fmz.com/strategy/439640
Last Modified
2024-01-22 17:04:36
