Name
单均线组合交易策略Simple-Moving-Average-Crossover-Strategy
Author
ChaoZhang
Strategy Description
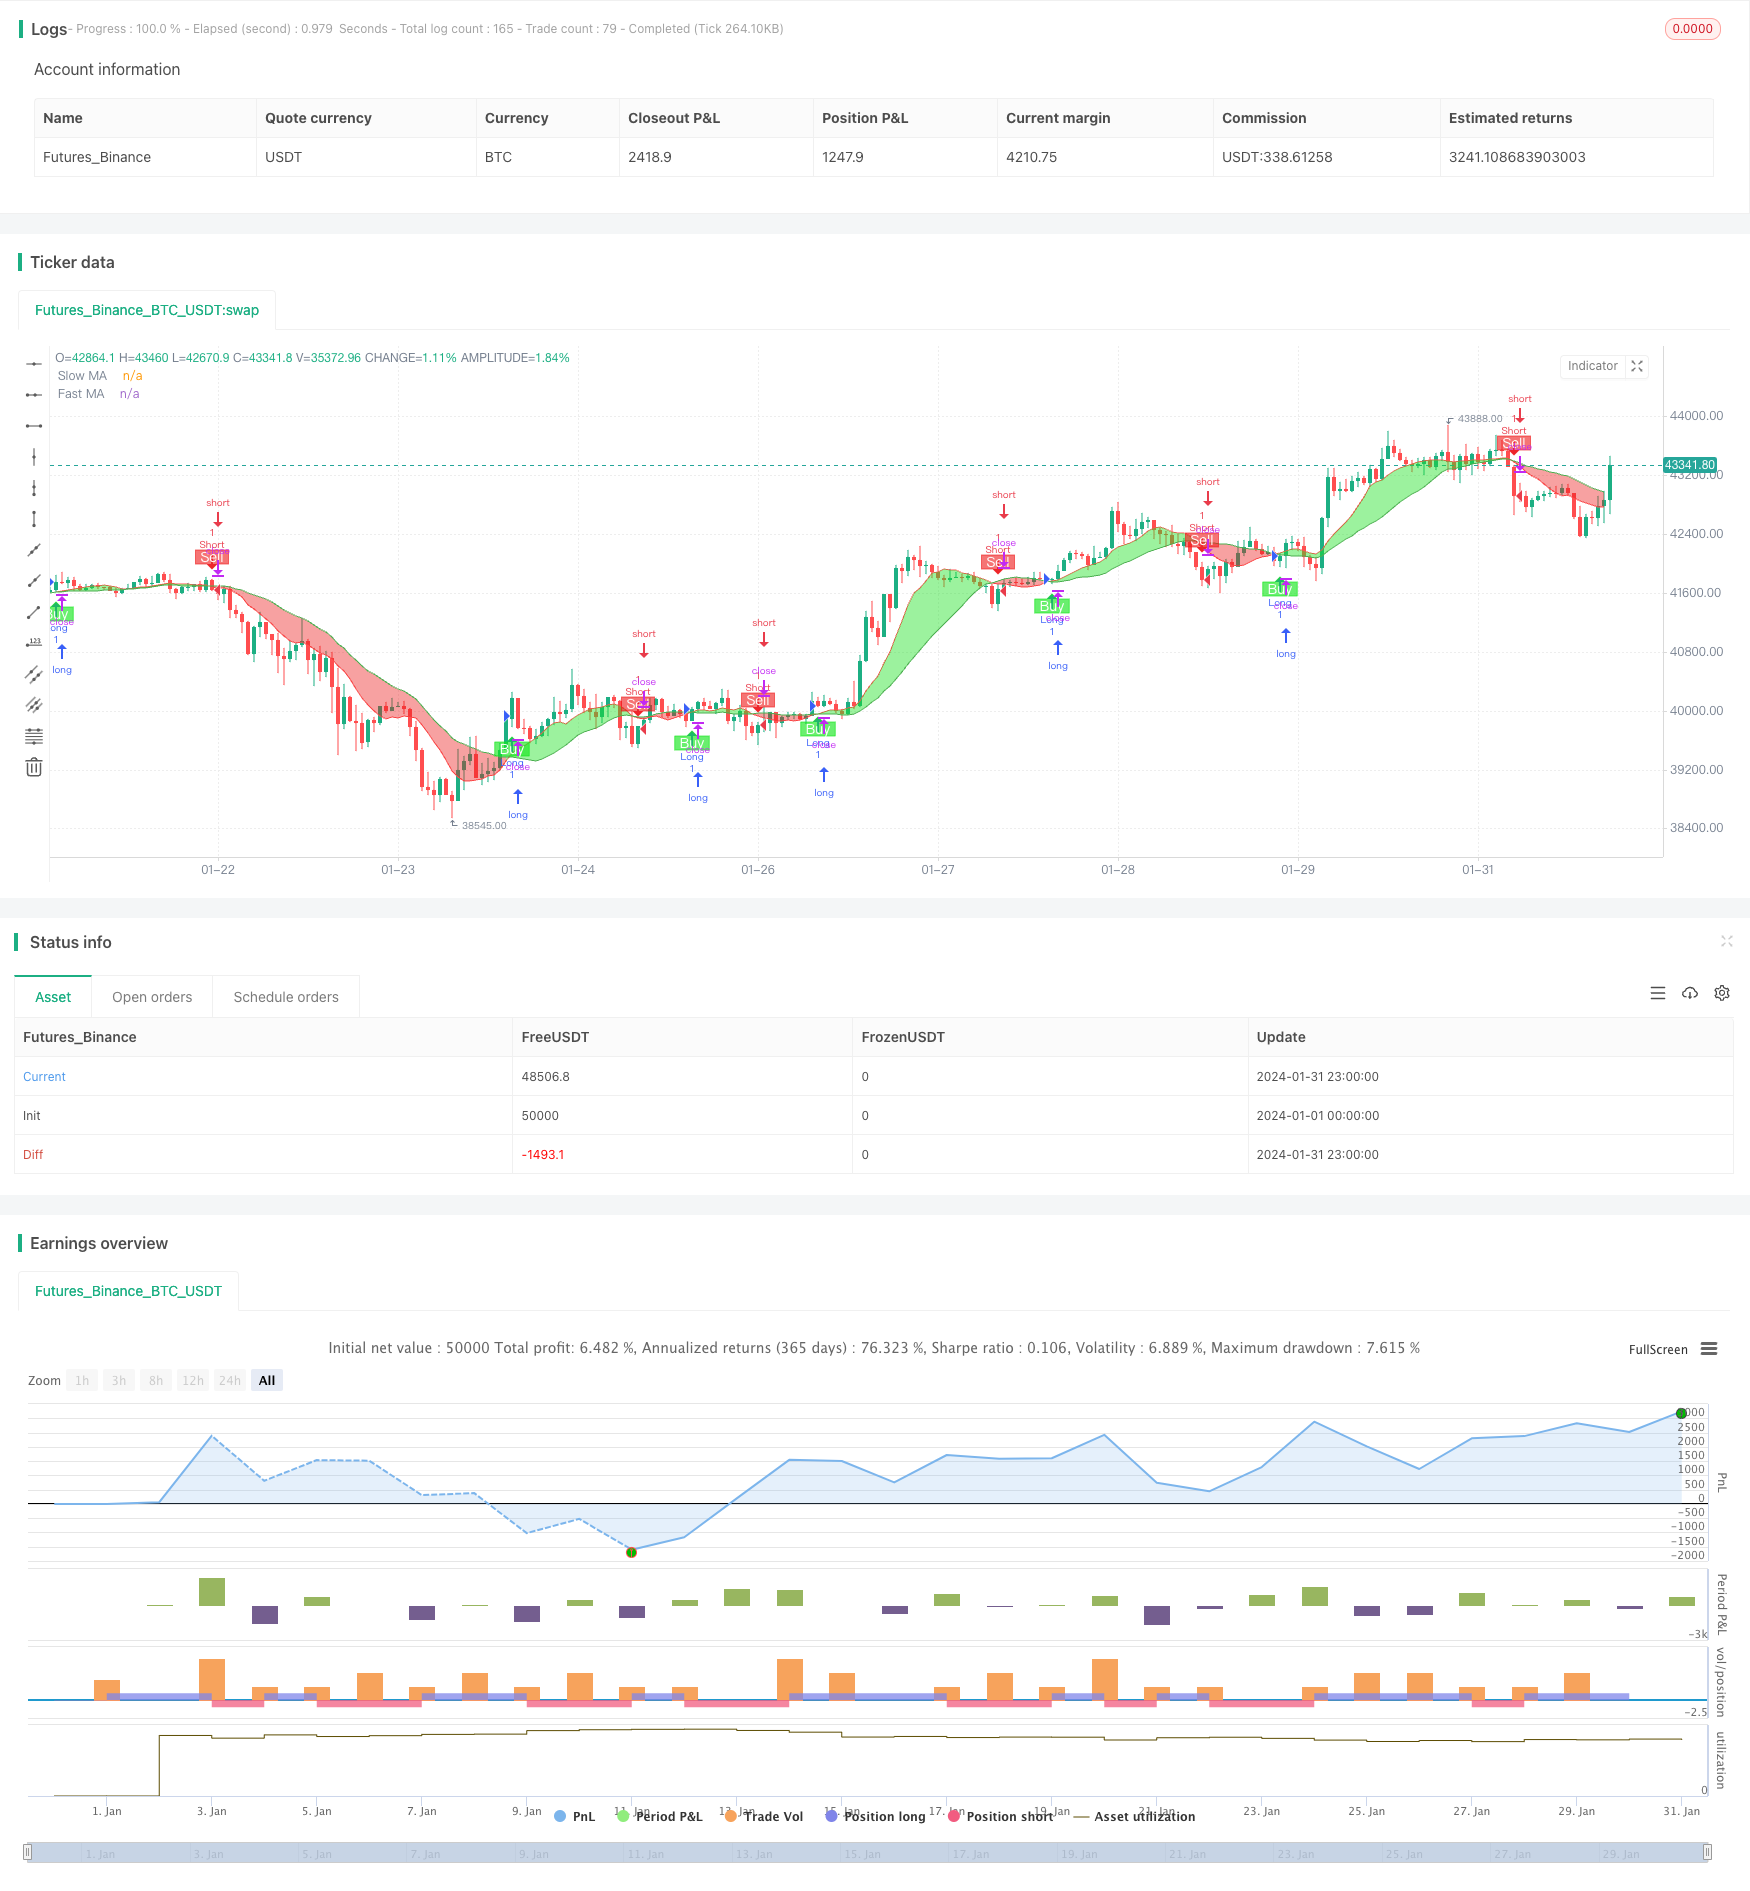
该策略是一个基于简单移动平均线的组合交易策略。它使用9日线和21日线的均线交叉作为买入和卖出信号。当短期均线从下方上穿长期均线时产生买入信号;当短期均线从上方下穿长期均线时产生卖出信号。
这个策略的核心逻辑是使用两个不同参数的简单移动平均线,一个是9日线代表短期趋势,一个是21日线代表长期趋势。当短期趋势线从下方上穿长期趋势线的时候,表示行情从下跌转为上涨,这时产生买入信号;当短期趋势线从上方下穿长期趋势线时,表示行情从上涨转为下跌,这时产生卖出信号。
该策略主要依赖均线的“黄金交叉”和“死亡交叉”两个信号。所谓“黄金交叉”是短期均线从下向上突破长期均线,表示行情可能从下跌转为上涨;“死亡交叉”则是短期均线从上向下跌破长期均线,预示着行情即将从上涨转为下跌。这个策略就是利用这两个信号判断行情的长短期趋势关系,产生买入和卖出决策。
- 操作简单,容易理解使用
- 参数少,不需要大量测试和优化
- 交易频率适中,避免过于激进
- 能相对准确地捕捉长短期趋势的转折点
- 具有一定的可测性和稳定性
- 双均线策略容易产生错误信号和频繁切换
- 买卖点选择和参数设定依赖经验,不够系统化
- 效果与参数选择高度相关,9和21天线并非最优
- 无法有效过滤震荡行情的噪音交易
- 大幅震荡行情中表现不佳,容易损失
可以通过如下方法来优化和改进:
- 增加过滤机制,避免错误信号
- 结合其他指标判断趋势信号的可靠性
- 根据不同品种和参数进行测试优化
- 设置止损止盈逻辑,控制风险
该策略整体来说是一个较为传统和简单的双均线组合策略。它易于理解和实现,参数选择也比较简单,能够有效跟踪长短期趋势的转换。但是该策略也存在一些问题,如产生误信号,PARAMETERS选择经验化,大幅震荡行情中的表现较差等。这需要我们在使用的时候注重风险控制,并进行适当的优化、改进和组合。
||
This is a combination trading strategy based on simple moving averages (SMA). It uses a crossover of the 9-day and 21-day SMA lines as buy and sell signals. When the short-term SMA crosses above the long-term SMA from below, a buy signal is generated. When the short-term SMA crosses below the long-term SMA from above, a sell signal is generated.
The core logic of this strategy is to use two SMA lines with different parameters - a 9-day SMA representing the short-term trend and a 21-day SMA representing the long-term trend. When the short-term trend line crosses above the long-term trend line from below, it indicates the market is changing from downtrend to uptrend, generating a buy signal. When the short-term line crosses below the long-term line from above, it signals a change from uptrend to downtrend, generating a sell signal.
The key signals this strategy relies on are the "golden cross" and "death cross" of the two SMA lines. A golden cross occurs when the short SMA crosses above the long SMA, signaling a possible change from downtrend to uptrend. A death cross occurs when the short SMA crosses below the long SMA, suggesting a downturn from uptrend may start. By utilizing these two signals, the strategy identifies relationships between short-term and long-term trends to make trading decisions.
- Simple to understand and implement
- Few parameters needing extensive testing/optimization
- Reasonable trading frequency avoiding overly aggressive trades
- Fairly accurate at identifying trend reversal points
- Offers measurability and stability to a certain extent
- Prone to generating false signals and whipsaws
- Buying/selling point selection relies heavily on experience instead of a systematic approach
- Performance highly parameter dependent. 9-day/21-day SMA may not be optimal
- Ineffective at filtering noise trades in choppy/sideways markets
- Sizable losing trades in high volatility environments
Possible Enhancements:
- Add filters to avoid acting on false signals
- Incorporate other indicators to gauge signal reliability
- Test and optimize parameters for different products
- Implement stop loss/take profit to control risks
Overall this is a fairly traditional and simple dual moving average crossover system. It is easy to understand and implement with relatively simple parameter selection. It can effectively track changes between short-term and long-term trends. However, issues like false signals, empirically chosen parameters, mediocre performance in high volatility environments need to be addressed. Appropriate optimizations, enhancements, and combinations should be considered along with solid risk control practices.
[/trans]
Source (PineScript)
/*backtest
start: 2024-01-01 00:00:00
end: 2024-01-31 23:59:59
period: 1h
basePeriod: 15m
exchanges: [{"eid":"Futures_Binance","currency":"BTC_USDT"}]
*/

//@version=5
strategy("Bitboy Strategy", overlay=true)

// Define MAs
SlowMA = ta.sma(close, 9)
FastMA = ta.sma(close, 21)

// Plot MAs
plot1 = plot(SlowMA, color=color.new(color.red, 0), title="Slow MA")
plot2 = plot(FastMA, color=color.new(color.green, 0), title="Fast MA")

// Plot MA Ribbon
fill(plot1, plot2, color=FastMA > SlowMA ? color.rgb(233, 21, 21, 50) : color.new(#1de223, 45))

// Define buy/sell conditions
longCondition = ta.crossover(SlowMA, FastMA)
shortCondition = ta.crossunder(SlowMA, FastMA)

// Strategy commands for buy/sell
if longCondition
    strategy.entry("Long", strategy.long)

if shortCondition
    strategy.entry("Short", strategy.short)

// Plot buy/sell signals (for visualization)
plotshape(longCondition, location=location.belowbar, color=color.rgb(18, 230, 25, 37), style=shape.labelup, text="Buy", textcolor=color.white)
plotshape(shortCondition, location=location.abovebar, color=color.rgb(239, 23, 23, 40), style=shape.labeldown, text="Sell", textcolor=color.white)
Detail
https://www.fmz.com/strategy/442388
Last Modified
2024-02-21 15:11:32
