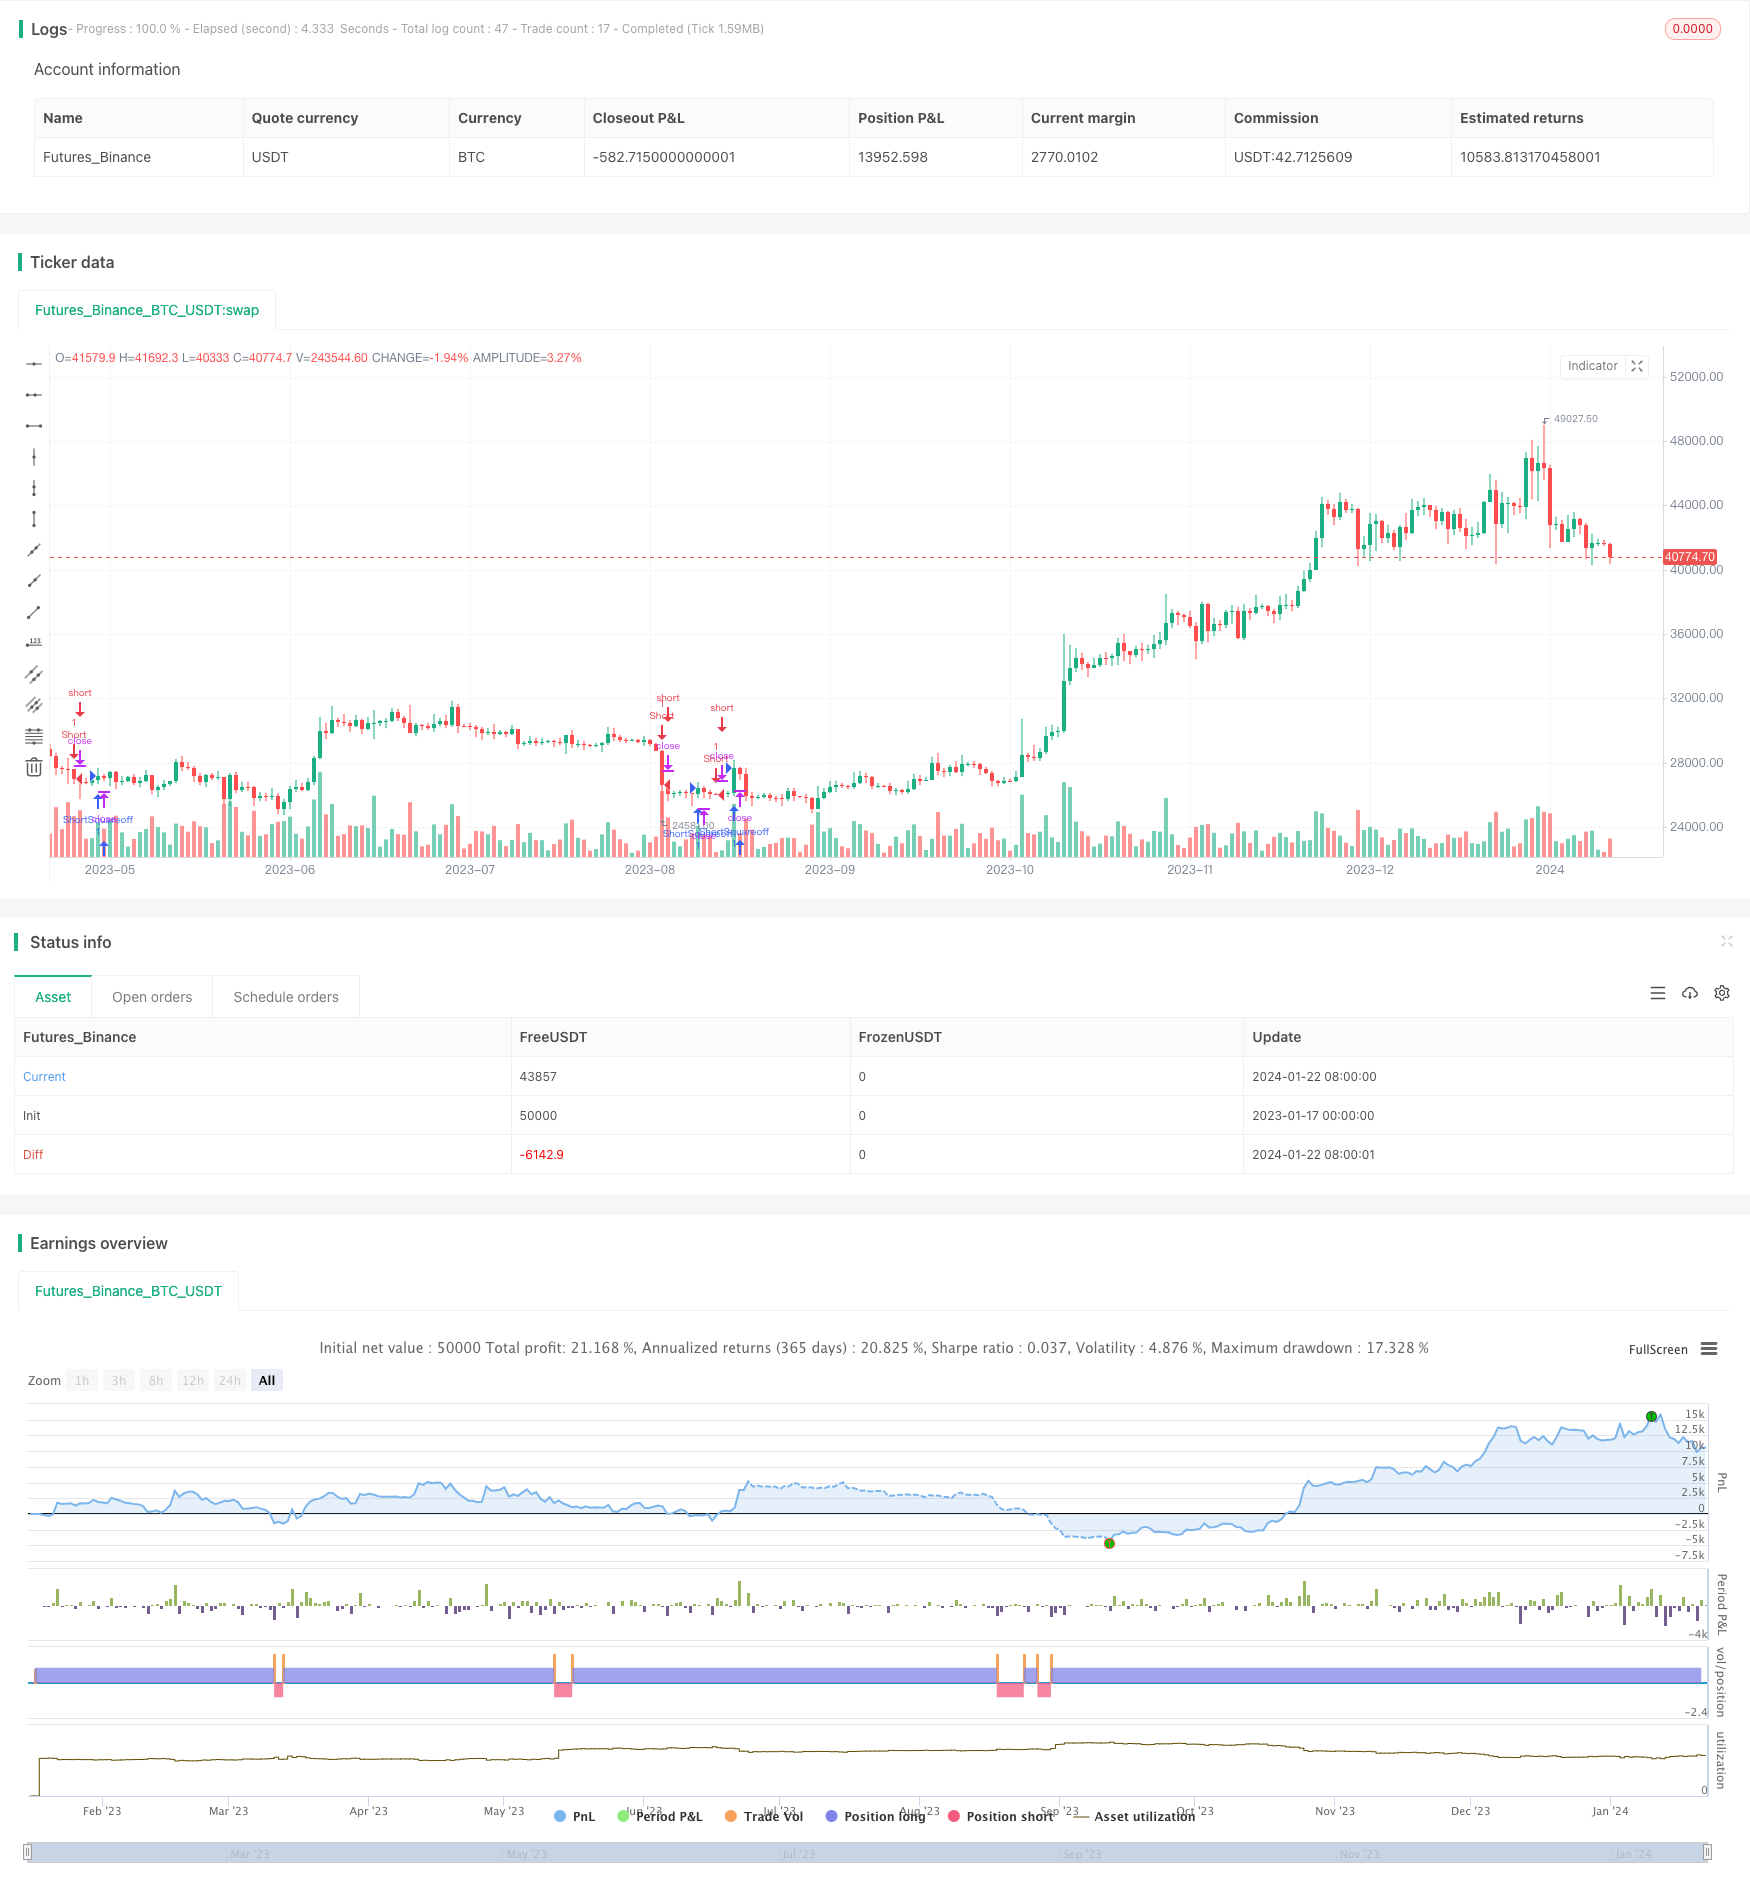
Name
单根K线技术指标组合短期贸易策略Intraday-Single-Candle-Indicator-Combo-Short-Term-Trading-Strategy
Author
ChaoZhang
Strategy Description
该策略通过结合多个技术指标对Bank Nifty的短期趋势进行判断,以发出买入或卖出信号。主要运用的技术指标有MACD、RSI、ADX、Stochastic和布林带。策略名称为“BankNifty_Bearish_Intraday”,表示其主要用于判断Bank Nifty的短期bearish趋势。
该策略的核心逻辑是,当MACD、RSI、ADX、Stochastic和布林带等多个指标同时显示超卖信号时,发出做空信号;当五根K线收盘价上穿五日线时,发出平仓信号。
具体而言,MACD的5分钟、15分钟和60分钟均要低于其上一根K线,表示三个时间周期上趋势向下;RSI低于40表示超卖;ADX高于12表示趋势开始形成;Stochastic %K下穿%D表示动量向下;布林带下轨下穿表示波动加大。当这些指标同时符合时,发出做空信号。
Position的平仓信号则是当5分钟K线收盘价上穿5日均线时,表示短期趋势可能反转,此时平掉头寸。
通过组合多个时间周期上的K线指标,可以更准确判断短期趋势,过滤掉部分噪音。同时设置止损平仓点,可以控制单笔交易的风险。
该策略最大的优势在于指标组合全面,可以准确判断短期趋势,特别适合高频交易。具体优势有:
-
结合多时间周期指标,判断更加准确;
-
设置止损点,可以限制单笔交易损失;
-
交易频次较高,适合积极的短线交易者。
该策略的主要风险在于指标组合过于复杂,可能出现信号不一致的情况。此外,高频交易虽然单笔损失有限,但整体交易次数较多,手续费会比较高。主要风险包括:
- 信号出现不一致,买卖点判断失误的可能;
- 高频交易,手续费成本较高;
- 需密切监控市场,不能马虎。
为了应对这些风险,我们可以适当简化指标组合,调整止损位置,并控制每次交易资金占用比例。
该策略可以从以下几个方向进行优化:
- 调整指标参数,优化买卖信号的准确性;
2.增加其他辅助判断指标,如交易量指标,确保足够的趋势信心;
3.设置动态止损,根据市场波动程度做调整;
4.加入跨周期分析,判断关键支撑阻力;
5.根据波动性和风险管理规则,制定一个头寸规模策略。
通过测试不同的参数设定、增加判断维度等优化,可以使该策略更稳定可靠。
该短期交易策略通过单根K线多指标组合判断,实现高频出入场。优点是准确抓住短期动能,风险得到控制;缺点是复杂的信号,高额的佣金费用. 我们可以通过调整参数、加入更多辅助判断、设置动态止损、跨周期分析等方法进行优化,使策略更实用。总体来说,该策略为积极的短线交易者提供了一个快速出入场的思路,值得借鉴学习。
||
This strategy combines multiple technical indicators on Bank Nifty to judge its short-term trend and generate trading signals. The key indicators used include MACD, RSI, ADX, Stochastic and Bollinger Bands. The strategy name "BankNifty_Bearish_Intraday" indicates its main use for judging Bank Nifty's short-term bearish trend.
The core logic is to send short signal when MACD, RSI, ADX, Stochastic and Bollinger Bands all show oversold condition; send exit position signal when 5-minute candle closes above 5-day MA line.
Specifically, MACD's 5min, 15min and 60min all lower than previous candle means downtrend in three timeframes; RSI below 40 means oversold; ADX above 12 means trend establishing; Stochastic %K crosses below %D means downward momentum; Bollinger Lower Band breaks previous low means increasing volatility. When all these indicators trigger together, a short signal is generated.
The exit signal is when 5-minute candle closes above 5-day MA line, indicating potential short-term trend reversal.
Combining indicators across timeframes filters out noise and judges short-term trend more precisely. The stop loss exit also controls per trade risk.
The biggest edge is the comprehensive indicator combo which accurately captures short-term trend, ideal for high frequency trading. Concrete advantages:
- Cross timeframe analysis improves accuracy;
- Stop loss limits per trade loss;
- High trading frequency suits aggressive short-term traders.
Main risks include inconsistent signals due to complex combo, and higher commissions from frequent trades. Concrete risks:
- Inconsistent signal may cause wrong entry or exit;
- High frequency trades lead to higher commission fees;
- Need close market monitoring.
Solutions include simplifying indicator combo, adjusting stop loss, and limiting capital usage per trade.
Several optimization directions:
- Adjust indicator parameters for better signal accuracy;
- Add other confirming indicators e.g. volume to ensure trend confidence;
- Set dynamic stop loss based on market volatility;
- Perform cross timeframe analysis for key S&R levels;
- Develop position sizing strategy based on volatility and risk management rules.
Proper parameter tuning, additions of confirming factors and robust risk control will enhance the strategy stability.
This short term trading strategy provides a fast entry/exit method for aggressive traders by combining signals from multiple single candle indicators. Pros are catching short-term momentum accurately and risk control; Cons are complex signal generation and high commission fees. Optimizations like parameter tuning, adding confirming factors, dynamic stop loss and cross timeframe analysis can improve strategy stability. Overall this offers useful ideas on high frequency trading worth learning from.
[/trans]
Strategy Arguments
| Argument | Default | Description |
|---|---|---|
| v_input_1 | 14 | Stochastic Length |
| v_input_2 | 3 | %K Smoothing |
| v_input_3 | 3 | %D Smoothing |
Source (PineScript)
/*backtest
start: 2023-01-17 00:00:00
end: 2024-01-23 00:00:00
period: 1d
basePeriod: 1h
exchanges: [{"eid":"Futures_Binance","currency":"BTC_USDT"}]
*/

// This source code is subject to the terms of the Mozilla Public License 2.0 at https://mozilla.org/MPL/2.0/
// © makarandpatil

// This strategy is for Bank Nifty instrument and for intraday purpose only
// It checks for various indicators and gives a sell signal when all conditions are met
// Bank Nifty when in momentum gives 100-200 points in spot in 5-15 min which is how long the trade duration should be
// Issues - The custom script as per TradingView Pinescripting has an issue of repaint
// More information on repainting issue in this link - https://www.tradingview.com/pine-script-docs/en/v5/concepts/Repainting.html
// Use the script alert only to get notified, however check all the parameters individually before taking the trade
// Also, please perform a backtesting and deep backtesting of this strategy to see if the strategy gave correct buy signals in the past
// The script is made for testing purposes only and is in beta mode. Please use at own risk.


//@version=5
strategy("BankNifty_Bearish_Intraday", overlay=true, margin_long=100, margin_short=100)

// Variables
StochLength = input(14, title="Stochastic Length")
smoothK = input(3, title="%K Smoothing")
smoothD = input(3, title="%D Smoothing")

//INDICATOR CALCULATIONS

// 1. MACD
[macdLine, signalLine, histLine] = ta.macd(close[0],12,26,9)
macd5 = request.security(syminfo.tickerid, "5", macdLine)
macd15 = request.security(syminfo.tickerid,"15",macdLine)
macd60 = request.security(syminfo.tickerid,"60",macdLine)

// 2. RSI Calculation
xRSI = ta.rsi(close, 14)

// 3. ADX calculation
[diplus, diminus, adx] = ta.dmi(14,14)

// 4. Stochastic Calculation
k = ta.sma(ta.stoch(close, high, low, StochLength), smoothK)
d = ta.sma(k, smoothD)

// 5. Bollinger Band calculation
[middle, upper, lower] = ta.bb(close, 20, 2)

//CONDITIONS

// 1. Conditions for MACD
macd5Downtick = macd5[0] < macd5[1]
macd15Downtick = macd15[0] < macd15[1]
macd60Downtick = macd60[0] <= macd60[1]

// 2. Condition for xRSI
RSIWeak = xRSI < 40

// 3. Condition for ADX
ADXUngali = adx >= 12

// 4. Condition for Stochastic
StochNCO = k < d

// 5. Condition for Bollinger Band
BBCD = lower < lower [1]

//Evaluate the short condition
shortCondition = macd5Downtick and macd15Downtick and macd60Downtick and RSIWeak and ADXUngali and StochNCO and BBCD
// shortCondition = macd5Downtick and macd15Downtick and RSIWeak and ADXUngali and StochNCO
if (shortCondition)
    strategy.entry("Short", strategy.short, alert_message = "BankNifty_Sell_Momentum")

longCondition = close > ta.ema(close,5)
if (longCondition)
    strategy.entry("ShortSquareoff", strategy.long, alert_message = "BankNifty_Closed_Above_5EMA")
Detail
https://www.fmz.com/strategy/439871
Last Modified
2024-01-24 15:04:34
