Name
博林带RSI交叉策略Bollinger-Bands-and-RSI-Crossover-Strategy
Author
ChaoZhang
Strategy Description
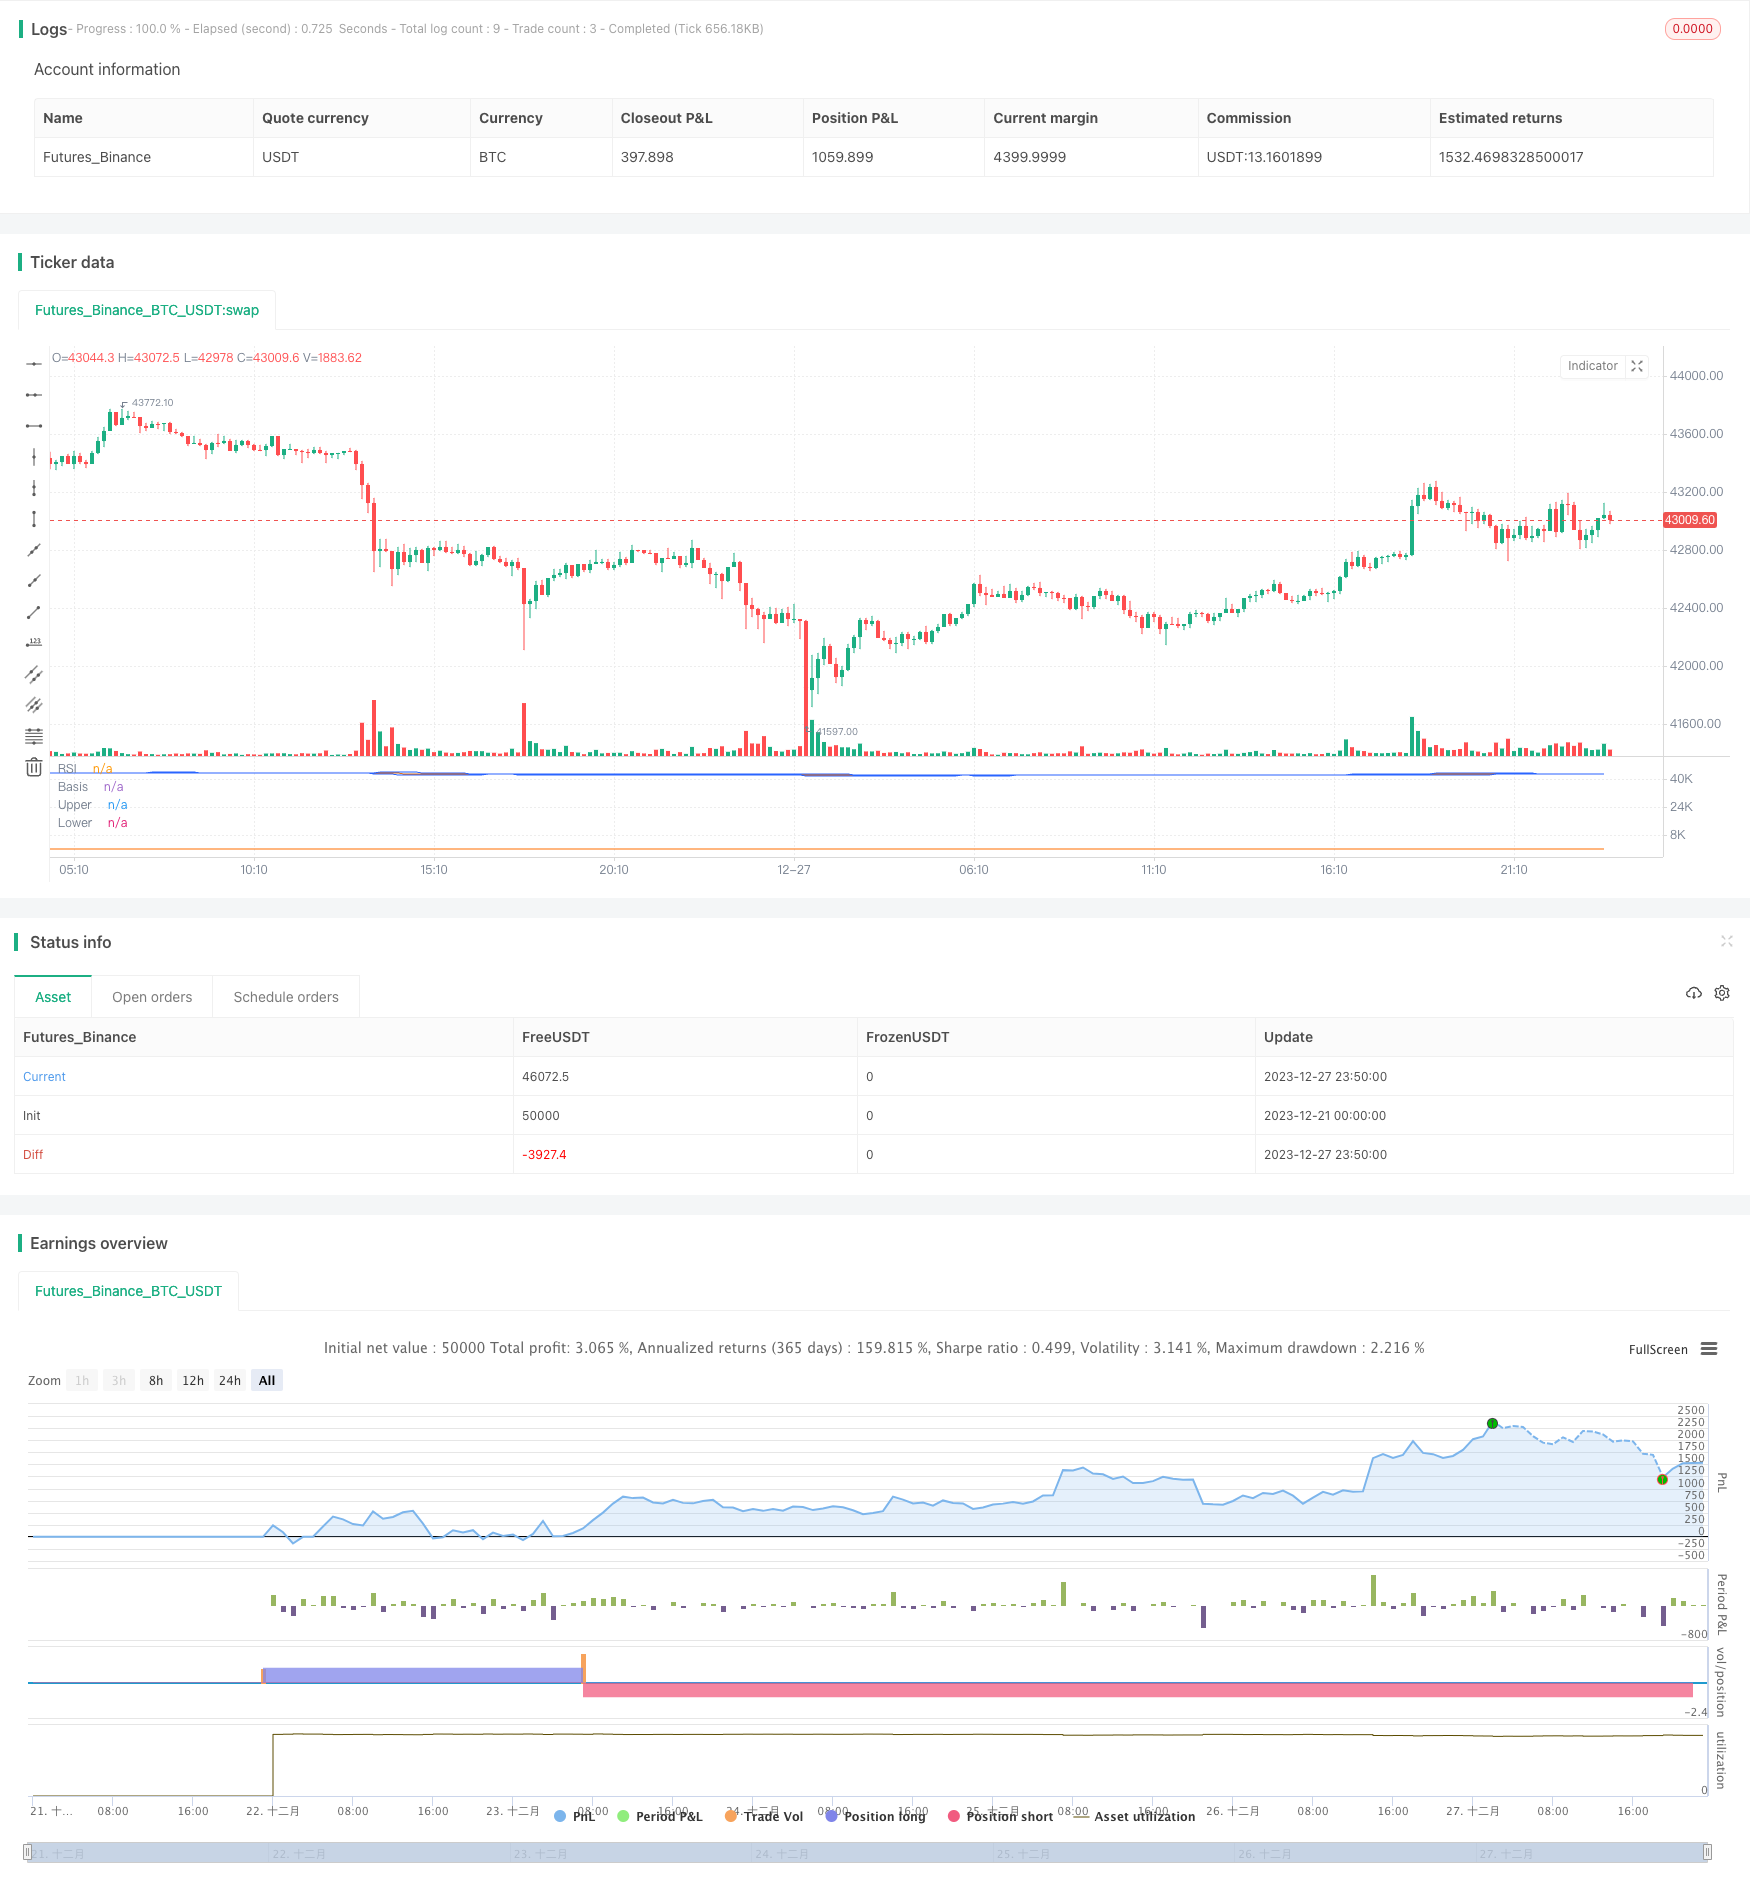
本策略结合使用了博林带和相对强弱指数(RSI)的技术指标,在RSI指标发生金叉或死叉时,判断价格是否触及或突破博林带上轨或下轨,以发出买入和卖出信号。
-
计算20周期的SMA作为基线,上轨为基线+2倍标准差,下轨为基线-2倍标准差,构建博林带。
-
计算14周期RSI值,RSI高于70为超买区,低30以下为超卖区。
-
当RSI指标下穿30时,如价格低于下轨,产生买入信号;当RSI指标上穿70时,如价格高于上轨,产生卖出信号。
-
博林带利用标准差范围来判断价格波动和未来走势,有较强的趋势判断能力。
-
RSI指标判断超买超卖情况,结合博林带轨道判断,可以有效发现反转机会。
-
RSI指标容易形成突破信号,与博林带结合,信号更加准确可靠。
-
博林带并不是百分之百准确,价格有可能会突破上下轨继续运行。
-
RSI指标也可能形成假突破信号,与博林带判断结果不一致。
-
适当调整参数非常重要,参数设置不当可能导致交易信号过于频繁或稀少。
-
可以测试不同周期的参数,寻找最佳参数组合。
-
可以结合其他指标,如KD,MACD等,提高信号的可靠性。
-
可以基于回测结果,优化止损止盈策略,控制风险。
本策略集成博林带的趋势分析和RSI指标的超买超卖判断,形成交易信号。总的来说,策略思路清晰,易于实施,具有一定的实战价值。但也存在一定的风险,需要注意参数调整和指标整合,不断优化,使之适应不同市场环境。
||
This strategy combines the Bollinger Bands and Relative Strength Index (RSI) technical indicators. It generates buy and sell signals when the RSI indicator crosses over the oversold or overbought levels and the price touches or breaks through the Bollinger Bands.
-
Calculate the 20-period SMA as the basis line. The upper band is the basis + 2 standard deviations and the lower band is the basis - 2 standard deviations to construct the Bollinger Bands.
-
Calculate the 14-period RSI. RSI above 70 is overbought zone and below 30 is oversold zone.
-
When RSI breaks below 30 and price is lower than the lower band, a buy signal is generated. When RSI breaks above 70 and price is higher than the upper band, a sell signal is generated.
-
Bollinger Bands uses standard deviation to judge price volatility and future trends with strong capability.
-
RSI judges overbought and oversold levels. Combined with Bollinger Bands, it can effectively discover reversal opportunities.
-
RSI is easy to form breakout signals. Combined with Bollinger Bands, the trading signals are more accurate and reliable.
-
Bollinger Bands are not 100% accurate and prices may break through the upper or lower band and keep running.
-
RSI may also form false breakout signals which are inconsistent with Bollinger Bands.
-
Proper parameter tuning is important. Improper settings may lead to too frequent or rare trading signals.
-
Test different parameter periods to find the optimal parameter combination.
-
Incorporate other indicators like KD, MACD to improve signal reliability.
-
Optimize stop loss and take profit based on backtest results to control risks.
This strategy integrates Bollinger Bands' trend analysis and RSI's overbought-oversold judgment to generate trading signals. Overall, the strategy logic is clear and easy to implement with certain practical value. But it also has some risks. Parameters tuning and indicators integration are needed to continuously optimize it to adapt to different market environments.
[/trans]
Strategy Arguments
| Argument | Default | Description |
|---|---|---|
| v_input_int_1 | 20 | Length |
| v_input_1_close | 0 | Source: close |
| v_input_float_1 | 2 | StdDev |
| v_input_int_2 | 14 | RSI Length |
| v_input_int_3 | 70 | RSI Overbought Level |
| v_input_int_4 | 30 | RSI Oversold Level |
Source (PineScript)
/*backtest
start: 2023-12-21 00:00:00
end: 2023-12-28 00:00:00
period: 10m
basePeriod: 1m
exchanges: [{"eid":"Futures_Binance","currency":"BTC_USDT"}]
*/

//@version=5
strategy("Bollinger Bands and RSI Strategy", overlay=false)

// Define the parameters
length = input.int(20, "Length", minval=1)
src = input(close, "Source")
mult = input.float(2.0, "StdDev", minval=0.001, maxval=50)
rsiLength = input.int(14, "RSI Length", minval=1)
rsiOverbought = input.int(70, "RSI Overbought Level", minval=1, maxval=100)
rsiOversold = input.int(30, "RSI Oversold Level", minval=1, maxval=100)

// Calculate the Bollinger Bands
basis = ta.sma(src, length)
dev = mult * ta.stdev(src, length)
upper = basis + dev
lower = basis - dev

// Plot the Bollinger Bands
plot(basis, "Basis", color=#FF6D00)
p1 = plot(upper, "Upper", color=#2962FF)
p2 = plot(lower, "Lower", color=#2962FF)
fill(p1, p2, color=color.rgb(33, 150, 243, 90), title="Background")

// Calculate the RSI
rsi = ta.rsi(src, rsiLength)

// Plot the RSI
plot(rsi, "RSI", color=#FF6D00)

// Define the entry and exit conditions
longCondition = ta.crossover(rsi, rsiOversold) and src < lower // Use ta.crossover here
if (longCondition)
    strategy.entry("Long", strategy.long)

shortCondition = ta.crossunder(rsi, rsiOverbought) and src > upper // Use ta.crossunder here
if (shortCondition)
    strategy.entry("Short", strategy.short)

// Plot the buy and sell signals
plotshape(longCondition, title="Buy", location=location.belowbar, color=color.green, style=shape.triangleup, size=size.small)
plotshape(shortCondition, title="Sell", location=location.abovebar, color=color.red, style=shape.triangledown, size=size.small)
Detail
https://www.fmz.com/strategy/437035
Last Modified
2023-12-29 16:40:19
