Name
历史走势诱变策略Vortex-Trend-Reversal-Strategy
Author
ChaoZhang
Strategy Description
历史走势诱变策略利用涡流指标识别市场趋势反转点,结合指数移动平均线产生交易信号,旨在捕获 favor 行情。该策略巧妙地组合使用涡流指标和移动平均线的优势,可以有效判断市场走势并提供交易指引。
-
涡流指标 - 通过分析价格的正向运动和负向运动判断趋势的方向和强度。主要参数包括周期长度、乘数和阈值。
-
指数移动平均线 - 对收盘价进行指数平滑,提供更流畅的趋势判断。移动平均线周期越长,趋势判断越稳定。
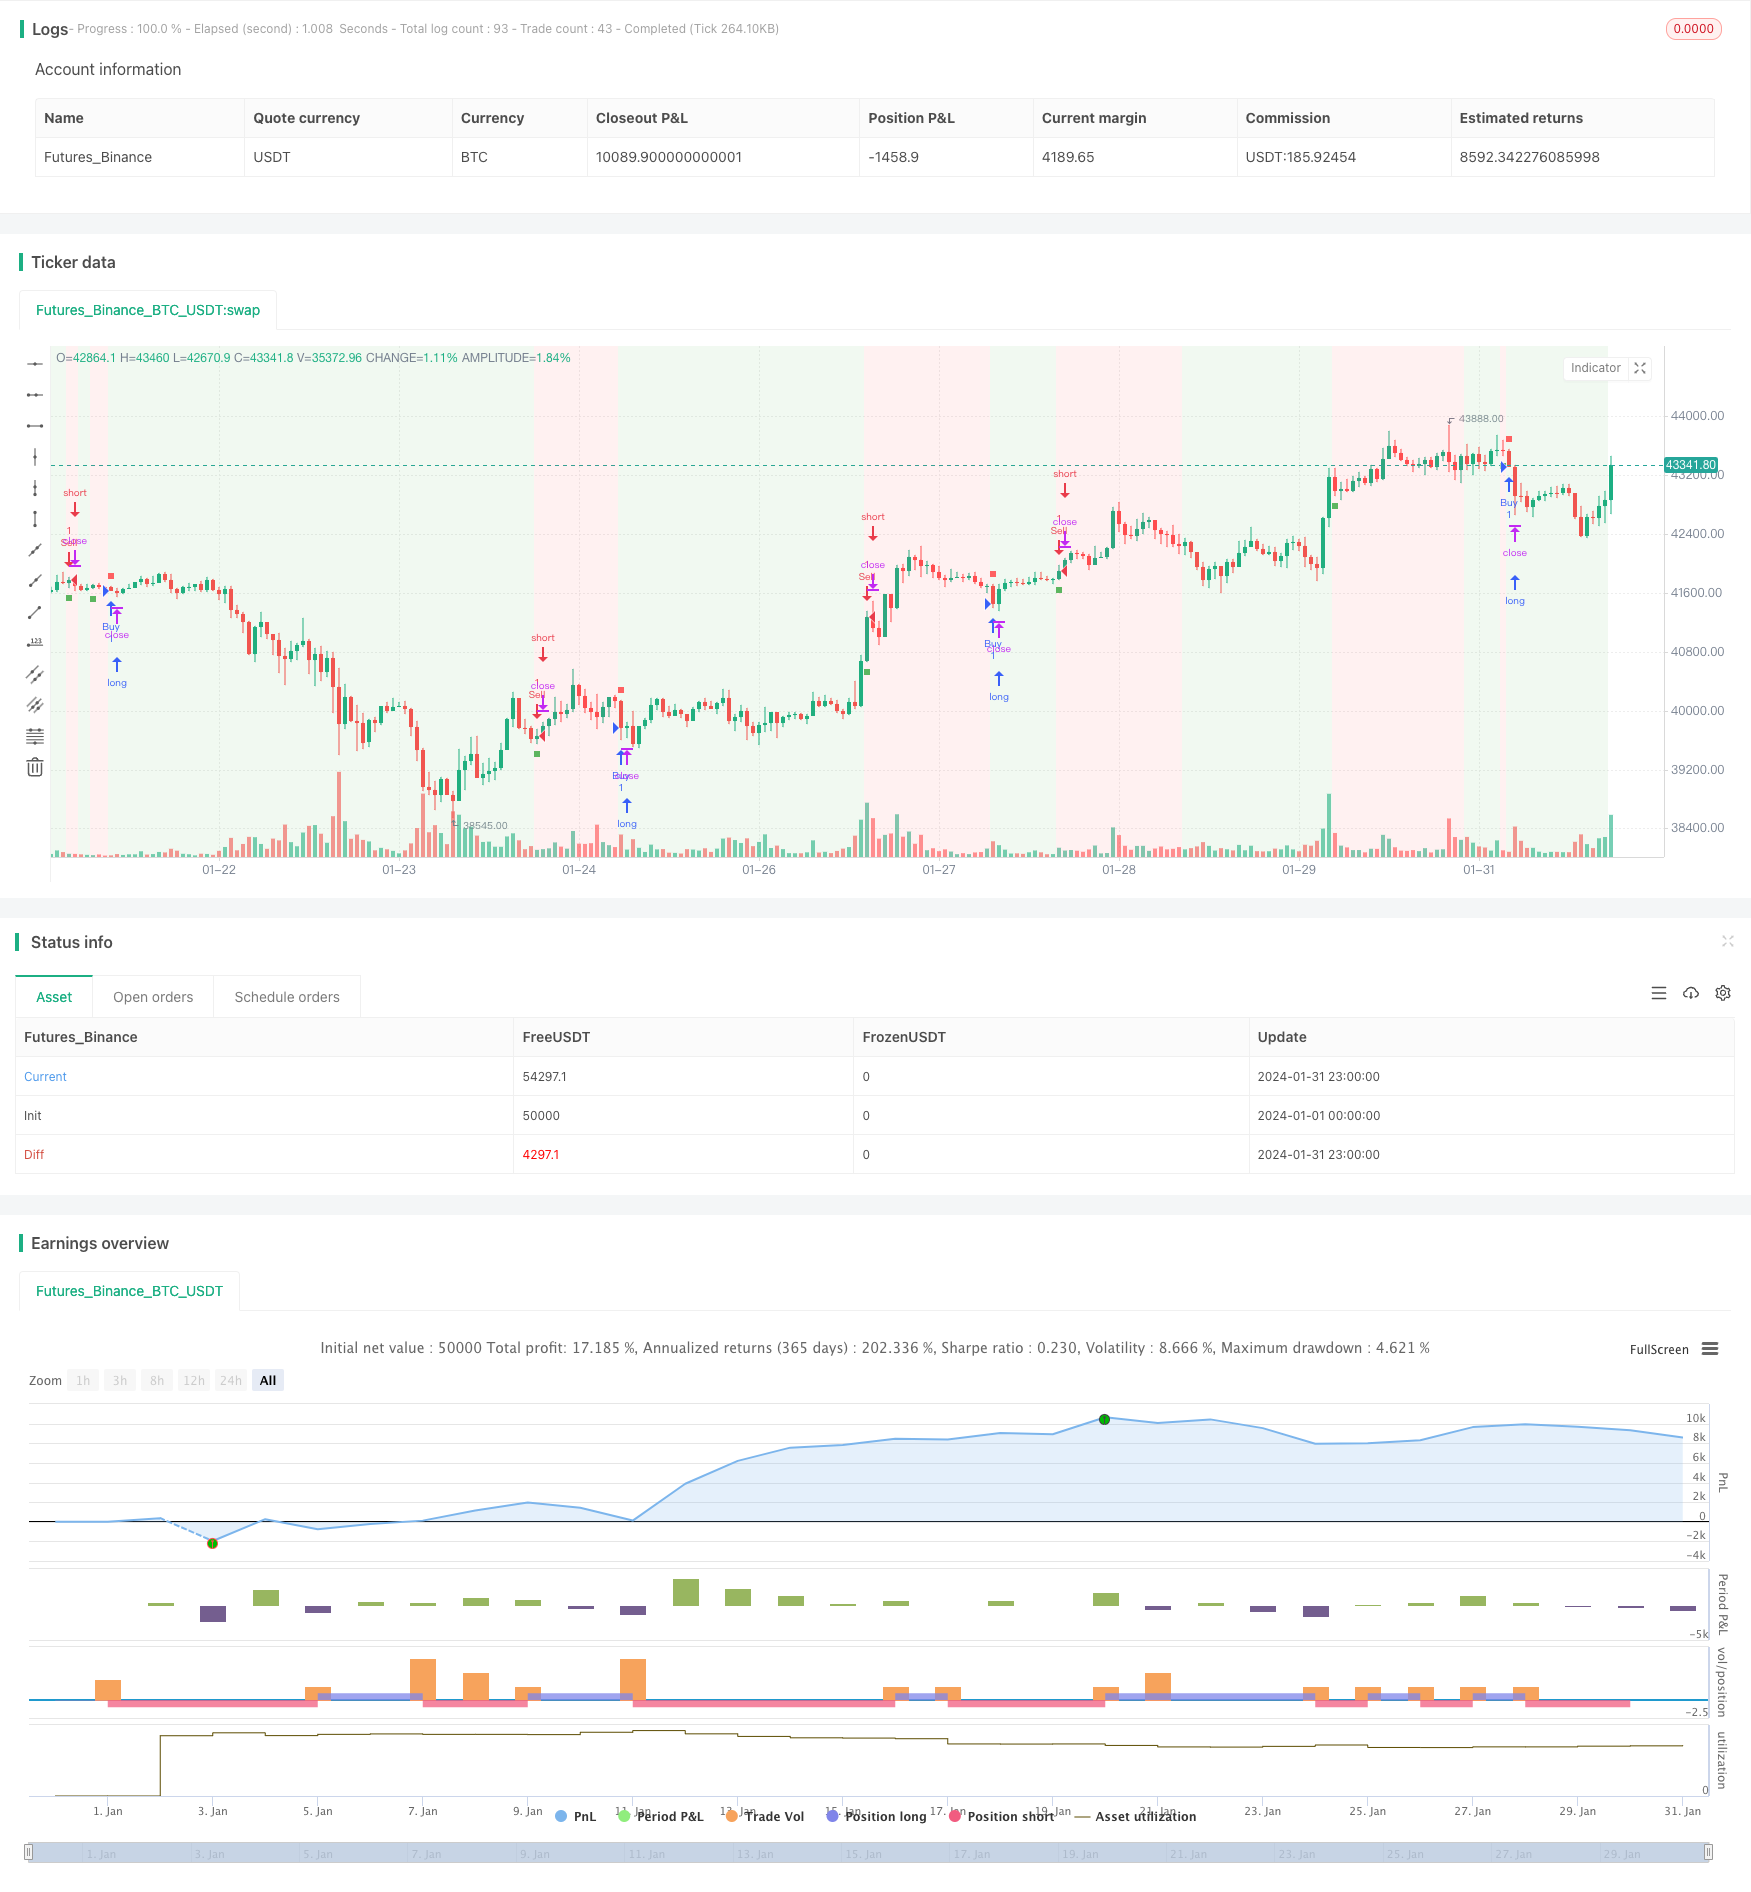
该策略运用涡流指标判定市场主要趋势方向,当指标线穿越阈值时产生交易信号。结合移动平均线进行过滤,避免错误信号。具体来说,当涡流指标向上穿越阈值线且价格高于移动平均线时产生买入信号;当涡流指标向下穿越阈值线且价格低于移动平均线时产生卖出信号。
- 利用涡流指标的反转识别能力,可以及时捕捉潜在的趋势反转机会
- 结合移动平均线进行信号过滤,避免在震荡行情中产生错误交易
- 可通过参数优化,调整策略灵敏度,适用于不同市场环境
- 直观的界面和清晰的交易信号,便于实盘操作
- 须警惕突发事件造成指标失效的系统风险
- 震荡行情中可能出现较多错误信号
- 参数设置不当也会导致过于激进或保守
- 需搭配适当的止损来控制单笔损失
针对风险,可通过增设附加过滤器,结合多种指标判断,优化参数设置,并设置恰当的止损来应对。
- 尝试不同的移动平均线类型,寻找最匹配的组合
- 调整涡流指标和移动平均线的参数,达到最佳回报率
- 在多时间周期上检验策略稳定性
- 添加如布林带等指标过滤信号
- 针对特定品种进行参数微调
历史走势诱变策略总体较为稳健,在抓住潜在趋势反转的同时具有一定的过滤能力。通过参数优化和风险管理的辅助,该策略可望获取较为出色的回报率。建议交易者在仿真实盘中全面验证,也可尝试在该策略基础上进行创新性拓展。
||
The Vortex Trend Reversal Strategy utilizes the Vortex Indicator to identify potential trend reversals and capture favorable market movements. By intelligently combining the Vortex Indicator with a moving average line, this strategy aims to effectively determine market trends and generate trading signals.
-
Vortex Indicator - Judging trend direction and strength by analyzing positive and negative price movements. Major parameters include period, multiplier and threshold.
-
Exponential Moving Average - Smoothing closing prices for a more fluid trend indication. Longer moving average periods lead to more stable trend judgments.
This strategy leverages the Vortex Indicator to determine the major trend direction. Trading signals are generated when indicator lines cross the threshold value. With further filtering from the moving average line, erroneous signals can be avoided. Specifically, a buy signal is generated when the Vortex Indicator crosses above the threshold line and price is above the moving average; A sell signal occurs when indicator crosses below threshold and price is below moving average.
- Captures potential trend reversal opportunities in a timely manner with the Vortex Indicator
- Avoids wrong trades in choppy markets by filtering signals with the moving average line
- Adjustable sensitivity for different market environments through parameter optimization
- Intuitive interface and clear trading signals for ease of real trading operations
- Systemic risks of indicator failure due to black swan events
- Increased erroneous signals possible in ranging markets
- Overly aggressive or conservative behavior with improper parameter settings
- Individual losing trades need to be controlled with appropriate stop loss
Additional filters, cross-verification between indicators, parameter optimization and proper stop loss implementation could help address the above risks.
- Experimenting with different moving average types to find best match
- Fine-tuning parameters of both indicators for optimum risk-adjusted returns
- Examining strategy robustness across multiple timeframes
- Adding filters like Bollinger Bands to filter signals
- Asset-specific parameter tweaking
The Vortex Trend Reversal Strategy demonstrates decent robustness in capturing potential reversals while possessing reasonable filtering capabilities. With proper optimization and risk management, this strategy shows promise in obtaining strong risk-adjusted returns. Traders are encouraged to thoroughly backtest this strategy and explore innovative extensions based on it.
[/trans]
Strategy Arguments
| Argument | Default | Description |
|---|---|---|
| v_input_1 | 14 | (?AstroHub Vortex Strategy)Length |
| v_input_2 | true | Multiplier |
| v_input_3 | 0.5 | Threshold |
| v_input_4 | 20 | EMA Length |
Source (PineScript)
/*backtest
start: 2024-01-01 00:00:00
end: 2024-01-31 23:59:59
period: 1h
basePeriod: 15m
exchanges: [{"eid":"Futures_Binance","currency":"BTC_USDT"}]
*/

// This work is licensed under a Attribution-NonCommercial-ShareAlike 4.0 International (CC BY-NC-SA 4.0) https://creativecommons.org/licenses/by-nc-sa/4.0/
// © AstroHub

//@version=5
strategy("Vortex Strategy [AstroHub]", shorttitle="VS [AstroHub]", overlay=true)

// Vortex Indicator Settings
length = input(14, title="Length", group ="AstroHub Vortex Strategy", tooltip="Number of bars used in the Vortex Indicator calculation. Higher values may result in smoother but slower responses to price changes.")
mult = input(1.0, title="Multiplier", group ="AstroHub Vortex Strategy", tooltip="Multiplier for the Vortex Indicator calculation. Adjust to fine-tune the sensitivity of the indicator to price movements.")
threshold = input(0.5, title="Threshold",group ="AstroHub Vortex Strategy",  tooltip="Threshold level for determining the trend. Higher values increase the likelihood of a trend change being identified.")
emaLength = input(20, title="EMA Length", group ="AstroHub Vortex Strategy", tooltip="Length of the Exponential Moving Average (EMA) used in the strategy. A longer EMA may provide a smoother trend indication.")

// Calculate Vortex Indicator components
a = math.abs(close - close[1])
b = close - ta.sma(close, length)
shl = ta.ema(b, length)
svl = ta.ema(a, length)

// Determine trend direction
upTrend = shl > svl
downTrend = shl < svl

// Define Buy and Sell signals
buySignal = ta.crossover(shl, svl) and close > ta.ema(close, emaLength) and (upTrend != upTrend[1])
sellSignal = ta.crossunder(shl, svl) and close < ta.ema(close, emaLength) and (downTrend != downTrend[1])

// Execute strategy based on signals
strategy.entry("Sell", strategy.short, when=buySignal)
strategy.entry("Buy", strategy.long, when=sellSignal)

// Background color based on the trend
bgcolor(downTrend ? color.new(color.green, 90) : upTrend ? color.new(color.red, 90) : na)

// Plot Buy and Sell signals with different shapes and colors
buySignal1 = ta.crossover(shl, svl) and close > ta.ema(close, emaLength)
sellSignal1 = ta.crossunder(shl, svl) and close < ta.ema(close, emaLength)

plotshape(buySignal1, style=shape.square, color=color.new(color.green, 10), size=size.tiny, location=location.belowbar, title="Buy Signal")
plotshape(sellSignal1, style=shape.square, color=color.new(color.red, 10), size=size.tiny, location=location.abovebar, title="Sell Signal")
plotshape(buySignal1, style=shape.square, color=color.new(color.green, 90), size=size.small, location=location.belowbar, title="Buy Signal")
plotshape(sellSignal1, style=shape.square, color=color.new(color.red, 90), size=size.small, location=location.abovebar, title="Sell Signal")
Detail
https://www.fmz.com/strategy/442861
Last Modified
2024-02-26 16:45:21
