Name
双向波动吞噬策略Dual-direction-Volatility-Swallowing-Strategy
Author
ChaoZhang
Strategy Description
[trans]
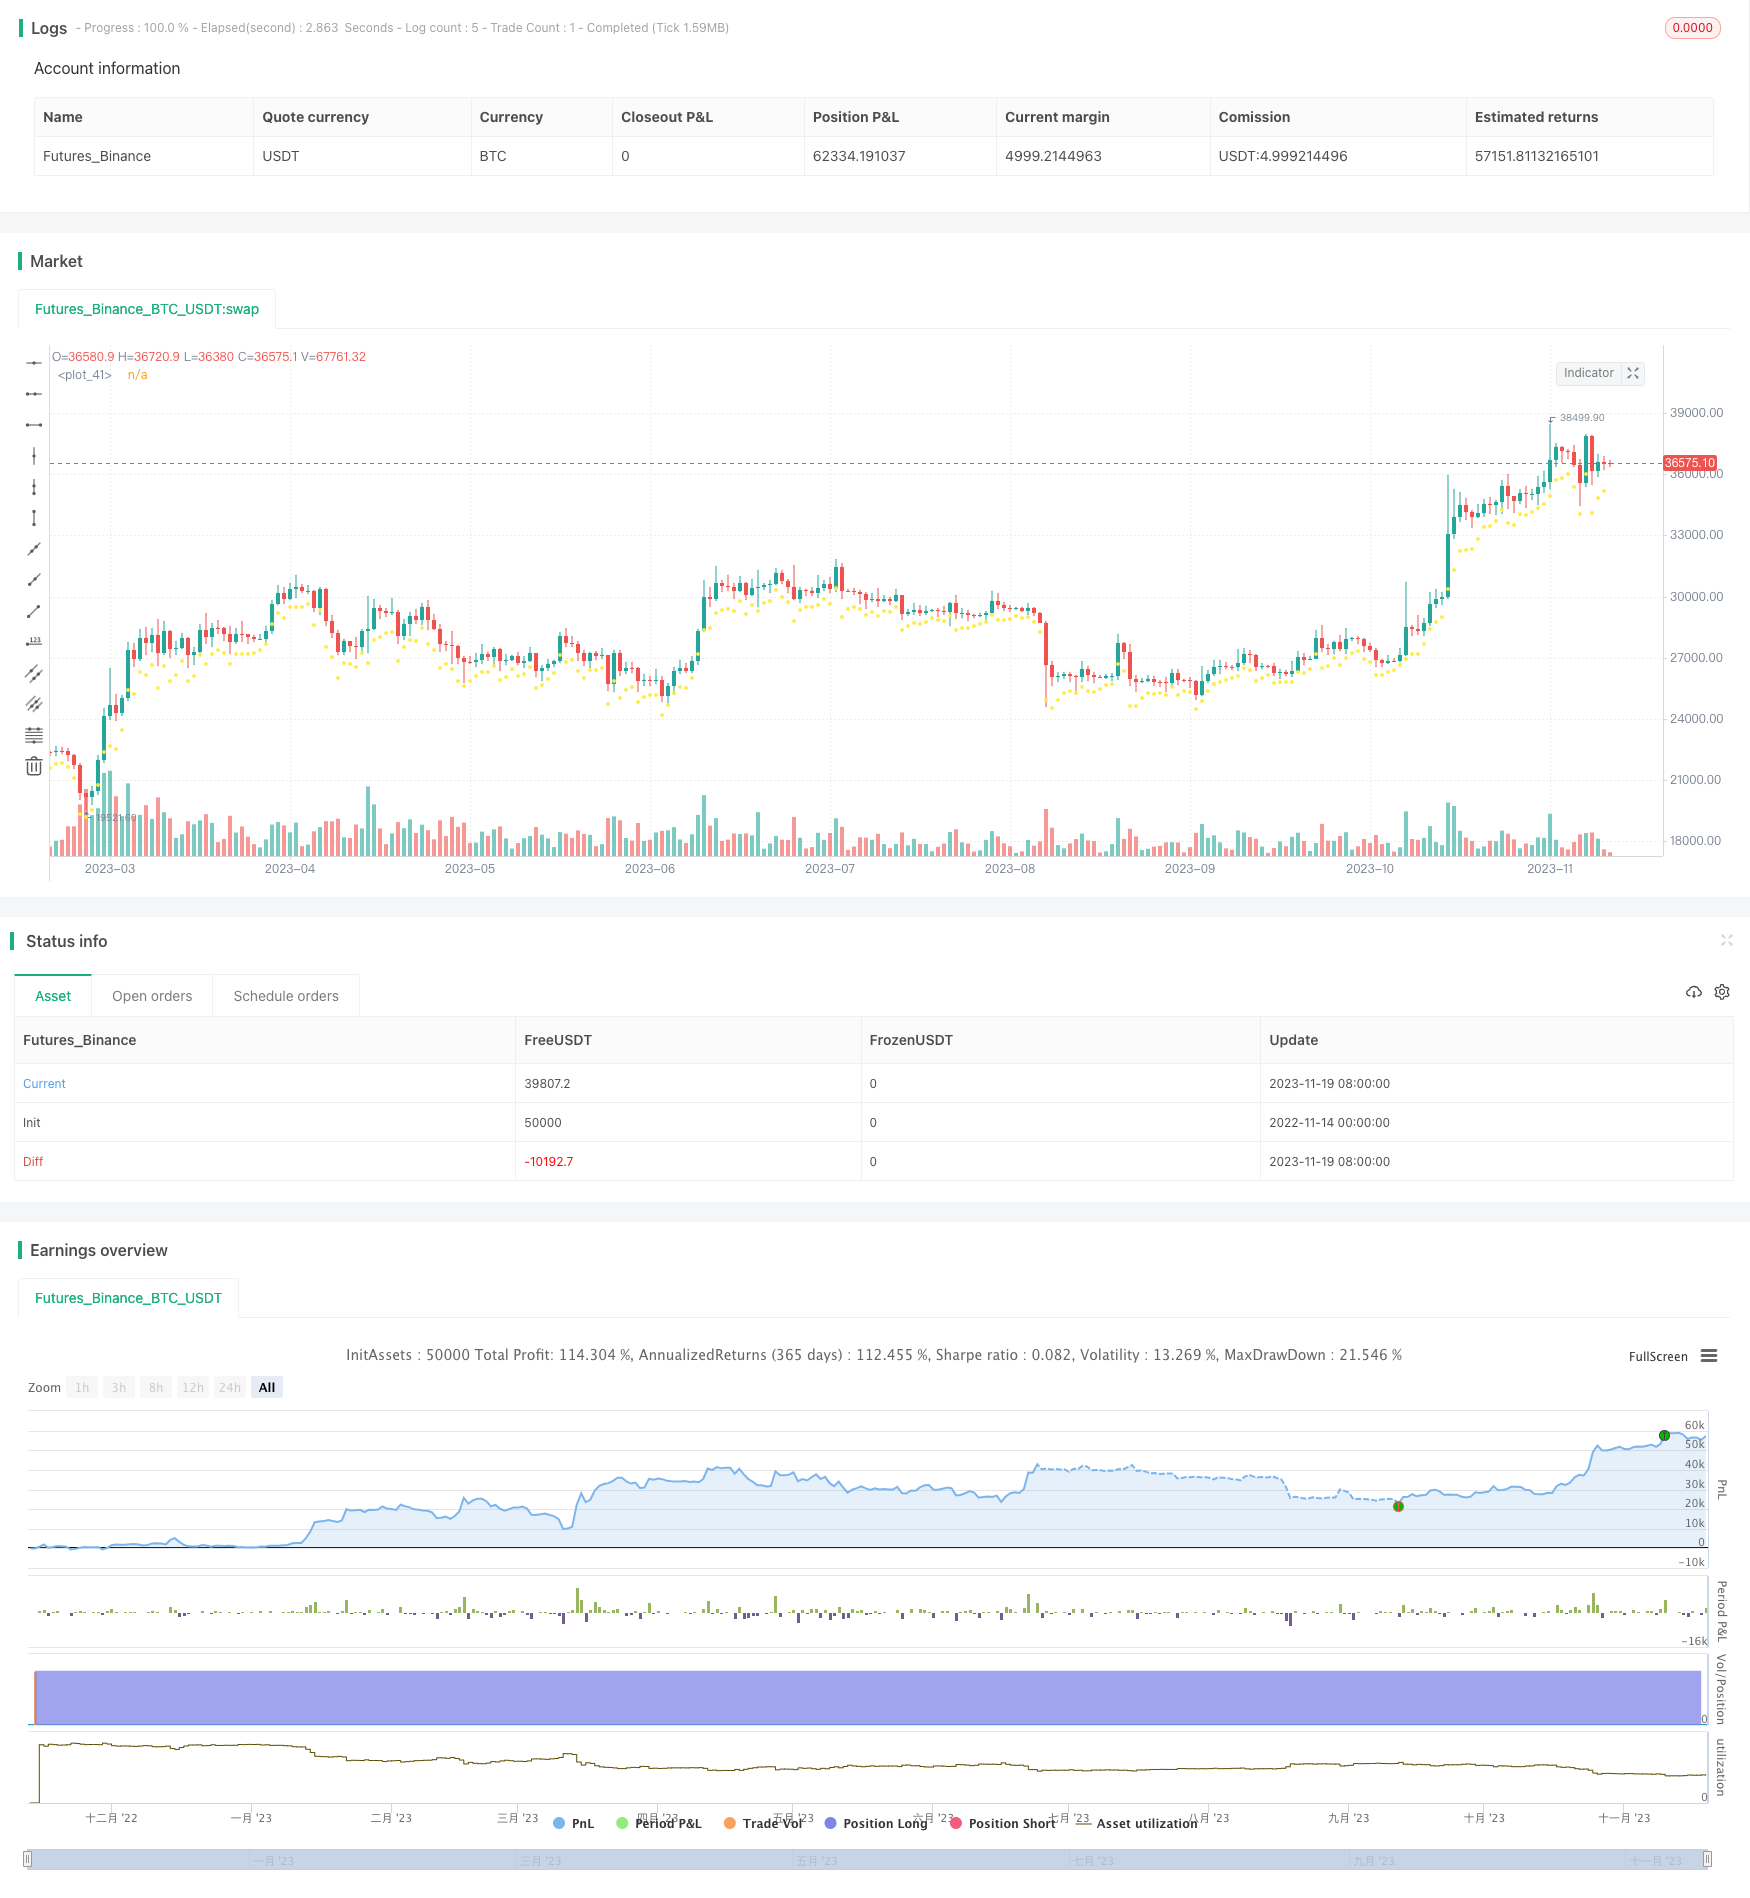
该策略是一个追踪波动率的双向交易策略。它使用平均真实波动率ATR指标来设置止损位,根据价格突破止损位的方向来判断趋势方向。在趋势方向发生转变时,进行反向开仓。
该策略使用3日ATR计算波动率。ATR值乘以一个系数作为止损位。当价格高于止损位时,判断为上升趋势,并在价格向下跌破止损位时平仓;当价格低于止损位时,判断为空头趋势,并在价格向上涨破止损位时平仓。在趋势发生转变时,进行反向开仓。止损位会在趋势保持不变时进行跟踪优化,在趋势转变时重新设置。
- 利用ATR动态跟踪市场波动性,降低了止损位被突破的可能性
- 双向交易,可以在市场双向波动中获利
- 反向开仓点选取在趋势转变初期,增大获利概率
- 市场可能出现剧烈波动,ATR无法充分反映实际波动度,导致止损被突破
- 多头仓位有GAP风险
- 可能频繁小额盈亏交易
针对风险,可以适当加大ATR系数增加止损缓冲区,控制交易频率,设置最小止盈位等。
- 结合其他指标判断趋势转变信号
- ATR参数优化
- 加入交易量控制
本策略整体是一个稳定的双向跟踪止损策略。通过ATR指标动态设置止损位,控制了回撤风险。同时双向交易增加了盈利机会。通过进一步优化,可以使策略更稳定可靠、跟随趋势能力更强。
||
This strategy is a dual-direction trading strategy that tracks volatility. It uses the Average True Range (ATR) indicator to set stop losses and determines the trend direction based on the price breaking through the stop loss level. It opens reverse positions when the trend direction changes.
The strategy uses 3-day ATR to calculate volatility. The ATR value multiplied by a coefficient is used as the stop loss level. When the price is above the stop loss level, it judges it as an uptrend and closes long positions when the price falls below the stop loss level. When the price is below the stop loss level, it judges it as a downtrend and closes short positions when the price rises above the stop loss level. It opens reverse positions when the trend changes. The stop loss level is optimized during trends and reset when trends change.
- Uses ATR to dynamically track market volatility and lower the chance of stop loss being hit
- Dual-direction trading profits from market fluctuation
- Opens reverse positions early in trend changes for higher win rate
- Extreme volatility may cause stop loss fails as ATR lags
- GAP risk exists for long positions
- May trade small profits frequently
To mitigate risks: increase ATR coefficient for wider stop levels, limit trade frequency, set minimum take profit levels, etc.
- Combine other indicators for trend change signals
- Optimize ATR parameters
- Add trade sizing control
This is an overall stable dual-direction trailing stop strategy. ATR sets dynamic stop levels to control drawdowns. Dual-direction trading also increases profit chances. Further optimizations can make the strategy more robust, enhancing trend following capabilities.
[/trans]
Strategy Arguments
| Argument | Default | Description |
|---|---|---|
| v_input_1 | true | From Month |
| v_input_2 | true | From Day |
| v_input_3 | 2017 | From Year |
| v_input_4 | 10 | To Month |
| v_input_5 | true | To Day |
| v_input_6 | 2020 | To Year |
| v_input_7 | 3 | length |
| v_input_8 | true | mult |
| v_input_9 | true | Strategy Direction |
Source (PineScript)
/*backtest
start: 2022-11-14 00:00:00
end: 2023-11-20 00:00:00
period: 1d
basePeriod: 1h
exchanges: [{"eid":"Futures_Binance","currency":"BTC_USDT"}]
*/

//@version=2
strategy("BCH Swinger v1", overlay=true, commission_value = 0.25, default_qty_type=strategy.percent_of_equity, default_qty_value = 100)

/////////////////////////////////////////////////////////////
//START - SET DATE RANGE

// === BACKTEST RANGE ===
FromMonth = input(defval = 1, title = "From Month", minval = 1)
FromDay   = input(defval = 1, title = "From Day", minval = 1)
FromYear  = input(defval = 2017, title = "From Year")
ToMonth   = input(defval = 10, title = "To Month", minval = 1)
ToDay     = input(defval = 01, title = "To Day", minval = 1)
ToYear    = input(defval = 2020, title = "To Year")

startDate = time > timestamp(FromYear, FromMonth, FromDay, 1, 1)
endDate = time < timestamp(ToYear, ToMonth, ToDay, 23, 59)
withinTimeRange = true

/////////////////////////////////////////////////////////////
//END - SET DATE RANGE


/////////////////////////////////////////////////////////////
//START - INDICATORS

length = input(3)
mult = input(1, minval = 0.01)
atr_ = atr(length)
max1 = max(nz(max_[1]), close)
min1 = min(nz(min_[1]), close)
is_uptrend_prev = nz(is_uptrend[1], true)
stop = is_uptrend_prev ? max1 - mult * atr_ : min1 + mult * atr_
vstop_prev = nz(vstop[1])
vstop1 = is_uptrend_prev ? max(vstop_prev, stop) : min(vstop_prev, stop)
is_uptrend = close - vstop1 >= 0
is_trend_changed = is_uptrend != is_uptrend_prev
max_ = is_trend_changed ? close : max1
min_ = is_trend_changed ? close : min1
vstop = is_trend_changed ? is_uptrend ? max_ - mult * atr_ : min_ + mult * atr_ : vstop1
plot(vstop, color = is_uptrend ? yellow : red, style=circles, linewidth=2)

/////////////////////////////////////////////////////////////
//END - INDICATORS


/////////////////////////////////////////////////////////////
//START - TRADING RULES
direction = input(defval=1, title = "Strategy Direction",  minval=-1, maxval=1)
strategy.risk.allow_entry_in(direction == 0 ? strategy.direction.all : (direction < 0 ? strategy.direction.short : strategy.direction.long))

condition1 = close > vstop and withinTimeRange
condition2 = close < vstop and withinTimeRange

strategy.entry("BUY", strategy.long, when = condition1)
strategy.entry("SELL", strategy.short, when = condition2)

/////////////////////////////////////////////////////////////
//END - TRADING RULES
Detail
https://www.fmz.com/strategy/432766
Last Modified
2023-11-21 12:04:19
