Name
双均线交叉交易趋势跟踪策略MACD-Crossover-Trading-Strategy
Author
ChaoZhang
Strategy Description
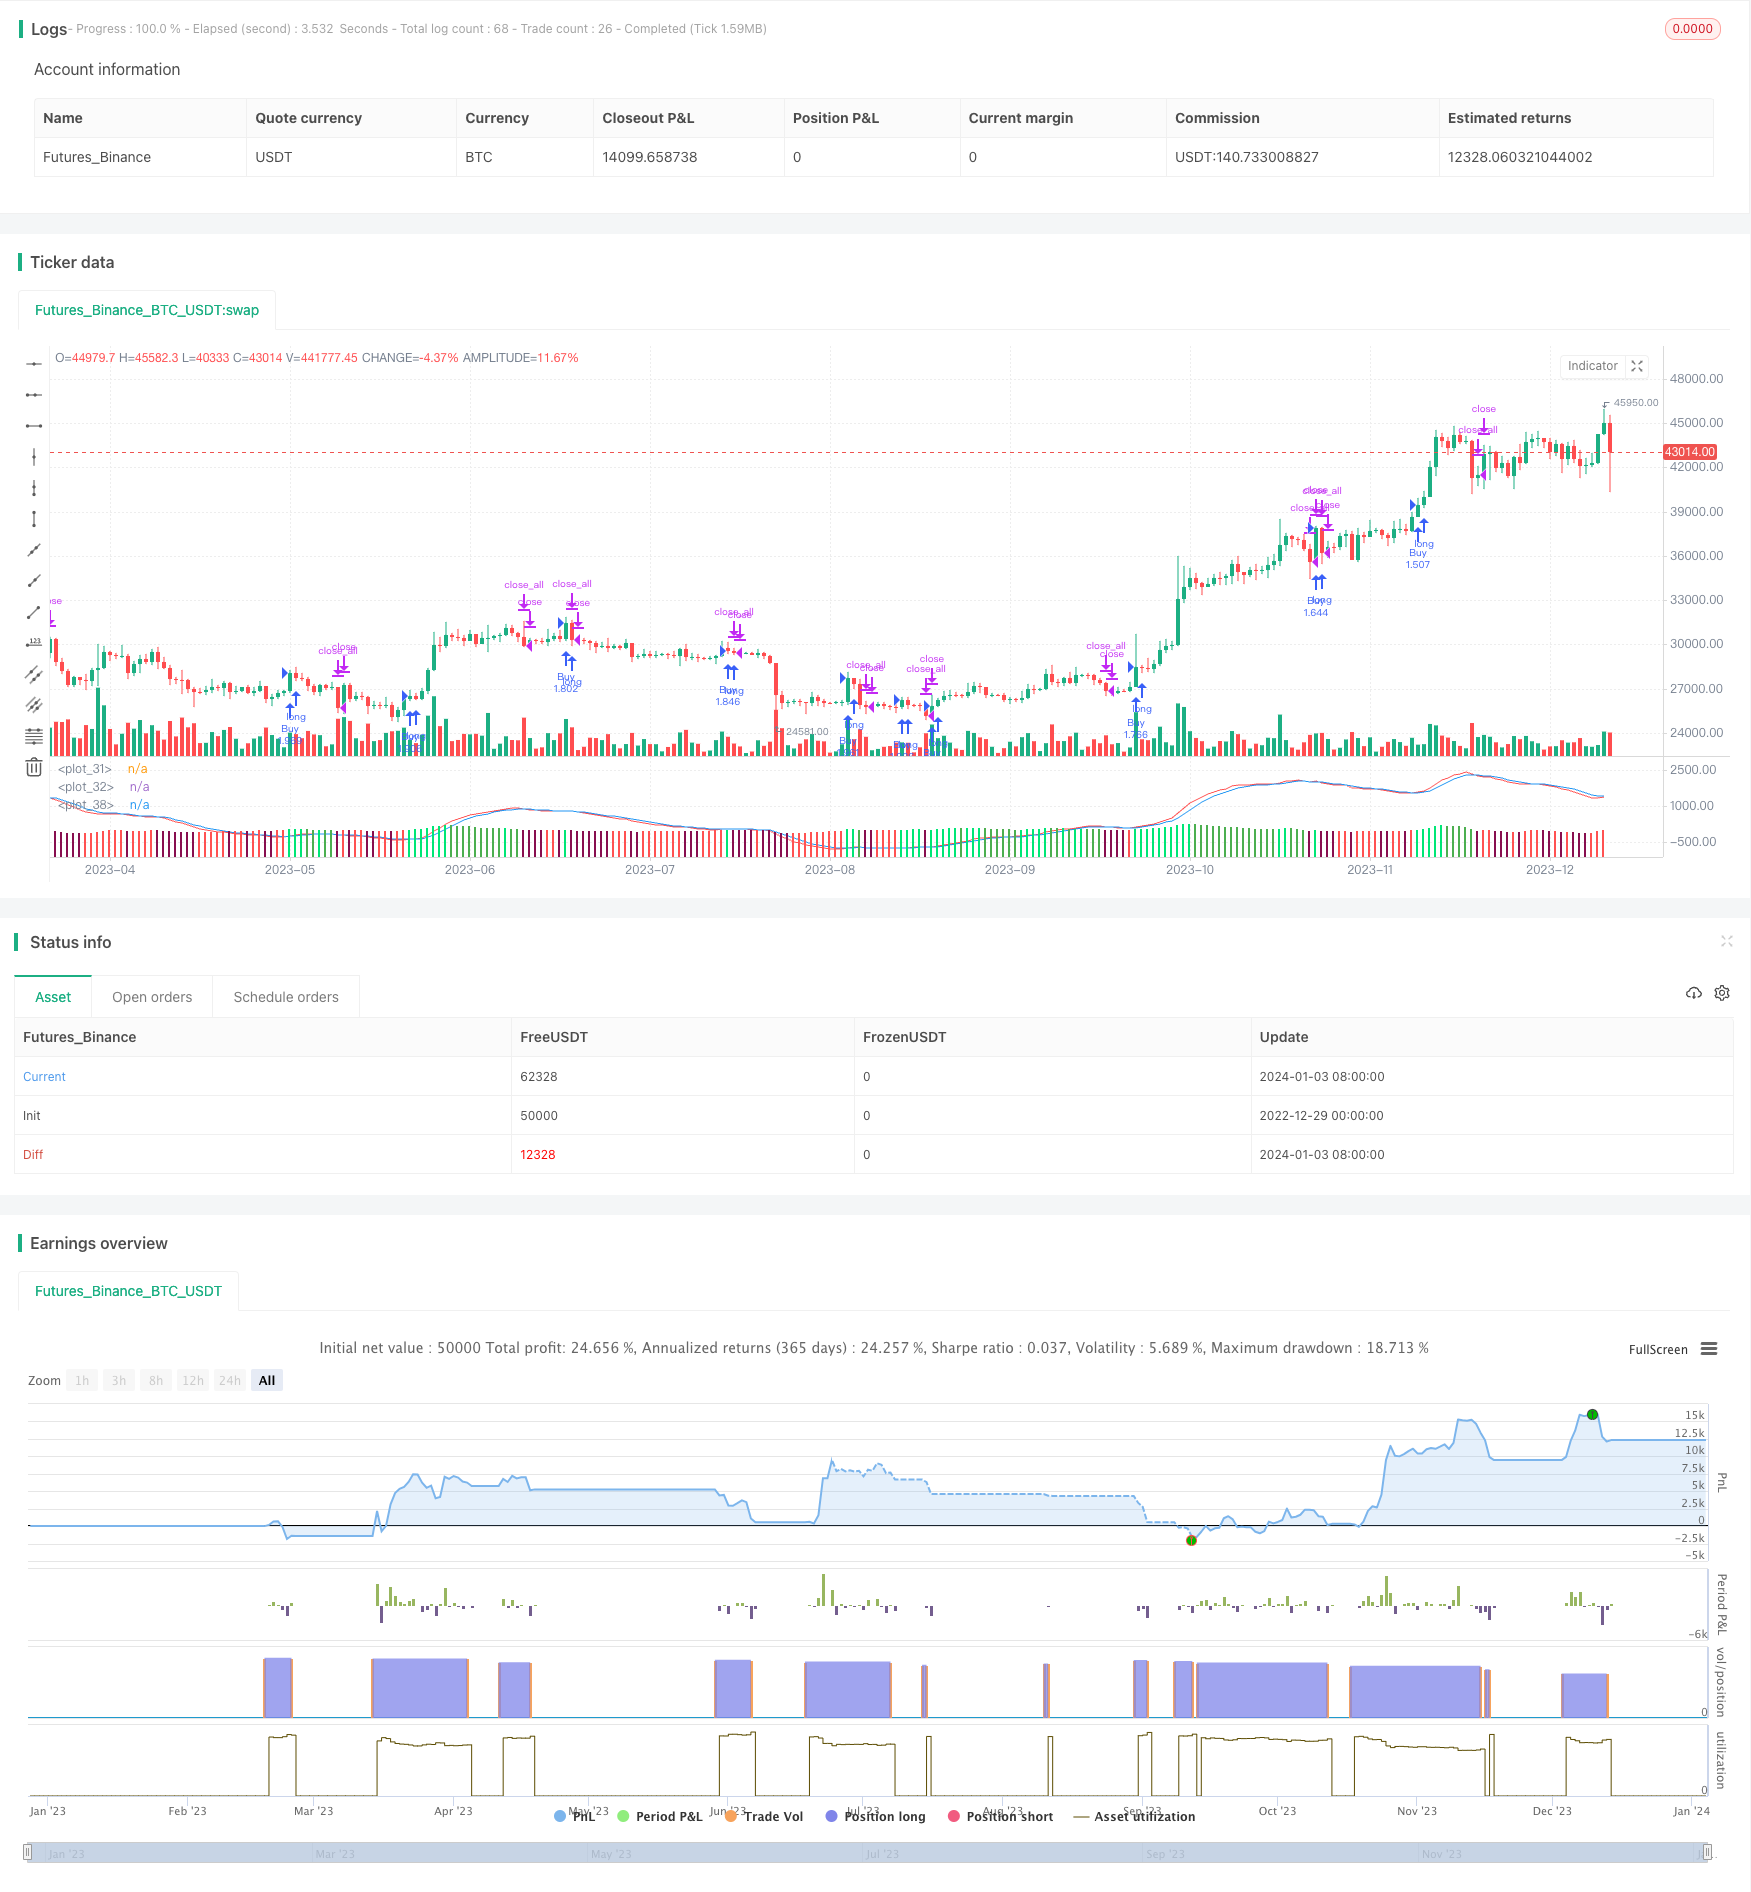
双均线交叉交易策略是一种趋势跟踪策略。它利用快速移动平均线(MACD)和慢速移动平均线的交叉作为买入和卖出信号。当快速移动平均线从下方上扫慢速移动平均线时,产生买入信号;当快速移动平均线从上方下扫慢速移动平均线时,产生卖出信号。
该策略基于MACD指标。MACD指标是两条不同参数的移动平均线的差值,反映价格的动量变化。具体来说,是快速移动平均线(默认参数为12日线)减去慢速移动平均线(默认参数为26日线)得到的差值,称为MACD柱。为了消除震荡,MACD指标中又引入了DEA线或称信号线,一般为MACD的9日加权移动平均线。
当MACD柱从下向上突破DEA线而进入正值区域时,说明短期平均线上扫长期平均线,表明股价趋势转为上升,产生买入信号。当MACD从上向下跌破DEA线而进入负值区域时,表明短期平均线下扫长期平均线,股价趋势转为下降,产生卖出信号。
该策略就是利用MACD柱和DEA线的交叉来判断买入和卖出时机。当MACD柱上扫DEA线时买入,下扫时卖出。
该策略具有以下优势:
- captured 能够顺势而为,及时抓住价格趋势的变化。
- 简单明了,容易理解和实现。
- 参数较为固定,不需要经常调整。
- 可适用于不同时间周期。
该策略也存在一些风险:
- whipsaws 可能产生多次错误信号,即在横盘中反复触发买入卖出。
- lagging 存在一定的滞后性,可能错过价格变化的最佳时机。
- over optimization 参数容易过度优化,实际效果可能不佳。
为了降低风险,可以适当调整参数,或与其它指标结合使用,如量价指标、波动率指标等。此外,合理的止损和止盈策略也很重要。
该策略可从以下几个方面进行优化:
-
参数优化。可以测试不同的参数组合,找到最佳的参数。但要注意避免过度优化。
-
与其它指标组合。可以引入量价指标、波动率指标等,形成更强大的组合策略。
-
止损止盈策略。设定合理的止损止盈点,可以有效控制风险。
-
适配性优化。该策略可以适用于不同市场和时间周期,可以根据实际情况调整。
双均线交叉策略通过捕捉价格趋势的变化,实现低成本的趋势跟踪交易。它简单实用,易于实现,是一种适合新手的入门策略。但该策略也存在一定缺陷,需要注意防范风险。通过不断优化和改进,可以使该策略的实际效果更好,值得推荐。
||
The MACD crossover trading strategy is a trend-following strategy. It uses the crossover of fast and slow moving average lines as buy and sell signals. When the fast moving average line crosses above the slow moving average line, a buy signal is generated. When the fast moving average line crosses below the slow moving average line, a sell signal is generated.
This strategy is based on the MACD indicator. The MACD indicator is the difference between two moving average lines with different parameters, reflecting the changes in the momentum of prices. Specifically, it is the difference between the fast moving average line (default parameter is 12-day line) and the slow moving average line (default parameter is 26-day line), called the MACD bar. To eliminate oscillations, the MACD indicator also introduces a DEA line or signal line, usually the 9-day weighted moving average of the MACD.
When the MACD bar breaks through the DEA line from bottom up and enters the positive area, it indicates that the short-term average line crosses above the long-term average line, indicating that the price trend turns to upward and a buy signal is generated. When the MACD falls from top to bottom through the DEA line and enters the negative area, it indicates that the short-term average line crosses below the long-term average line and the price trend turns to downward, generating a sell signal.
The strategy uses the crossover of the MACD bar and the DEA line to determine the timing of buying and selling. It buys when the MACD bar crosses above the DEA line and sells when the MACD bar crosses below the DEA line.
The advantages of this strategy include:
- Ability to follow the trend and capture price changes in a timely manner.
- Simple and easy to understand and implement.
- Relatively fixed parameters without frequent adjustment.
- Applicable to different timeframes.
This strategy also has some risks:
- May generate multiple false signals or whipsaws in sideways markets.
- Has some lag and may miss the best timing of price changes.
- Parameters are easily overoptimized and actual results may be poor.
To reduce risks, parameters can be adjusted, or combined with other indicators like volume and volatility indicators. In addition, proper stop loss and take profit strategies are also important.
This strategy can be optimized in the following aspects:
-
Parameter optimization to find the optimal parameters while avoiding overoptimization.
-
Combining with other indicators to form more powerful combination strategies.
-
Setting proper stop loss and take profit points to effectively control risks.
-
Adaptive optimization to apply this strategy to different markets and timeframes based on actual conditions.
The MACD crossover trading strategy captures trend changes at a low cost by following price trends. It is simple, practical and easy to implement, making it a suitable starter strategy for beginners. But this strategy also has some flaws. By constantly optimizing and improving, the actual effect of this strategy can be better. It is worth recommending.
[/trans]
Strategy Arguments
| Argument | Default | Description |
|---|---|---|
| v_input_1 | 20 | fastLength |
| v_input_2 | 40 | slowlength |
| v_input_3 | 4 | MACDLength |
| v_input_4 | 2011 | From Year |
| v_input_5 | true | From Month |
| v_input_6 | true | From Day |
| v_input_7 | 9999 | To Year |
| v_input_8 | 12 | To Month |
| v_input_9 | 31 | To Day |
Source (PineScript)
/*backtest
start: 2022-12-29 00:00:00
end: 2024-01-04 00:00:00
period: 1d
basePeriod: 1h
exchanges: [{"eid":"Futures_Binance","currency":"BTC_USDT"}]
*/

//@version=3
strategy("MACD Strategy by Forbes",default_qty_type=strategy.percent_of_equity, default_qty_value=100, overlay=false)

fastLength = input(20)
slowlength = input(40)
MACDLength = input(4)

// === INPUT BACKTEST RANGE ===
FromYear  = input(defval = 2011, title = "From Year", minval = 2009)
FromMonth = input(defval = 1, title = "From Month", minval = 1, maxval = 12)
FromDay   = input(defval = 1, title = "From Day", minval = 1, maxval = 31)
ToYear    = input(defval = 9999, title = "To Year", minval = 2009)
ToMonth   = input(defval = 12, title = "To Month", minval = 1, maxval = 12)
ToDay     = input(defval = 31, title = "To Day", minval = 1, maxval = 31)

// === FUNCTION EXAMPLE ===
start     = timestamp(FromYear, FromMonth, FromDay, 00, 00)  // backtest start window
finish    = timestamp(ToYear, ToMonth, ToDay, 23, 59)        // backtest finish window
window()  => true // create function "within window of time"

MACD = ema(close, fastLength) - ema(close, slowlength)
aMACD = ema(MACD, MACDLength)
delta = MACD - aMACD

// Plot colors
col_grow_above = #26A69A
col_grow_below = #FFCDD2
col_fall_above = #B2DFDB
col_fall_below = #EF5350

f1 = plot(MACD,color=red)
s1 = plot(aMACD,color=blue)
plotColor = if delta > 0
    delta > delta[1] ? lime : green
else
    delta < delta[1] ? maroon : red

plot(delta, color=plotColor, style=columns)

if (crossover(delta, 0))
    strategy.entry("Buy", true, when=window(), comment="Buy")

if (crossunder(delta, 0))
    strategy.close_all(when=window())

//plot(strategy.equity, title="equity", color=red, linewidth=2, style=areabr)
Detail
https://www.fmz.com/strategy/437785
Last Modified
2024-01-05 15:32:06
