Name
双均线交叉多空策略Dual-Moving-Average-Crossover-Trend-Trading-Strategy
Author
ChaoZhang
Strategy Description
[trans]
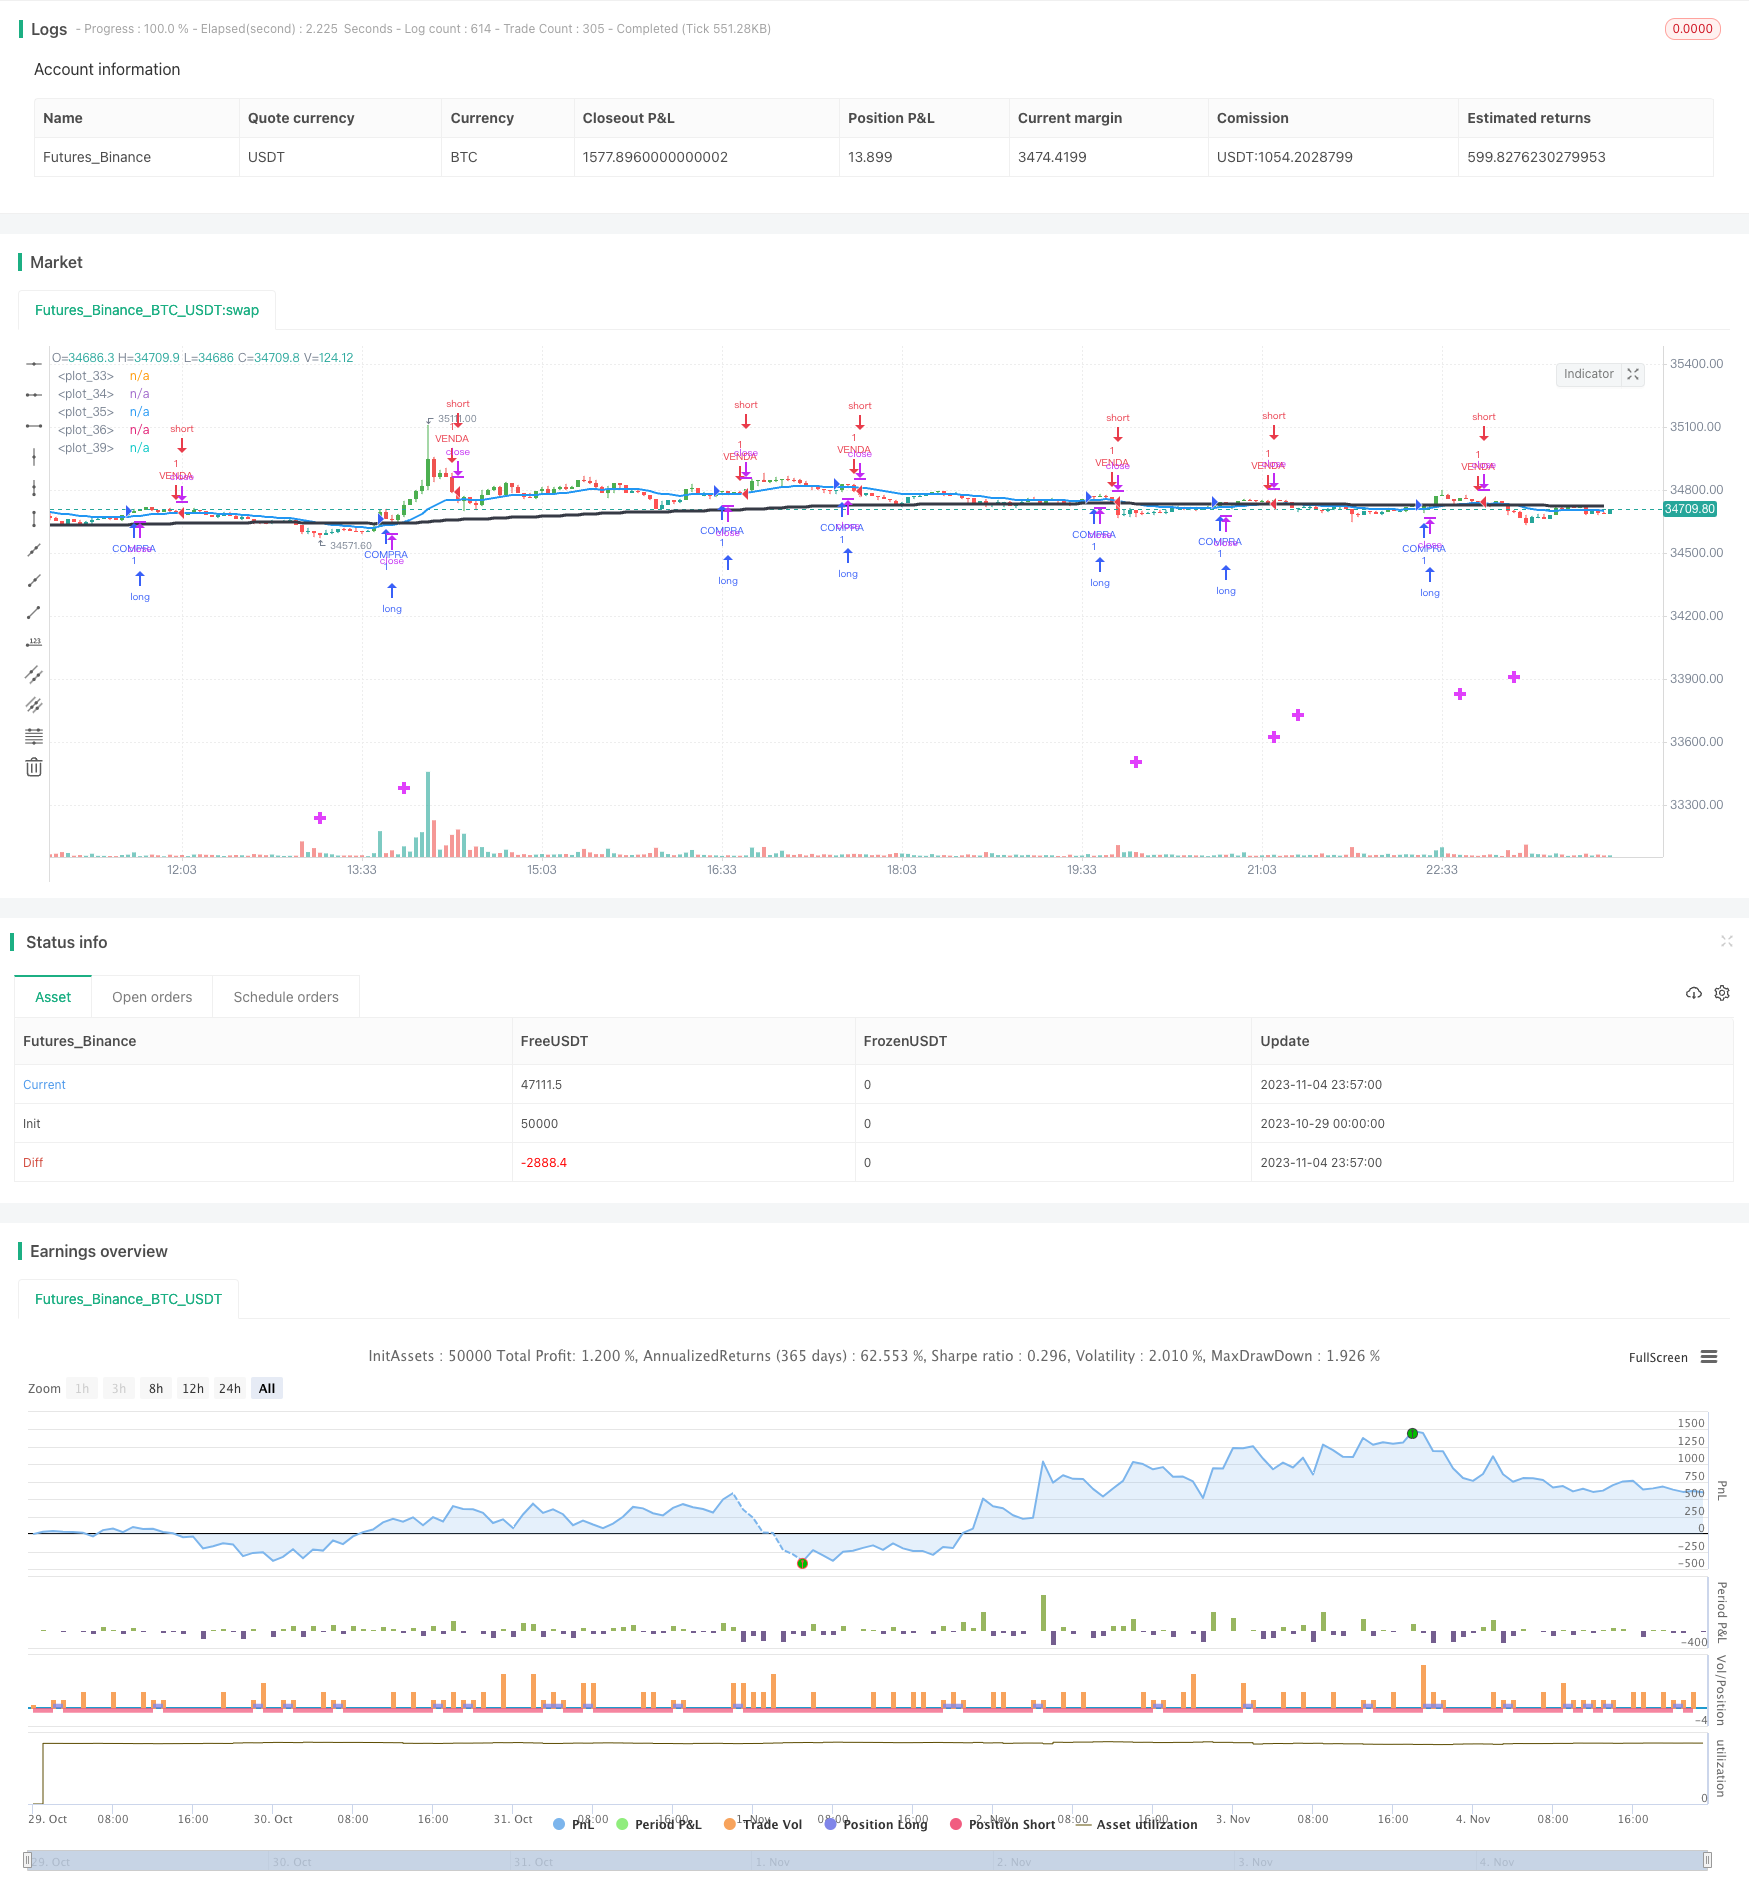
本策略通过计算9日均线、20日均线和200日均线的交叉情况,确定多空方向。它融合了双均线交叉的经典思路,同时增加了200日均线判断长期趋势的手段。这是一个较为稳定可靠的多空策略。
该策略主要通过计算9日均线、20日均线和200日均线的关系,判断价格的多空趋势。
首先,它计算了9日均线和20日均线。如果9日均线上穿20日均线,则为买入信号;如果9日均线下穿20日均线,则为卖出信号。这是双均线交叉中最基础的判断规则。
其次,它又计算了200日均线,作为判断长期趋势的指标。如果20日均线上穿200日均线,则为长期看涨的信号;如果20日均线下穿200日均线,则为长期看跌的信号。
最后,它综合9日均线、20日均线与200日均线的关系,判断具体的买入和卖出时机。只有当9日均线和20日均线同向上穿或同向下穿时,才产生实际的交易信号。
通过计算多个均线的交叉情况,该策略充分利用了均线的趋势跟踪功能,能够有效判断短期和长期的价格走势,从而指导买入卖出操作。
-
1.使用双均线交叉,可以有效抓住中短期价格趋势,实现盈利
-
2.增加200日均线判断,可避免在长期看跌过程中仍做多单,减少损失
-
3.综合多个均线关系,判断信号更可靠,避免增多无效交易
-
4.均线交叉信号明确容易判断,适合手动交易实践
-
5.代码较简单清晰,容易理解实现,可作为量化交易入门策略
-
6.可灵活优化,如调整均线参数或添加其他指标等
-
1.均线策略对参数调整敏感,不同周期均线效果会有很大差异
-
2.双均线交叉只判断中短期趋势,可能错过更长期的大趋势
-
3.交叉信号可能滞后,无法完全避免亏损的单子
-
4.频繁交易增加手续费和滑点,降低实际盈利空间
-
5.代码过于简单,实盘效果可能不佳,有待优化提高
-
1.测试不同均线参数的组合,寻找最优参数
-
2.加入止损策略,严格控制单笔损失
-
3.考虑交易量管理,不同市况下调整仓位
-
4.优化入场,如结合Momentum指标等确认
-
5.优化出场,设定合理的止盈价格
-
6.加入更多指标,判断趋势及回调概率
-
7.加入机器学习模型,寻找更复杂的交易逻辑
本策略综合双均线交叉和长期均线判断的经典思路,利用均线的趋势特征指导买卖决策。它操作简单,容易理解实现,可作为量化交易入门策略。但其参数敏感,存在滞后等问题,有待进一步测试优化。整体来说,该策略提供了一个基础框架,可在此基础上进行扩展提高,开发出更强大的交易系统。投资者可以根据自己的需求,选择适合的元素加入并不断优化策略,以求在量化交易中获得长期稳定的超额收益。
||
This strategy determines market trends by calculating the crossover situations between the 9-day moving average (MA), 20-day MA and 200-day MA. It combines the classic idea of dual MA crossover with the 200-day MA that gauges the long-term trend. This is a relatively stable and reliable trend trading strategy.
This strategy mainly judges price trends by calculating the relationships between the 9-day MA, 20-day MA and 200-day MA.
Firstly, it calculates the 9-day MA and 20-day MA. If the 9-day MA crosses above the 20-day MA, it is a buy signal. If the 9-day MA crosses below the 20-day MA, it is a sell signal. This is the most basic judgment rule of dual MA crossover.
Secondly, it calculates the 200-day MA as an indicator for judging long-term trends. If the 20-day MA crosses above the 200-day MA, it signals a long-term bullish view. If the 20-day MA crosses below the 200-day MA, it signals a long-term bearish view.
Finally, it combines the relationships between the 9-day MA, 20-day MA and 200-day MA to determine specific entry and exit points. Only when the 9-day MA and 20-day MA cross over together in the same direction will actual trading signals be generated.
By calculating the crossover situations between multiple MAs, this strategy makes full use of the trend tracking capability of MAs to effectively determine short-term and long-term price movements, thereby guiding buy and sell operations.
-
Using dual MA crossover can effectively capture mid-short term price trends and generate profits.
-
Adding 200-day MA judgment avoids going long during long-term downtrends, reducing losses.
-
Combining multiple MA relationships makes the signals more reliable and avoids ineffective trades.
-
MA crossover signals are clear and easy to judge, suitable for manual trading practice.
-
The simple and clean code is easy to understand and implement, good for quant trading beginners.
-
Flexible to optimize, like adjusting MA periods or adding other indicators.
-
MA strategies are sensitive to parameter tuning, different MA periods can produce very different results.
-
Dual MA crossover only judges mid-short term trends, may miss longer-term big trends.
-
Crossover signals may lag and cannot completely avoid losing trades.
-
Frequent trading increases commission and slippage costs, reducing actual profit potential.
-
The overly simple code may underperform in live trading, requiring optimization.
-
Test different MA period combinations to find the optimal parameters.
-
Add stop loss strategies to strictly control per trade loss amount.
-
Consider position sizing according to changing market conditions.
-
Optimize entry signals, such as adding Momentum confirmation.
-
Optimize exits by setting reasonable take profit levels.
-
Add more indicators to judge trends and pullback probabilities.
-
Add machine learning models to discover more complex trading logic.
This strategy combines the classic ideas of dual MA crossover and long-term MA trend judgment to guide trading decisions using MA trend-following characteristics. It has simple logic and is easy to understand and implement, good for quant trading beginners. However, it is parameter sensitive and has lagging issues that require further optimization and improvement. Overall, this strategy provides a basic framework that can be extended upon to develop more powerful trading systems. Investors can choose suitable elements to add and continuously optimize the strategy based on their needs, in order to achieve long-term excess returns in quantitative trading.
[/trans]
Source (PineScript)
/*backtest
start: 2023-10-29 00:00:00
end: 2023-11-05 00:00:00
period: 3m
basePeriod: 1m
exchanges: [{"eid":"Futures_Binance","currency":"BTC_USDT"}]
*/

//@version=1
strategy("Dieyson Swingtrade EMA 20+200 and bar & line color", overlay=true)


//bar color rules
Dgbar = close>close[1] and ema(close,20)>ema(close[1],20)
Drbar = close<close[1] and ema(close,20)<ema(close[1],20)

//Barcolors
barcolor(Dgbar ? green : na)
barcolor(Drbar ? red : na)

//MM09 Colorful

MMgreen9 = ema(close,9)>ema(close[1],9) and ema(close,20)>ema(close[1],20)
MMred9 = ema(close,9)<ema(close[1],9) and ema(close,9)<ema(close[1],9)
col8 = (MMgreen9 ? color(green,0) : na)
col28 = (MMred9 ? color(red,0) : na)
col38 = (not MMgreen9 and not MMred9 ? color(black,0) : na)

//plot(ema(close,9), color=col8, style=line, linewidth=1)
//plot(ema(close,9), color=col28, style=line, linewidth=1)
//plot(ema(close,9), color=col38, style=line, linewidth=1)

//MM20 Colorful

MMgreen = ema(close,20)>ema(close[1],20)
MMred = ema(close,20)<ema(close[1],20)
col = (MMgreen ? color(green,0) : na)
col2 = (MMred ? color(red,0) : na)
col3 = (not MMgreen and not MMred ? color(yellow,0) : na)
col4 = color(black,0)
plot(ema(close,20), color=col, style=line, linewidth=2)
plot(ema(close,20), color=col2, style=line, linewidth=2)
plot(ema(close,20), color=col3, style=line, linewidth=2)
plot(ema(close,200), color=col4, style=line, linewidth=3)
//plot(vwap(15), color(white,0), style=line, linewidth=3)
//plot(cross(ema(close,9), ema(close,20)) ? ema(close,9) : na, style = cross,color=fuchsia, transp=0, linewidth = 4)
plot(cross(ema(close,20), ema(close,200)) ? ema(close,20) : na, style = cross,color=fuchsia, transp=0, linewidth = 4)

c = crossover(ema(close,9), ema(close,20)) and ema(close,9) > ema(close,20)
// c = crossover(close, ema (close,9) and ema(close,9) > ema(close[1],9))
v = crossunder(close, ema (close,9))

strategy.entry("COMPRA", strategy.long,when=c)
strategy.entry("VENDA", strategy.short,when=v)
Detail
https://www.fmz.com/strategy/431222
Last Modified
2023-11-06 10:27:00
