Name
双均线均值监控模型Dual-Moving-Average-Monitoring-Model
Author
ChaoZhang
Strategy Description
[trans]
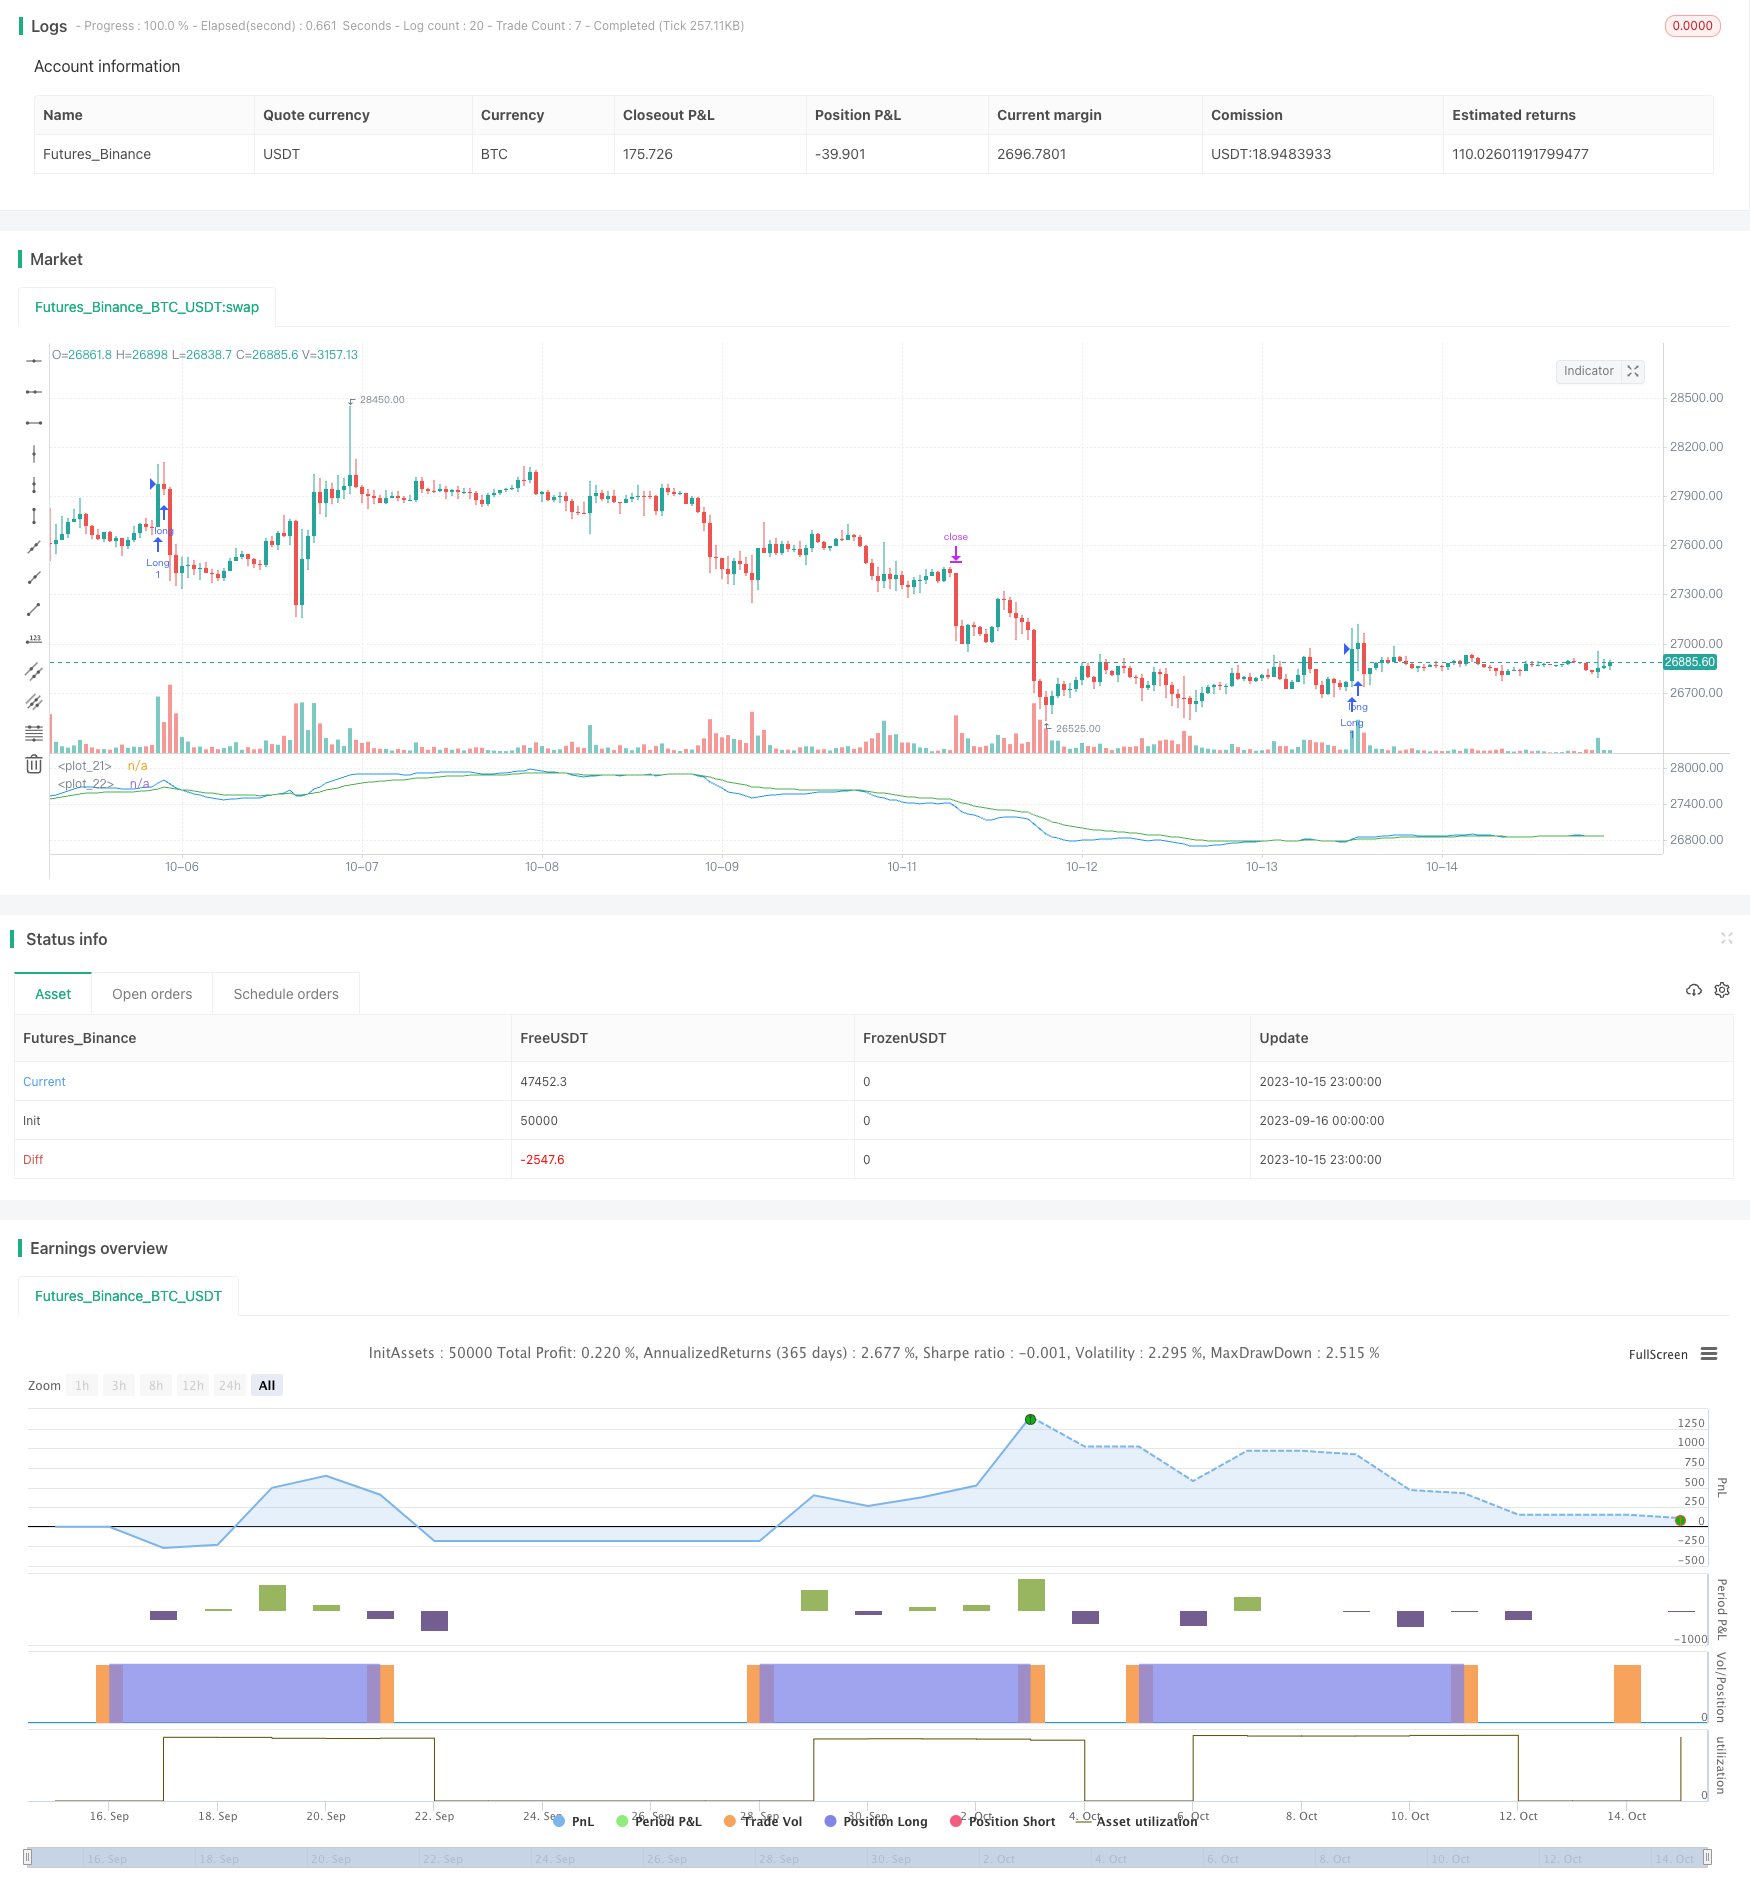
该策略运用双指数移动平均线(EMA)和移动平均线叉点(MACD)的组合指标,发掘短期价值高估股票并进行短线做空,以在股价下跌过程中获利。策略充分利用EMA快速反应价格变化的特点,结合MACD监控动量风向的优势,在牛熊转换点捕捉短期获利机会。
-
计算8日EMA和26日EMA,当8日EMA上穿26日EMA时,视为买入信号。
-
计算12日EMA、26日EMA和差值DEA的9日EMA构成MACD,当MACD上穿DEA时,视为买入信号。
-
买入条件:8日EMA>26日EMA 且 MACD上穿DEA,满足时做多。
-
出场条件:设定浮盈止损为入场价的3%,追踪止损为入场价的1%,满足任一条件时平仓。
该策略同时利用EMA快速响应价格和MACD判断动量方向的特点,在牛转熊的关键点判断操作方向。快速EMA反映较慢EMA对短期内在价值的修正,MACD反映交易力度变化对均线方向的预判,双重指标提高确定交易时点的准确性。
-
EMA和MACD组合提高买卖点确定准确率。EMA捕捉价格变动趋势,MACD判断动量变化方向,两者结合识别短期 extremum,避免假突破带来亏损。
-
追踪止损控制风险,及时止损出场。入场后设置1%的追踪止损,避免亏损扩大。
-
回测数据充分。策略在2022年整个熊市中回测,模拟了实际交易环境。
-
灵活参数调整。止损比例、仓位比例都可自定义,可匹配个人风险偏好。
-
交易频繁,需密切跟踪。使用5分钟周期,出入场频繁,需要足够时间跟进交易。
-
追踪止损可能过于密集出场。追踪止损幅度设置过小,可能过早止损出场。
-
市场处于震荡趋势时效果不佳。EMA和MACD更适合用于较明显的趋势市场。
-
需考虑交易成本。每次交易对应手续费,频繁交易会导致成本增大。
-
调整EMA周期参数,优化买卖时机。可测试缩短快EMA周期,扩大EMA间差异,找出最佳参数组合。
-
优化止损比例,降低止损过早风险。适当放宽追踪止损幅度,避免追踪止损过于激进。
-
测试不同持仓时间,选取最优持仓周期。评估不同持仓时间下策略收益,找出最佳持仓周期。
-
评估增加其他技术指标过滤信号。可测试加入波动率指标等,提高交易决策效果。
该双EMA均线和MACD指标交易策略,旨在捕捉股价短期回落机会进行短线做空获利。它充分利用EMA快速响应和MACD判断力度变化的优势,在双重验证下提高交易时点准确性。策略优化空间在于调整参数、滑点控制、持仓时间等方面,谨慎参数优化后可获得较好收益。
||
This strategy uses a combination of dual exponential moving averages (EMA) and moving average crossover (MACD) indicators to identify overvalued stocks in the short term and take short positions to profit from price declines. The strategy takes full advantage of the EMA's ability to react quickly to price changes and MACD's strength in monitoring momentum direction, capturing short-term profit opportunities at turning points between bulls and bears.
-
Calculate 8-day EMA and 26-day EMA. When 8-day EMA crosses above 26-day EMA, it is considered a buy signal.
-
Calculate MACD with 12-day EMA, 26-day EMA and 9-day EMA of the difference called DEA. When MACD crosses above DEA, it is considered a buy signal.
-
Entry rule: 8-day EMA > 26-day EMA and MACD crosses above DEA, long when both conditions are met.
-
Exit rule: Set trailing stop loss at 3% of entry price, trailing stop loss at 1% of entry price, exit when either is touched.
The strategy utilizes both the fast reaction of EMA to price and MACD's judgment on momentum direction, identifying the key turning points from bull to bear. The fast EMA reflects the correction of short-term intrinsic value against the slower EMA, while MACD reflects changes in trading power anticipating the direction of the moving averages, improving accuracy of capturing trading opportunities using dual indicators.
-
EMA and MACD combination improves accuracy of capturing trading signals. EMA catches price trends while MACD judges momentum direction changes, combined they identify short-term extremums and avoid losses from false breakouts.
-
Trailing stop loss controls risks and exits timely. The 1% trailing stop set after entry avoids loss enlargement.
-
Solid backtest data. Strategy is backtested through the entire bear market in 2022, simulating real trading environments.
-
Flexible parameter tuning. Stop loss ratio, position sizing ratio are customizable to match personal risk preference.
-
Frequent trading requires close tracking. The 5-min timeframe means high frequency of entries and exits, requiring sufficient time to follow up the trades.
-
Trailing stop loss may exit prematurely. Overly tight trailing stop loss could lead to premature exits.
-
Poor performance in ranging markets. EMA and MACD work better for trending markets.
-
Trading costs need consideration. Each trade corresponds to commissions, frequent trading increases costs.
-
Adjust EMA period parameters to optimize entries and exits. Can test shortening fast EMA period, enlarging spread between EMAs to find optimal combinations.
-
Optimize stop loss ratio to lower premature stop risk. Appropriately widening the trailing stop loss avoids overly aggressive stops.
-
Test different holding periods to find optimum. Evaluate returns for different holding periods to identify best holding duration.
-
Evaluate adding other technical filters. Test adding volatility index etc to improve effectiveness of trading decisions.
This dual EMA and MACD trading strategy aims to capture short-term pullback opportunities for shorting and profiting. It fully utilizes the fast reaction of EMA and momentum change judgment strength of MACD to improve accuracy in trade timing with dual confirmation. Optimization spaces lie in parameter tuning, slippage control, holding period etc. Careful parameter optimization can lead to good returns.
[/trans]
Strategy Arguments
| Argument | Default | Description |
|---|---|---|
| v_input_1 | true | Show Date Range |
| v_input_float_1 | 3 | Trail Long Loss (%) |
| v_input_float_2 | true | Trail Short Loss (%) |
Source (PineScript)
/*backtest
start: 2023-09-16 00:00:00
end: 2023-10-16 00:00:00
period: 1h
basePeriod: 15m
exchanges: [{"eid":"Futures_Binance","currency":"BTC_USDT"}]
*/

// This source code is subject to the terms of the Mozilla Public License 2.0 at https://mozilla.org/MPL/2.0/
// © Coinrule

//@version=5
// strategy('Fast EMA above Slow EMA with MACD (by Coinrule)',
//          overlay=true,
//          initial_capital=1000,
//          process_orders_on_close=true,
//          default_qty_type=strategy.percent_of_equity,
//          default_qty_value=30,
//          commission_type=strategy.commission.percent,
//          commission_value=0.1)

showDate = input(defval=true, title='Show Date Range')
timePeriod = time >= timestamp(syminfo.timezone, 2022, 1, 1, 0, 0)
notInTrade = strategy.position_size <= 0

// EMAs
fastEMA = ta.ema(close, 8)
slowEMA = ta.ema(close, 26)
plot(fastEMA, color = color.blue)
plot(slowEMA, color = color.green)
//buyCondition1 = ta.crossover(fastEMA, slowEMA)
buyCondition1 = fastEMA > slowEMA


// DMI and MACD inputs and calculations
[macd, macd_signal, macd_histogram] = ta.macd(close, 12, 26, 9)
buyCondition2 = ta.crossover(macd, macd_signal)


// Configure trail stop level with input options
longTrailPerc = input.float(title='Trail Long Loss (%)', minval=0.0, step=0.1, defval=3) * 0.01
shortTrailPerc = input.float(title='Trail Short Loss (%)', minval=0.0, step=0.1, defval=1) * 0.01

// Determine trail stop loss prices
longStopPrice = 0.0
shortStopPrice = 0.0

longStopPrice := if strategy.position_size > 0
    stopValue = close * (1 - longTrailPerc)
    math.max(stopValue, longStopPrice[1])
else
    0

shortStopPrice := if strategy.position_size < 0
    stopValue = close * (1 + shortTrailPerc)
    math.min(stopValue, shortStopPrice[1])
else
    999999


if (buyCondition1 and buyCondition2 and notInTrade and timePeriod)
    strategy.entry(id="Long", direction = strategy.long)

strategy.exit(id="Exit", stop = longStopPrice, limit = shortStopPrice)


//if (sellCondition1 and sellCondition2 and notInTrade and timePeriod)
//strategy.close(id="Close", when = sellCondition1 or sellCondition2)
Detail
https://www.fmz.com/strategy/429497
Last Modified
2023-10-17 16:33:29
