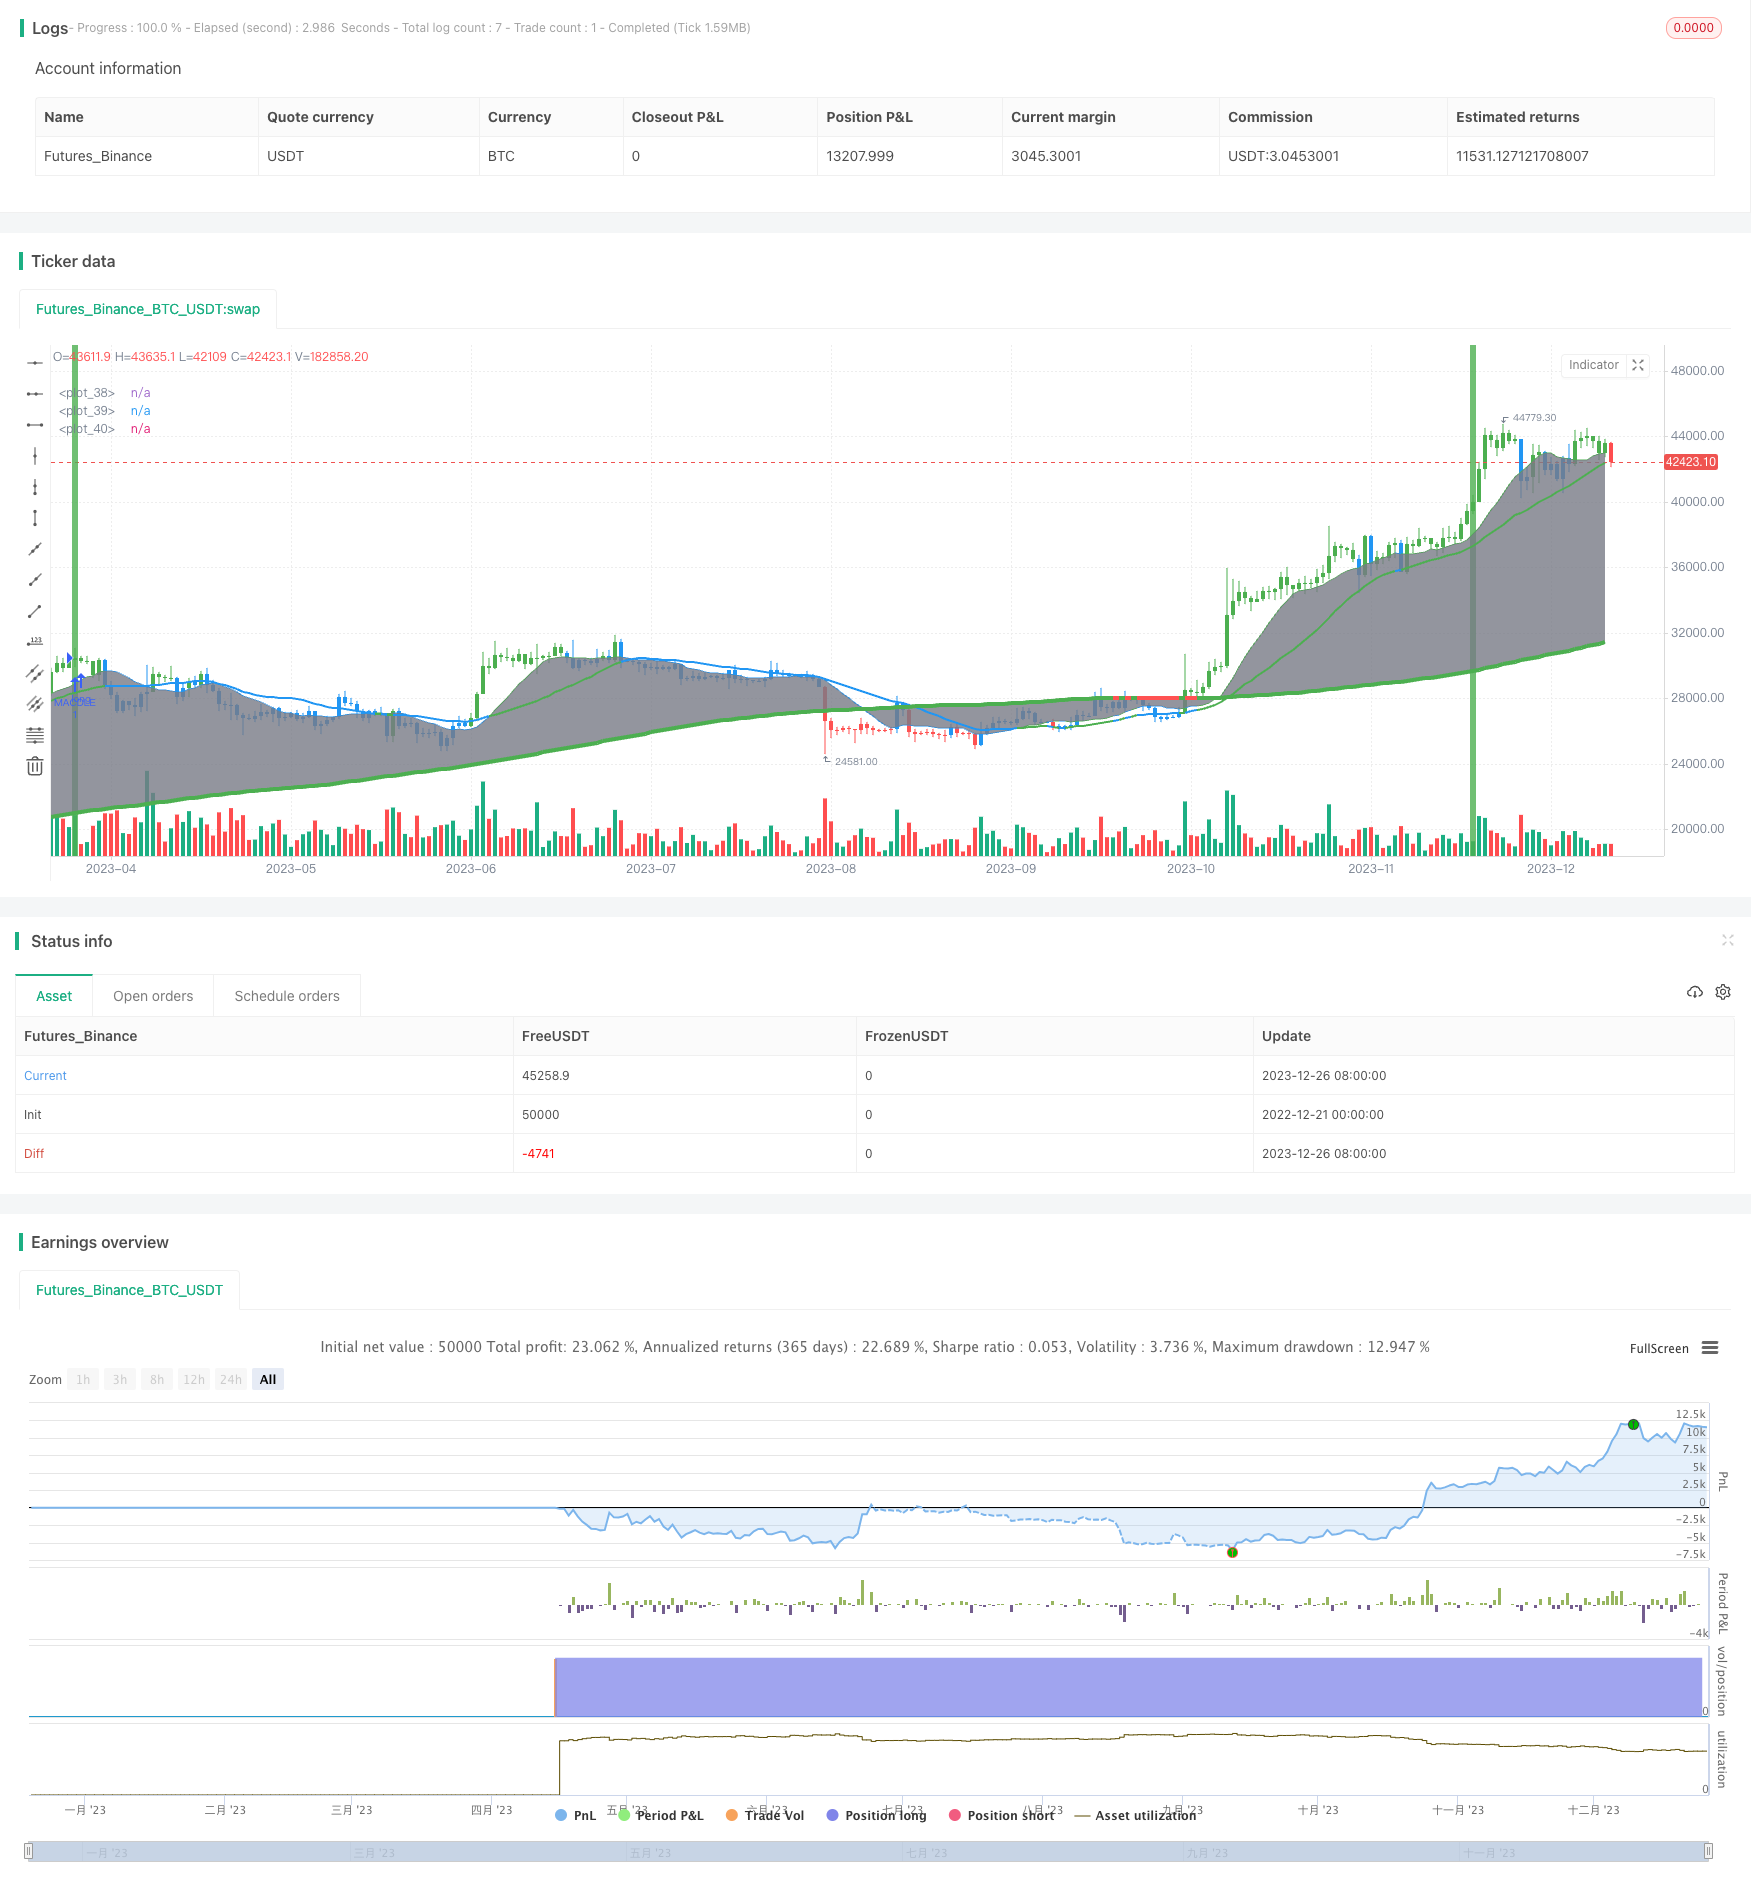
Name
双均线紧缩趋势追踪策略Dual-Moving-Average-Convergence-Trend-Tracking-Strategy
Author
ChaoZhang
Strategy Description
双均线紧缩趋势追踪策略(Dual Moving Average Convergence Trend Tracking Strategy)通过计算快速移动平均线、慢速移动平均线和超慢速移动平均线,结合MACD指标判断价格趋势方向,实现追踪趋势交易。当快慢均线发生黄金交叉时做多,死亡交叉时做空。同时通过长期均线过滤假突破。
该策略首先计算了12日快速移动平均线、26日慢速移动平均线和200日超慢速移动平均线。当快速移动平均线上穿慢速移动平均线时为黄金交叉,表示开始牛市;当快速移动平均线从上向下跌破慢速移动平均线时为死亡交叉,表示开始熊市。策略在发生黄金交叉时做多,发生死亡交叉时做空。
同时,该策略结合MACD指标判断趋势方向。MACD由快线、慢线和MACD柱组成。快线上穿慢线时为多头信号,下穿为空头信号。结合长期均线过滤假信号,只有快线向上突破慢线,MACD柱由负转正,且价格站上200日移动平均线时才发出多头信号;只有快线向下跌破慢线,MACD柱由正转负,且价格跌破200日移动平均线时才发出空头信号。
通过快慢均线系统和MACD指标双重确认,避免因单一指标而产生的假信号,确保只在趋势开始时入场。
-
快慢均线系统和MACD指标双重确认,避免假突破,确保只在趋势开始时入场。
-
200日移动平均线过滤,避免行情震荡期的错误交易。
-
有止损设置,可以限制最大亏损。
-
可以自定义参数,如移动平均线长度、止损水平等,适应不同品种。
-
策略思路清晰简单,容易理解和优化。
-
长期跟踪趋势策略,无法捕捉短期机会。
-
追踪效果取决于参数设定,参数不当将无法正确捕捉趋势。
-
止损位置设定不当可能过于宽松或过于紧张,导致亏损扩大或过早止损。
-
长期持仓较多,需要承受一定的资金压力。
-
优化移动平均线长度参数,寻找最佳参数组合。
-
添加其他指标作为辅助判断信号,如KDJ指标等。
-
优化止损策略,如缩小止损,跟踪止损等方式。
-
根据品种和交易周期调整移动平均线参数。
-
结合量能指标如成交量等过滤假信号。
双均线紧缩趋势追踪策略通过计算多个均线系统判断趋势方向,并利用MACD指标过滤信号,其优势是操作思路简单清晰,风险可控,适合对趋势进行追踪。该策略可通过参数优化、止损策略优化、辅助指标等多种方式进行改进,是一种值得推荐的趋势追踪策略。
||
The Dual Moving Average Convergence Trend Tracking Strategy calculates fast, slow and superslow moving average lines, combined with the MACD indicator to determine price trend direction and implement trend tracking transactions. It goes long when the fast and slow moving averages have golden cross, and goes short when dead cross happens. Use the long term moving average to filter false breaks.
The strategy first calculates the 12-day fast moving average, 26-day slow moving average, and 200-day superslow moving average. When the fast moving average crosses above the slow one, golden cross happens, indicating a bull market. When fast crosses below slow, dead cross happens, indicating a bear market. The strategy goes long on golden crosses and goes short on dead crosses.
The strategy also uses the MACD indicator to determine trend direction. MACD consists of fast line, slow line and MACD bars. When fast line crosses above slow line, it's a bullish signal and when crossing below it's bearish. Combined with the long term moving average to filter false signals, only when fast line breaks up slow line, MACD bar turns from negative to positive, and price stands above 200-day MA, long signal triggers. Only when fast line breaks down slow line, MACD bar turns from positive to negative and price drops below 200-day MA, short signal triggers.
With dual confirmation from moving averages system and MACD indicator, false breaks can be avoided and ensure entering at trend start.
-
Dual confirmation avoids false breaks, ensuring entering at trend start.
-
200-day MA filters erroneous trades during market fluctuations.
-
Stop loss set to limit maximum loss.
-
Customizable parameters like MA lengths, stop loss level, etc. to adapt to different products.
-
Simple and clear logic, easy to understand and optimize.
-
Long term trend tracking unable to capture short term opportunities.
-
Tracking effect depends on parameter settings. Wrong parameters fail to capture trends.
-
Improper stop loss setting may be too loose or too tight, enlarging loss or stopping out prematurely.
-
Long holding periods lead to certain capital pressure.
-
Optimize MA lengths parameter for best parameter combination.
-
Add other indicators like KDJ for auxiliary judgement.
-
Optimize stop loss strategies like tighten stops, trailing stops etc.
-
Adjust MA parameters based on product and timeframe.
-
Add volume filter to avoid false signals.
The Dual MA Convergence Trend Tracking Strategy judges trend direction by calculating multiple MA systems and uses MACD filter. Its advantages are simple and clear logic, controllable risks, suitable for trend tracking. It can be improved by parameters optimization, stop loss optimization, adding auxiliary indicators etc. A recommendable trend tracking strategy.
[/trans]
Strategy Arguments
| Argument | Default | Description |
|---|---|---|
| v_input_1_close | 0 | source: close |
| v_input_2 | 12 | MACD fast moving average |
| v_input_3 | 26 | MACD slow moving average |
| v_input_4 | 9 | MACD signal line moving average |
| v_input_5 | 200 | Very slow moving average |
| v_input_6 | true | Enable Bar Color? |
| v_input_7 | true | Enable Moving Averages? |
| v_input_8 | true | Enable Background Color? |
Source (PineScript)
/*backtest
start: 2022-12-21 00:00:00
end: 2023-12-27 00:00:00
period: 1d
basePeriod: 1h
exchanges: [{"eid":"Futures_Binance","currency":"BTC_USDT"}]
*/

//@version=2
strategy("Trend Strategy", shorttitle="TSTrend Strategy", overlay=true)


// Trend Strategy
// If the inverse logic is true, the strategy
// goes short. For the worst case there is a
// max intraday equity loss of 50% filter.


// Input
source = input(close)
fastLength = input(12, minval=1, title="MACD fast moving average")
slowLength=input(26,minval=1, title="MACD slow moving average")
signalLength=input(9,minval=1, title="MACD signal line moving average")
veryslowLength=input(200,minval=1, title="Very slow moving average")
switch1=input(true, title="Enable Bar Color?")
switch2=input(true, title="Enable Moving Averages?")
switch3=input(true, title="Enable Background Color?")

// Calculation
fastMA = sma(source, fastLength)
slowMA = sma(source, slowLength)
veryslowMA = sma(source, veryslowLength)
macd = fastMA - slowMA
signal = sma(macd, signalLength)
hist = macd - signal

// Colors
MAtrendcolor = change(veryslowMA) > 0 ? green : red
trendcolor = fastMA > slowMA and change(veryslowMA) > 0 and close > slowMA ? green : fastMA < slowMA and change(veryslowMA) < 0 and close < slowMA ? red : blue
bartrendcolor = close > fastMA and close > slowMA and close > veryslowMA and change(slowMA) > 0 ? green : close < fastMA and close < slowMA and close < veryslowMA and change(slowMA) < 0 ? red : blue
backgroundcolor = slowMA > veryslowMA and crossover(hist, 0) and macd > 0 and fastMA > slowMA and close[slowLength] > veryslowMA ? green : slowMA < veryslowMA and crossunder(hist, 0) and macd < 0 and fastMA < slowMA and close[slowLength] < veryslowMA ? red : na
bgcolor(switch3?backgroundcolor:na,transp=80)
barcolor(switch1?bartrendcolor:na)

// Output
F=plot(switch2?fastMA:na,color=trendcolor)
S=plot(switch2?slowMA:na,color=trendcolor,linewidth=2)
V=plot(switch2?veryslowMA:na,color=MAtrendcolor,linewidth=4)
fill(F,V,color=gray)

// Strategy
buyprice = low
sellprice = high
cancelLong = slowMA < veryslowMA
cancelShort = slowMA > veryslowMA

if (cancelLong)
    strategy.cancel("MACDLE")

if crossover(hist, 0) and macd > 0 and fastMA > slowMA and close[slowLength] > veryslowMA
    strategy.entry("MACDLE", strategy.long, stop=buyprice, comment="Bullish")

if (cancelShort)
    strategy.cancel("MACDSE")

if crossunder(hist, 0) and macd < 0 and fastMA < slowMA and close[slowLength] < veryslowMA
    strategy.entry("MACDSE", strategy.short, stop=sellprice, comment="Bearish")

// maxIdLossPcnt = input(50, "Max Intraday Loss(%)", type=float)
// strategy.risk.max_intraday_loss(maxIdLossPcnt, strategy.percent_of_equity)

//plot(strategy.equity, title="equity", color=red, linewidth=2, style=areabr)
Detail
https://www.fmz.com/strategy/436899
Last Modified
2023-12-28 17:24:53
