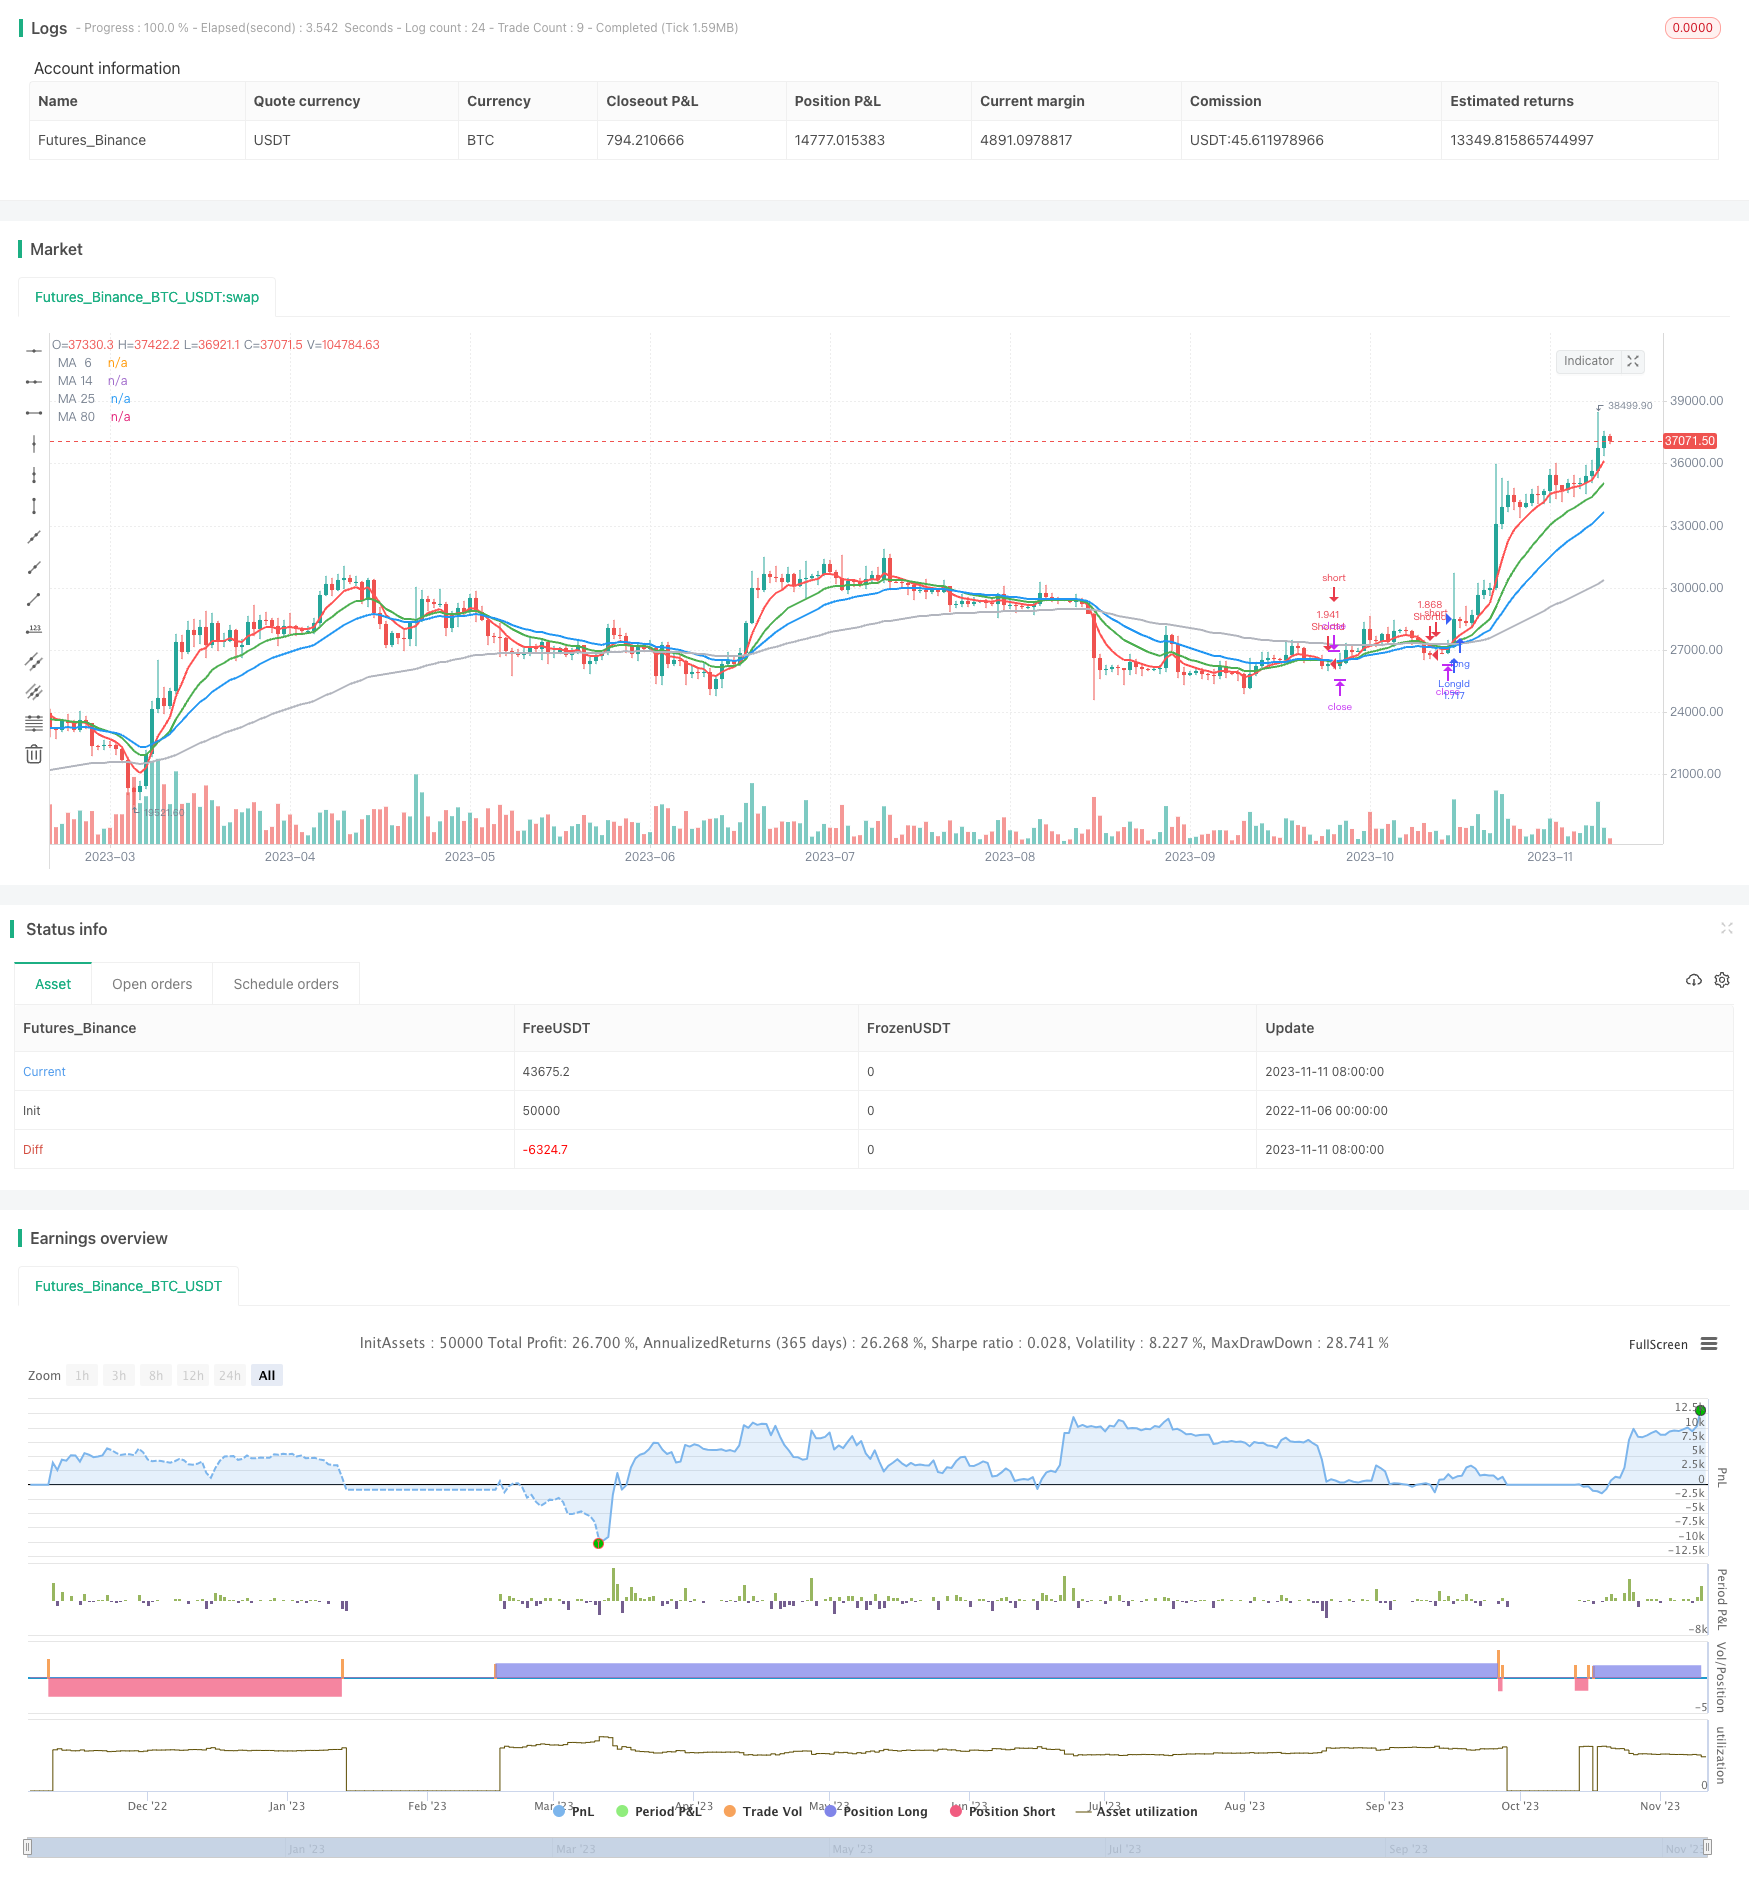
Name
双均线金叉死叉趋势追踪策略Dual-Moving-Average-Crossover-Strategy
Author
ChaoZhang
Strategy Description
双均线金叉死叉策略是一种比较常见的趋势追踪策略。该策略使用两条不同周期的均线,根据它们的交叉情况来判断行情趋势并进行交易。具体来说,当短周期均线上穿长周期均线时,产生金叉信号,认为行情进入上涨趋势,可以买入;当短周期均线下穿长周期均线时,产生死叉信号,认为行情进入下跌趋势,可以卖出。
该策略主要使用6周期、14周期、25周期以及80周期的EMA均线。策略首先计算这4条均线的值,然后根据6周期EMA与其他三条均线的交叉情况来判断行情走势。
当6周期EMA上穿14周期或25周期EMA,并且6周期EMA高于80周期EMA时,产生买入信号。这表示短期均线正在突破中长期均线,行情可能进入上涨趋势,因此可以考虑买入。
相反,当6周期EMA下穿14周期或25周期EMA,并且低于80周期EMA时,产生卖出信号。这表示短期均线被中长期均线突破,行情可能进入下跌趋势,因此可以考虑卖出。
交易信号产生后,策略会开仓买入或卖出。此外,策略还设置了止损逻辑,当亏损超过设置的止损比例时,策略会退出仓位,以控制风险。
该策略具有以下优势:
-
使用均线交叉判断趋势,是一种较为成熟和可靠的技术指标。
-
同时结合多周期均线,可以减少误判概率。6周期均线负责产生交易信号,14周期、25周期均线作为确认,80周期均线判断整体趋势。
-
设置止损来控制亏损风险,可以有效保护资金。
-
策略逻辑简单清晰,易于理解和验证。
-
可根据市场情况调整均线周期,优化策略参数。
该策略也存在一些风险:
-
在震荡行情中,均线可能产生多次无效交叉,带来过多无效交易。可以适当调整均线周期优化。
-
固定的止损方式可能过于机械,可改为追踪止损或动态止损。
-
大幅度跳空导致止损被突破的风险。可结合附加条件判断跳过止损。
-
无法响应短期价格波动。可结合其他指标过滤交易信号。
-
参数优化空间有限。可尝试改进为自适应均线。
该策略可以从以下几个方面进行优化:
-
测试不同的均线周期组合,找到对市场更敏感的周期参数。
-
改进止损机制,使用追踪止损或动态止损,减小止损被突破的概率。
-
增加其他指标进行滤波,如KDJ、MACD等,避免在震荡中产生过多无效交易。
-
优化入场条件,待均线完全交叉后再入场,减少假信号。
-
使用自适应均线,根据市场波动自动调整均线周期参数。
-
新增仓位管理机制,根据市场情况调整仓位。
-
添加止盈退出机制。
综上所述,该双均线金叉死叉策略通过简单的均线交叉原理判断行情趋势,易于实现,风险可控,适用于追踪中长期趋势。但该策略可优化空间较大,可从入场条件、止损方式、指标过滤等方面进行改进,使策略更适应市场环境。整体来说,该策略作为基础趋势跟随策略,优势和风险都在可控范围内,值得学习和实践。
||
The Dual Moving Average Crossover Strategy is a common trend following strategy. It uses two moving averages of different periods to identify trend direction and generate trading signals based on their crossover. Specifically, when the shorter period moving average crosses above the longer period one, a golden cross is formed, indicating an upward trend. Oppositely, when the shorter MA crosses below the longer MA, a death cross is formed, indicating a downward trend.
The strategy mainly utilizes 6-period, 14-period, 25-period and 80-period EMA lines. It first calculates these MA values, then identifies trend direction based on the crossover between the 6-period EMA and the other three MAs.
When the 6-period EMA crosses above either the 14-period or 25-period EMA, and it is above the 80-period EMA, a buy signal is generated. This indicates the short-term MA is breaking the medium to long-term MAs, and an upward trend may start, so we can consider buying.
Conversely, when the 6-period EMA crosses below either the 14-period or 25-period EMA, and it is below the 80-period EMA, a sell signal is generated. This indicates the short-term MA is broken by medium to long-term MAs, and a downward trend may start, so we can consider selling.
Upon signal generation, the strategy will open long or short positions. It also has a stop loss logic to exit positions when loss exceeds a threshold to control risk.
The advantages of this strategy are:
-
Using MA crossover to determine trend is a mature and reliable technical indicator.
-
Combining multiple timeframes reduces false signals. The 6-period MA generates signals, while the 14-period, 25-period MAs confirm, and the 80-period MA defines overall trend.
-
The stop loss controls risk and protects capital effectively.
-
The logic is simple and clear, easy to understand and validate.
-
MA periods can be tuned to optimize for changing market conditions.
Some risks of this strategy include:
-
Price may whipsaw around MAs during ranging, generating excessive invalid signals. MA periods can be adjusted accordingly.
-
Fixed stop loss may be too rigid. Consider using trailing stop or dynamic stop instead.
-
Risk of stop loss being hit by sudden price gaps. Add additional logic to skip stop loss in such cases.
-
Unable to respond to short-term price fluctuations. Add filters using other indicators.
-
Limited optimization space. Consider using adaptive moving averages.
Some ways to optimize the strategy:
-
Test different MA period combinations to find parameters more sensitive to the market.
-
Improve stop loss mechanism using trailing or dynamic stops to reduce stop run risk.
-
Add filter indicators like KDJ, MACD to avoid excessive trades during ranging.
-
Optimize entry rules, wait for MA crossover to fully form before entering to reduce false signals.
-
Employ adaptive moving averages that automatically adjust periods based on volatility.
-
Add position sizing rules to adjust position size based on market conditions.
-
Incorporate profit taking exits.
In summary, this dual moving average crossover strategy identifies trend direction easily based on simple MA crossover logic, and has controllable risk. It is suitable for tracking medium to long term trends. But the strategy has ample room for optimization, via entry rules, stop loss techniques, filter conditions etc. Overall it serves as a solid baseline trend following strategy, with reasonable pros and cons. It is worth learning and practicing.
[/trans]
Strategy Arguments
| Argument | Default | Description |
|---|---|---|
| v_input_1 | 2018 | Backtest Start Year |
| v_input_2 | true | Backtest Start Month |
| v_input_3 | true | Backtest Start Day |
| v_input_4 | true | UseStopLoss |
| v_input_5 | 20 | Stop loss percentage(0.1%) |
| v_input_6_close | 0 | MA Source: close |
| v_input_7 | 6 | MA Period 6 |
| v_input_8 | 14 | MA Period 14 |
| v_input_9 | 25 | MA Period 25 |
| v_input_10 | 80 | MA Period 80 |
Source (PineScript)
/*backtest
start: 2022-11-06 00:00:00
end: 2023-11-12 00:00:00
period: 1d
basePeriod: 1h
exchanges: [{"eid":"Futures_Binance","currency":"BTC_USDT"}]
*/

//@version=3
strategy(title = " bhramaji EMA Cross Strategy", shorttitle = "EMA Cross",calc_on_order_fills=true,calc_on_every_tick =true, initial_capital=21000,commission_value=.25,overlay = true,default_qty_type = strategy.percent_of_equity, default_qty_value = 100)
StartYear = input(2018, "Backtest Start Year")
StartMonth = input(1, "Backtest Start Month")
StartDay = input(1, "Backtest Start Day")
UseStopLoss = input(true,"UseStopLoss")


stopLoss = input(20, title = "Stop loss percentage(0.1%)")


maSource   = input(defval = close, title = "MA Source")
maLength6   = input(defval = 6, title = "MA Period 6", minval = 1)
maLength14  = input(defval = 14, title = "MA Period 14", minval = 1)
maLength25  = input(defval = 25, title = "MA Period 25", minval = 1)
maLength80  = input(defval = 80, title = "MA Period 80", minval = 1)

ma6 = ema(maSource, maLength6)
ma14 = ema(maSource, maLength14)
ma25 = ema(maSource, maLength25)
ma80 = ema(maSource, maLength80)

ma_6_plot = plot(ma6 , title = "MA  6", color = red, linewidth = 2, style = line, transp = 50)
ma14_plot = plot(ma14, title = "MA 14", color = green, linewidth = 2, style = line, transp = 50)
ma25_plot = plot(ma25, title = "MA 25", color = blue, linewidth = 2, style = line, transp = 50)
ma80_plot = plot(ma80, title = "MA 80", color = silver, linewidth = 2, style = line, transp = 50)


longEMA = (crossover(ma6, ma14) or crossover(ma6, ma25)) and (ma6>ma80)
exitLong = (crossunder(ma6, ma14) or crossunder(ma6, ma25))

shortEMA = (crossunder(ma6, ma14) or crossunder(ma6, ma25)) and (ma6< ma80)
exitShort =(crossover(ma6, ma14) or crossover(ma6, ma25))

if (longEMA)
    strategy.entry("LongId", strategy.long)

if (shortEMA)
    strategy.entry("ShortId", strategy.short)

if (UseStopLoss)
    strategy.exit("StopLoss", "LongId", loss = close * stopLoss / 1000 / syminfo.mintick)
    strategy.exit("StopLoss", "ShortId", loss = close * stopLoss / 1000 / syminfo.mintick)
Detail
https://www.fmz.com/strategy/431910
Last Modified
2023-11-13 10:55:09
