Name
双指数移动平均线交叉策略Dual-Exponential-Moving-Average-Crossover-Strategy
Author
ChaoZhang
Strategy Description
[trans]
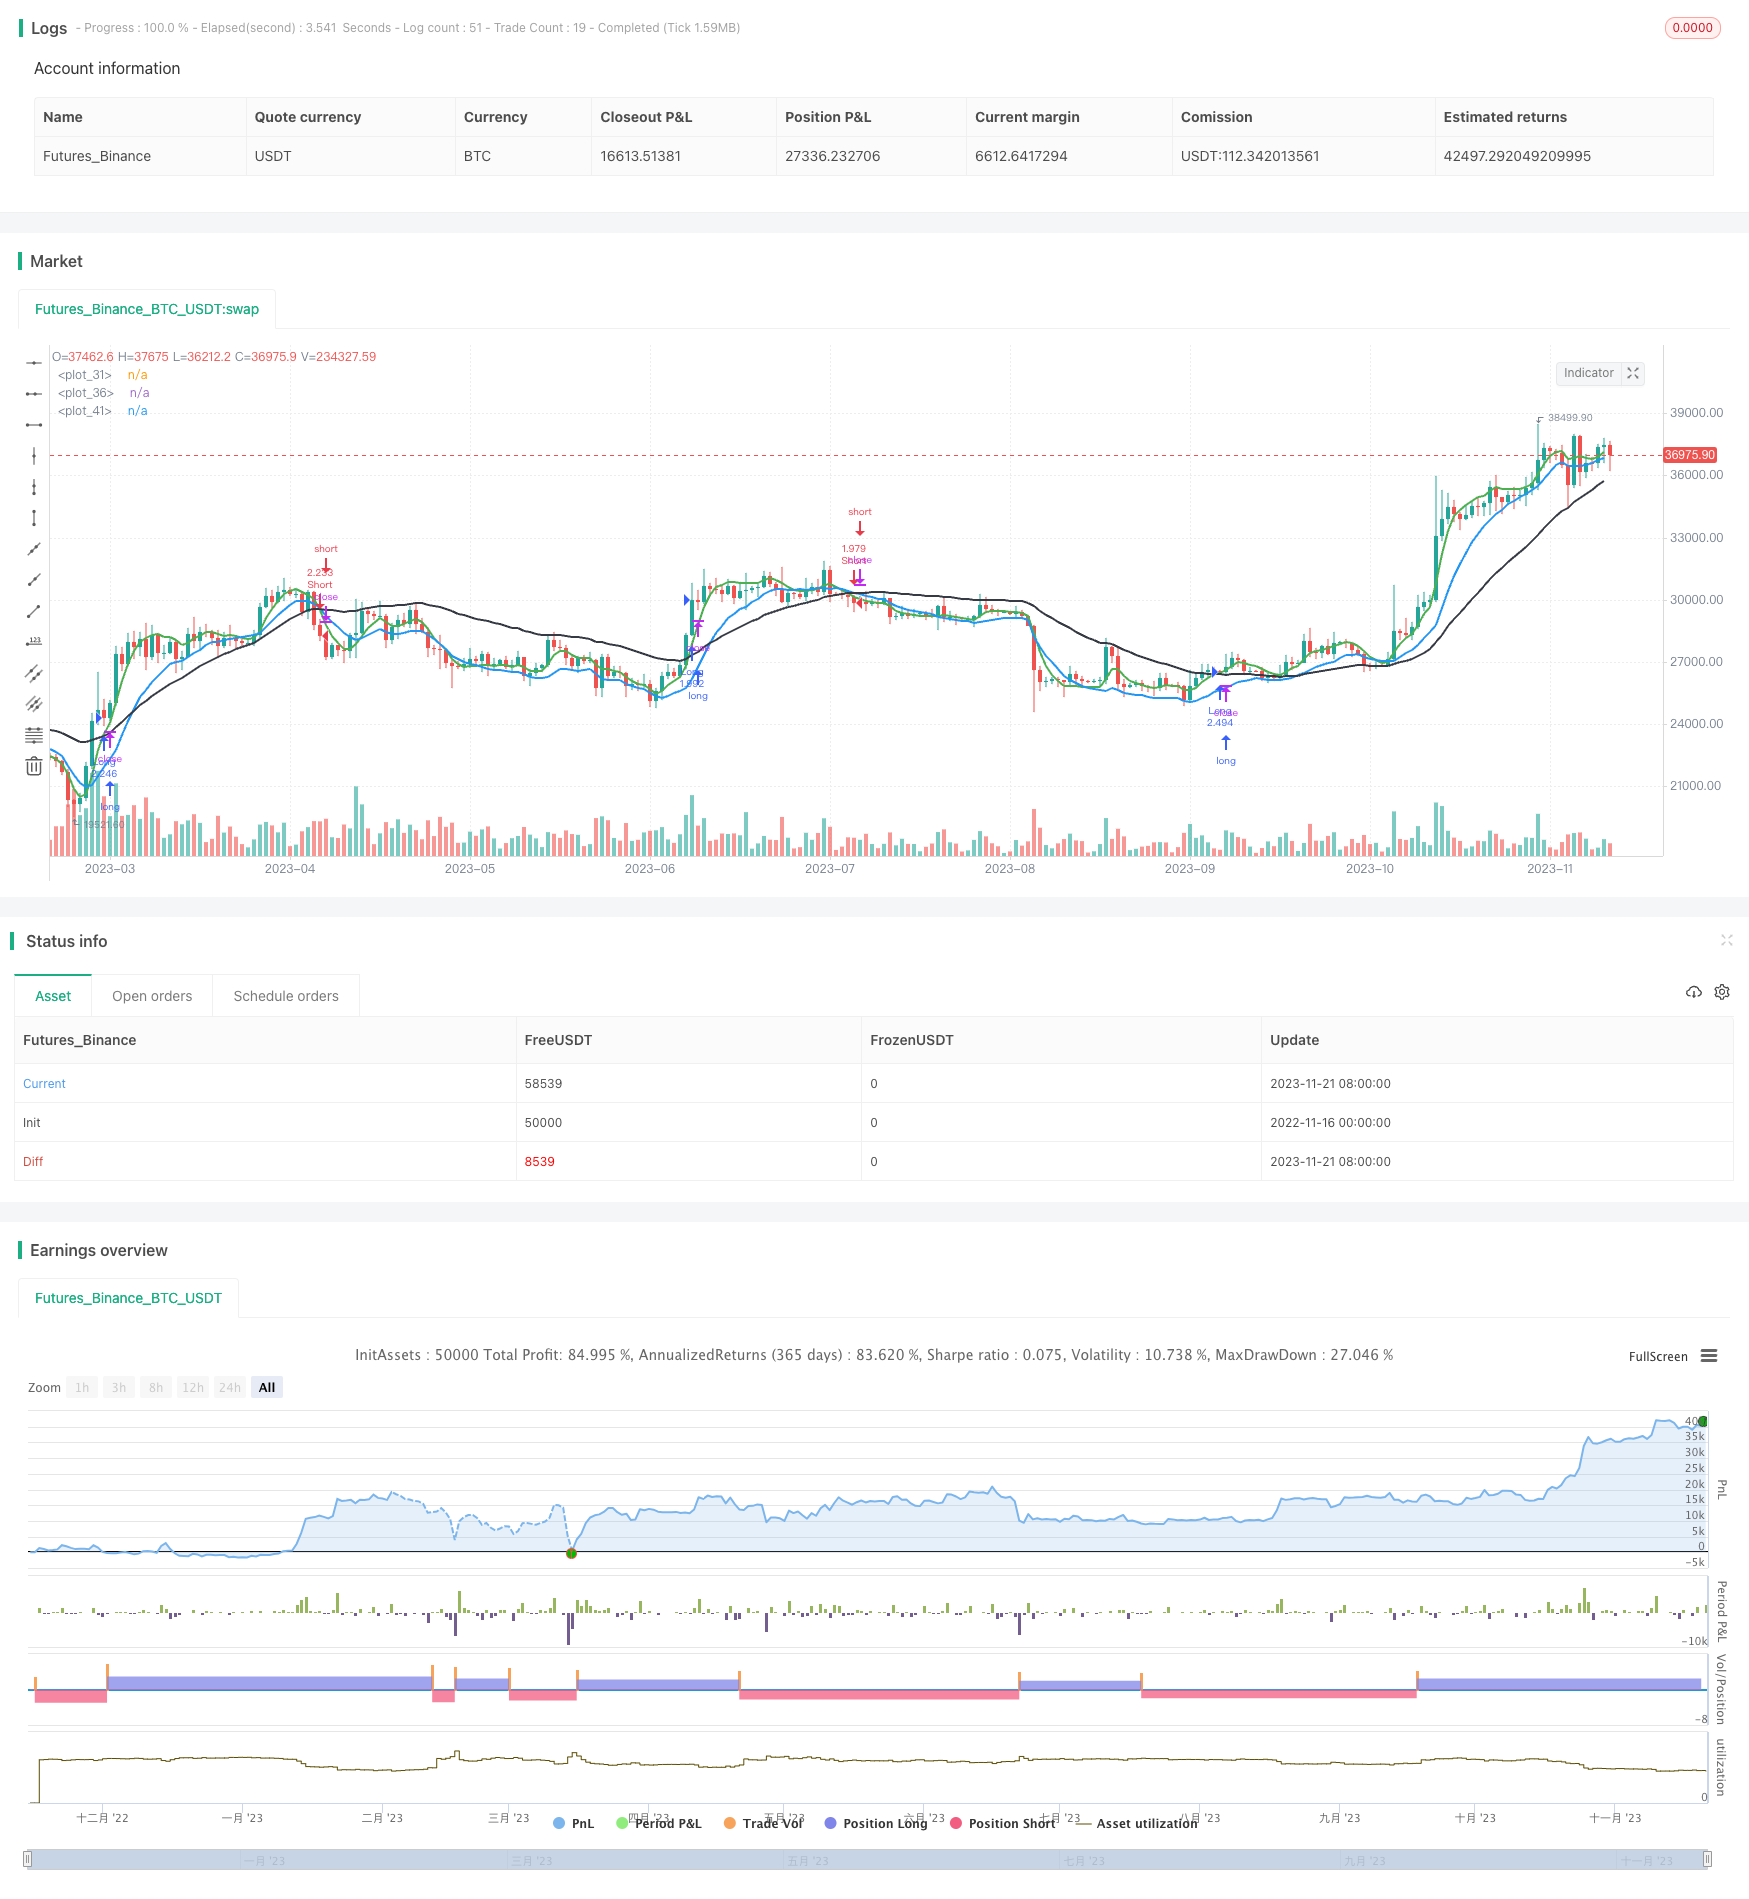
双指数移动平均线交叉策略(Dual Exponential Moving Average Crossover Strategy)是一种典型的趋势跟踪策略。它利用不同参数的双指数移动平均线的金叉和死叉来判断行情趋势,并相应做多做空。
该策略同时使用3条不同参数的双指数移动平均线:DEMA(8)、DEMA(20)和 DEMA(63)。其中:
- DEMA(8)反应最快,用于捕捉短期趋势;
- DEMA(20)速度稍慢,用于识别中期趋势;
- DEMA(63)反应最慢,用于判断长期趋势方向。
当快线DEMA(8)上穿中线DEMA(20)和慢线DEMA(63)时,表示行情由下向上反转,做多;当快线DEMA(8)下穿中线DEMA(20)和慢线 DEMA(63)时,表示行情由上向下反转,做空。
相比单一移动平均线,双指数移动平均线对价格变化更为敏感,可以更早发现趋势转折点。该策略综合多个时间段双指数线,能够有效跟踪市场趋势方向。
多时间段DEM线组合,提高了交易信号质量,避免了假突破。同时,策略只在三条线发生交叉时才产生信号,避免过于频繁交易。
该策略主要面临以下风险:
- 三条线交叉信号较少,容易漏过部分交易机会;
- 行情剧烈波动时,DEM线交叉延迟,无法及时反应价格变化;
- 无法有效应对特大的非趋势性行情。
可通过优化移动平均线参数、添加过滤条件等方式进一步改进和控制风险。
该策略可从以下几个方面进行优化:
- 优化移动平均线参数,使其更符合不同市场的特点;
- 增加成交量、波动率等过滤条件,避免错误信号;
- 结合其他指标过滤假信号,例如MACD、KDJ等;
- 增加止损策略,控制单笔亏损;
- 优化仓位管理,让盈利比例大于亏损比例。
双指数移动平均线交叉策略整体思路清晰,通过多时间段DEM的组合使用,有效判断市场趋势方向,是一种典型的趋势跟踪策略。该策略可根据实际需要,通过参数优化、增加过滤条件、止损管理等方式进行改进,从而获得更好的策略效果。
||
The Dual Exponential Moving Average Crossover Strategy is a typical trend-following strategy. It uses the golden cross and dead cross of Double Exponential Moving Averages (DEMA) with different parameters to determine market trends and make corresponding long and short positions.
The strategy uses 3 DEMAs simultaneously with different parameters: DEMA(8), DEMA(20) and DEMA(63). Among them:
-
DEMA(8) reacts the fastest to capture short-term trends;
-
DEMA(20) moves slightly slower to identify medium-term trends;
-
DEMA(63) reacts the slowest to judge the long-term trend direction.
When the fast line DEMA(8) crosses above the medium line DEMA(20) and the slow line DEMA(63), it indicates that the market turns from bottom to top, long position should be made. When DEMA(8) crosses below DEMA(20) and DEMA(63), it indicates that the market turns from top to bottom, short position should be made.
Compared with single moving average, double exponential moving average is more sensitive to price changes and can detect turning points of trends earlier. This strategy combines multiple timeframes of DEMAs, which can effectively track the market trend direction.
The combination of multi-timeframe DEM lines improves the quality of trading signals and avoids false breakouts. At the same time, the strategy only generates signals when the three lines cross, avoiding excessive frequency of trading.
The main risks of this strategy are:
- Fewer cross signals of the three lines may miss some trading opportunities.
- DEM lines crossing delay may fail to respond price change timely when market fluctuates violently.
- It cannot cope with huge non-trending markets effectively.
The risks can be further improved and controlled by optimizing parameters, adding filter conditions etc.
The strategy can be optimized from the following aspects:
- Optimize the moving average parameters to make them fit different market characteristics better.
- Add filters like volume, volatility to avoid wrong signals.
- Combine other indicators like MACD, KDJ to filter fake signals.
- Add stop loss strategy to control single loss.
- Optimize position management to make the profit ratio greater than loss ratio.
The DEMA crossover strategy has a clear overall idea. By combining multi-timeframe DEMAs, it can effectively determine the market trend direction and is a typical trend-following strategy. The strategy can be improved by parameter optimization, adding filters, stop loss management etc. according to actual needs, so as to obtain better strategy results.
[/trans]
Strategy Arguments
| Argument | Default | Description |
|---|---|---|
| v_input_1 | 8 | short |
| v_input_2_ohlc4 | 0 | Source Dema 1: ohlc4 |
| v_input_3 | 20 | long |
| v_input_4_low | 0 | Source Dema 2: low |
| v_input_5 | 63 | long2 |
| v_input_6_close | 0 | Source Dema 3: close |
Source (PineScript)
/*backtest
start: 2022-11-16 00:00:00
end: 2023-11-22 00:00:00
period: 1d
basePeriod: 1h
exchanges: [{"eid":"Futures_Binance","currency":"BTC_USDT"}]
*/

// This source code is subject to the terms of the Mozilla Public License 2.0 at https://mozilla.org/MPL/2.0/
// © Noldo

//@version=4
//Quoted by Author HighProfit

//Lead-In
strategy("Double Exponential Moving Average 8-20-63 Strategy",
         shorttitle="DEMA-8-20-63",
         overlay=true,
         max_bars_back = 5000,
         initial_capital=100000,
         max_bars_back = 5000,
         default_qty_type=strategy.percent_of_equity,
         default_qty_value=100,
         commission_type=strategy.commission.percent,
         commission_value=0.1,
         pyramiding = 0)

short = input(8, minval=1)
srcShort = input(ohlc4, title="Source Dema 1")

long = input(20, minval=1)
srcLong = input(low, title="Source Dema 2")

long2 = input(63, minval=1)
srcLong2 = input(close, title="Source Dema 3")
e1 = ema(srcShort, short)
e2 = ema(e1, short)
dema1 = 2 * e1 - e2
plot(dema1, color=color.green, linewidth=2)

e3 = ema(srcLong, long)
e4 = ema(e3, long)
dema2 = 2 * e3 - e4
plot(dema2, color=color.blue, linewidth=2)

e5 = ema(srcLong2, long2)
e6 = ema(e5, long2)
dema3 = 2 * e5 - e6
plot(dema3, color=color.black, linewidth=2)

longC  = dema1 > dema2 and dema1 > dema3
shortC = dema1 < dema2 and dema1 < dema3

alertlong  = longC and  not longC[1]
alertshort = shortC and not shortC[1]


strategy.entry("Long" , strategy.long , when = longC ,comment="Long")
strategy.entry("Short", strategy.short, when = shortC,comment="Short")

// Alerts

alertcondition(longC  , title='Long' , message=' Buy  Signal ')
alertcondition(shortC , title='Short', message=' Sell Signal ')
Detail
https://www.fmz.com/strategy/433029
Last Modified
2023-11-23 17:34:06
