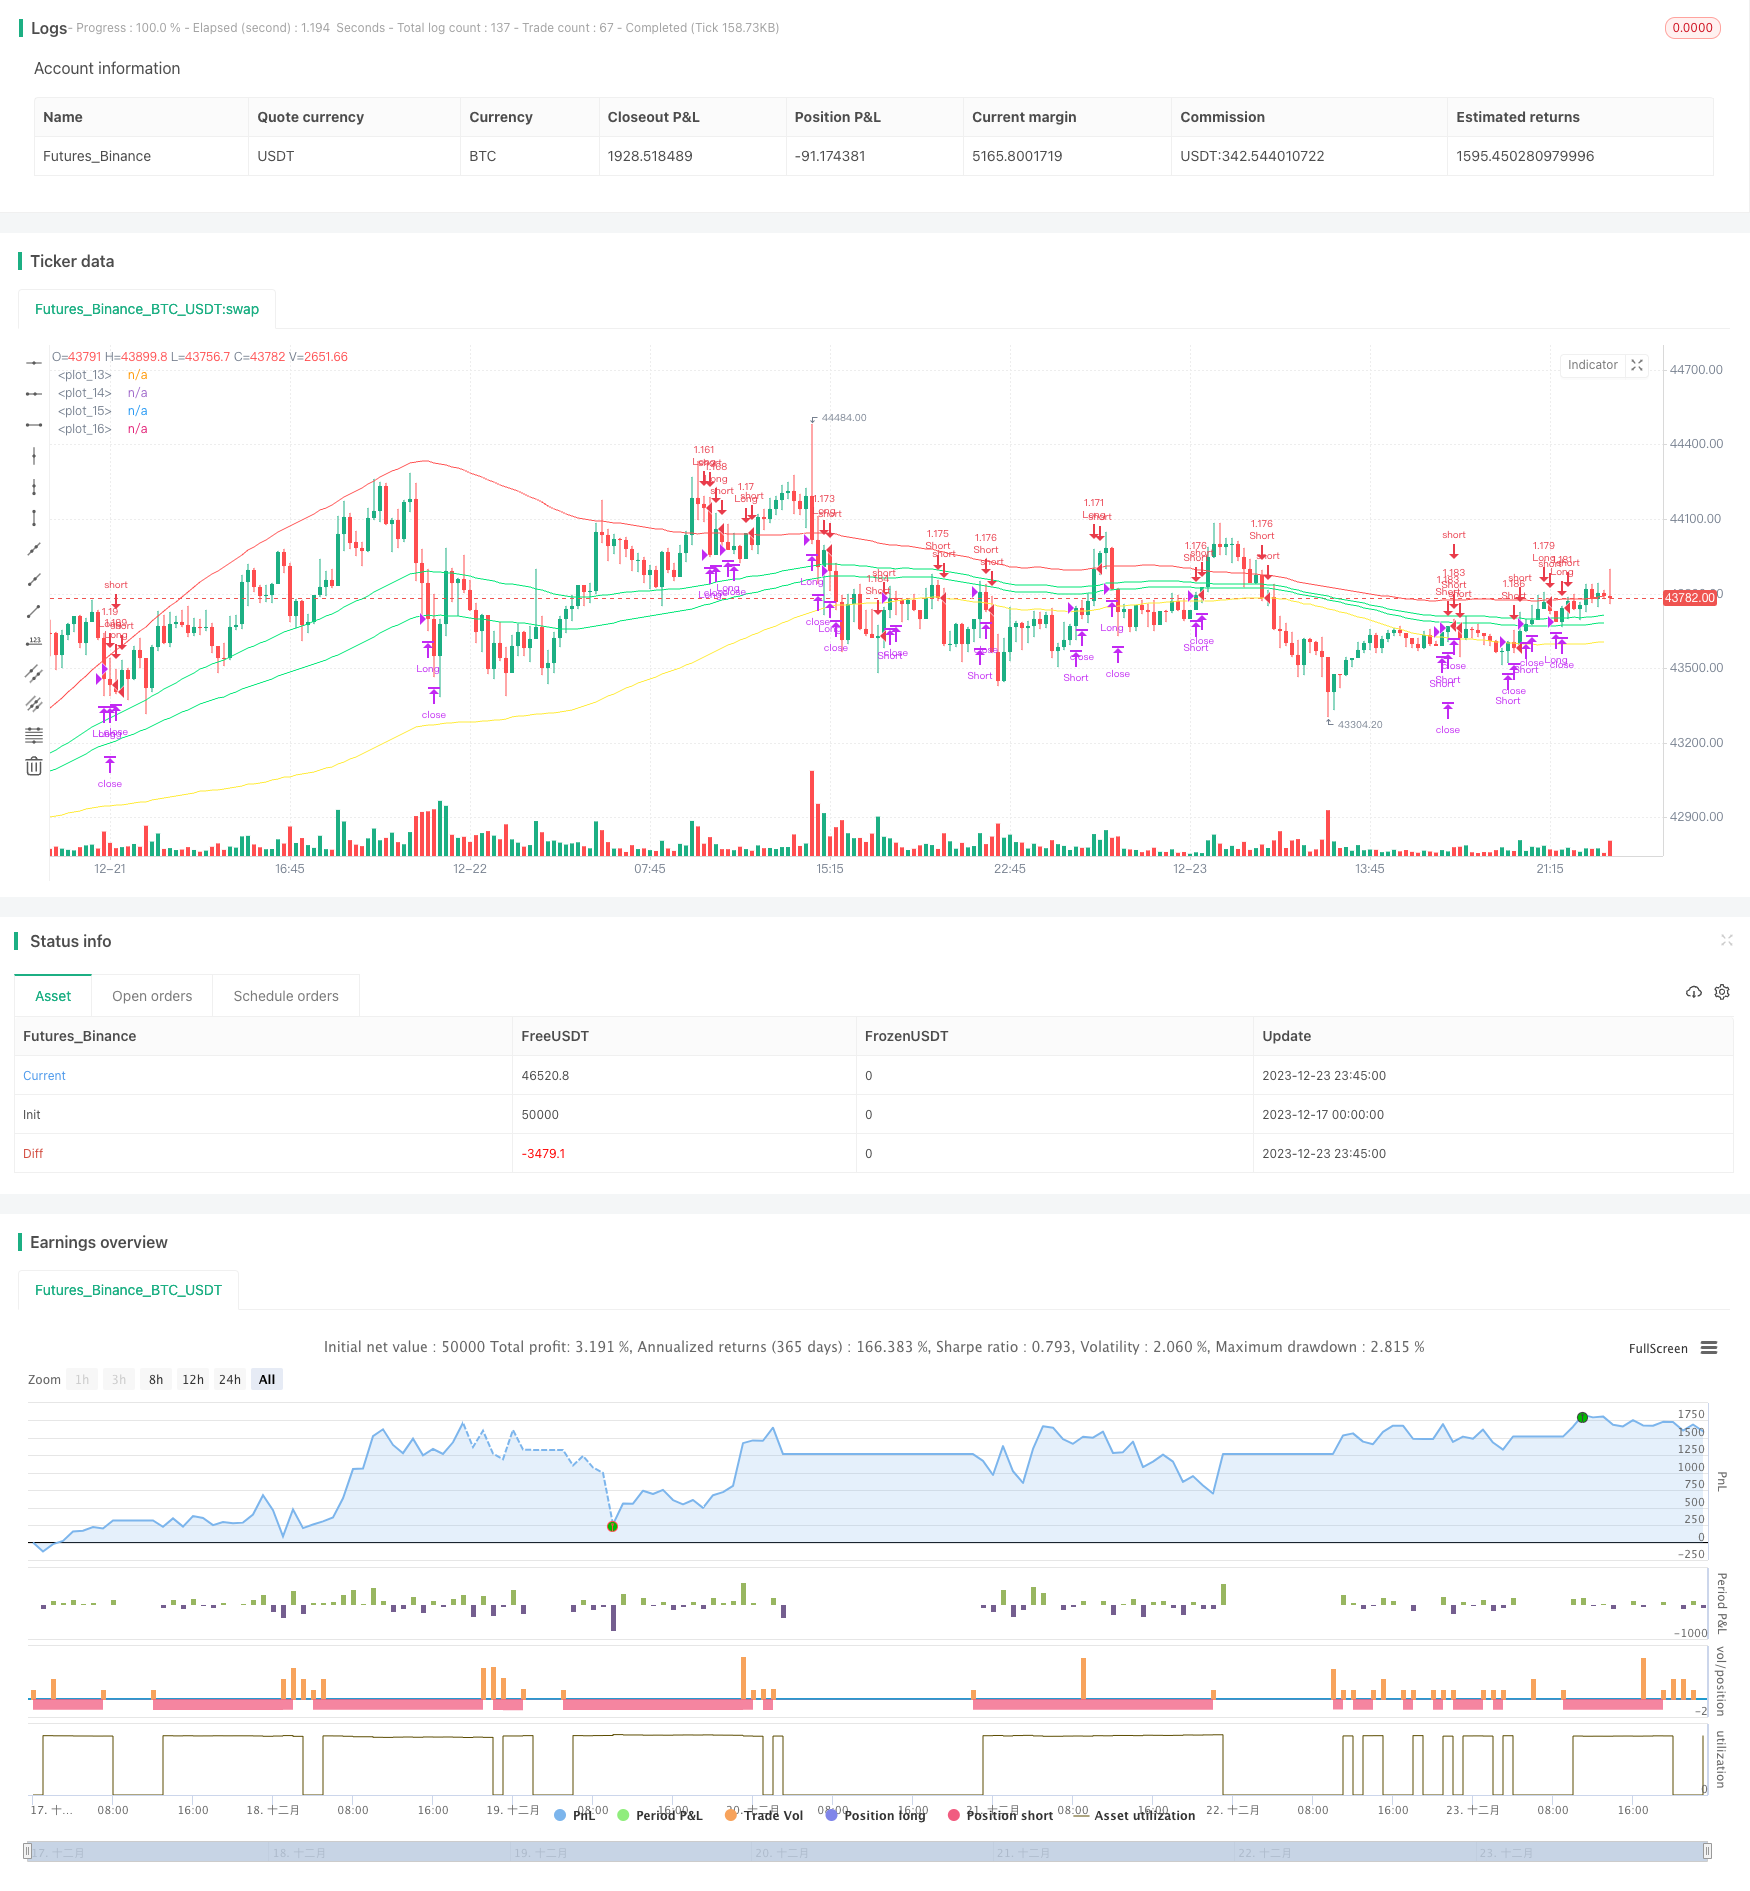
Name
双波动带突破策略Double-Bollinger-Bands-Breakout-Strategy
Author
ChaoZhang
Strategy Description
[trans]
双波动带突破策略是一种趋势跟踪策略。它利用波动带的上下轨来判断价格趋势,并在价格突破内部波动带时建立多头头寸,在价格跌破外部波动带时平仓。
该策略首先计算指定周期内的均线及标准差,通过调整标准差数值构建双波动带。内部波动带由均线正负一个标准差构成,外部波动带则由均线正负1.5个标准差构成。
当价格突破内部上轨时,认为行情开始牛市,因此做多;当价格跌破内部下轨时,认为行情开始熊市,因此做空。
做多后的止盈退出条件是价格跌破外部下轨。做空后的止盈退出条件是价格突破外部上轨。
该策略同时设定了止盈、止损、跟踪止损等退出机制。
双波动带突破策略具有以下优势:
- 利用双波动带判断价格走势,可以有效跟踪趋势;
- 突破内部波动带建仓,避免了不必要的反转交易;
- 设定止盈、止损和跟踪止损,可以有效控制风险;
- 参数可调,可以针对不同品种进行优化。
双波动带突破策略也存在一定的风险:
- 当行情震荡时,可能出现频繁的建仓和止损;
- 参数设置不当可能导致过于容易建仓或难以止盈;
- 突破有时具有虚假信号的特点,可能出现假突破的风险。
针对以上风险,可以适当调整参数,或结合其他指标进行过滤,或人工监控突破的效果,降低风险。
双波动带突破策略可以从以下几个方面进行优化:
- 优化均线和标准差的参数,使波动带更符合不同品种的特点;
- 增加Volume和MACD等指标过滤,避免虚假突破;
- 利用机器学习方法动态优化参数;
- 在高频区间内进行策略复制,扩大获利空间。
双波动带突破策略overall通过判断价格相对波动带的位置变化,选时建立交易信号,是一个较为典型的趋势跟踪策略。该策略利用双波动带设置获利区域,并设定科学的退出机制控制风险,在参数优化和风险控制到位的情况下,可以获得较好的效果。
||
The Double Bollinger Bands Breakout strategy is a trend following strategy. It uses the upper and lower bands of Bollinger Bands to judge price trends and establish long positions when prices break through the inner Bollinger Bands and close positions when prices fall below the outer Bollinger Bands.
The strategy first calculates the moving average and standard deviation over a specified period. It then constructs the double Bollinger Bands using the moving average ± one standard deviation for the inner bands and the moving average ± 1.5 standard deviations for the outer bands.
When prices break above the upper inner band, it indicates that the market is starting a bull run so goes long. When prices fall below the lower inner band, it indicates the start of a bear market so goes short.
The profit taking exit for long positions is when prices fall below the lower outer band. The profit taking exit for short positions is when prices break above the upper outer band.
The strategy also sets stop loss, take profit and trailing stop loss exits.
The Double Bollinger Bands Breakout strategy has the following advantages:
- Using double Bollinger Bands to judge price moves allows effective trend following;
- Entering on inner band breakouts avoids unnecessary mean reversion trades;
- Take profit, stop loss and trailing stop losses effectively control risk;
- Optimizable parameters allow tuning for different products.
The Double Bollinger Bands Breakout strategy also has some risks:
- Frequent entries and stop losses may occur during ranging markets;
- Improper parameter settings could lead to too easy entries or difficult exits;
- Breakouts sometimes give false signals resulting in failed breakouts.
To address these risks, parameters could be adjusted, additional filters added, or breakouts manually monitored to reduce risk.
The Double Bollinger Bands Breakout strategy can be optimized in several ways:
- Optimize moving average and standard deviation parameters to fit different products;
- Add volume, MACD or other filters to avoid false breakouts;
- Use machine learning methods to dynamically optimize parameters;
- Copy strategy across multiple high frequency intervals to expand profit potential.
The Double Bollinger Bands Breakout strategy overall judges changes in price relative to Bollinger Bands to time entries in a typical trend following approach. The strategy sets profit targets using the double bands and scientific exit mechanisms to control risk. With optimized parameters and risk controls, it can achieve good results.
[/trans]
Strategy Arguments
| Argument | Default | Description |
|---|---|---|
| v_input_1 | 100 | length |
| v_input_2 | 0.25 | pbin |
| v_input_3 | 1.5 | pbout |
| v_input_4 | false | Take Profit |
| v_input_5 | false | Stop Loss |
| v_input_6 | false | Trailing Stop Loss |
| v_input_7 | false | Trailing Stop Loss Offset |
Source (PineScript)
/*backtest
start: 2023-12-17 00:00:00
end: 2023-12-24 00:00:00
period: 15m
basePeriod: 5m
exchanges: [{"eid":"Futures_Binance","currency":"BTC_USDT"}]
*/

//@version=2
strategy("BB Strat",default_qty_type = strategy.percent_of_equity, default_qty_value = 100,currency="USD",initial_capital=100, overlay=true)
l=input(title="length",defval=100)
pbin=input(type=float,step=.1,defval=.25)
pbout=input(type=float,step=.1,defval=1.5)
ma=sma(close,l)
sin=stdev(ma,l)*pbin
sout=stdev(ma,l)*pbout
inu=sin+ma
inb=-sin+ma
outu=sout+ma
outb=-sout+ma
plot(inu,color=lime)
plot(inb,color=lime)
plot(outu,color=red)
plot(outb,color=yellow)

inpTakeProfit = input(defval = 0, title = "Take Profit", minval = 0)
inpStopLoss = input(defval = 0, title = "Stop Loss", minval = 0)
inpTrailStop = input(defval = 0, title = "Trailing Stop Loss", minval = 0)
inpTrailOffset = input(defval = 0, title = "Trailing Stop Loss Offset", minval = 0)
useTakeProfit = inpTakeProfit >= 1 ? inpTakeProfit : na
useStopLoss = inpStopLoss >= 1 ? inpStopLoss : na
useTrailStop = inpTrailStop >= 1 ? inpTrailStop : na
useTrailOffset = inpTrailOffset >= 1 ? inpTrailOffset : na


longCondition = close>inu and rising(outu,1)
exitlong = (open[1]>outu and close<outu) or crossunder(close,ma)

shortCondition = close<inb and falling(outb,1)
exitshort = (open[1]<outb and close>outb) or crossover(close,ma)

strategy.entry(id = "Long", long=true, when = longCondition)
strategy.close(id = "Long", when = exitlong)
strategy.exit("Exit Long", from_entry = "Long", profit = useTakeProfit, loss = useStopLoss, trail_points = useTrailStop, trail_offset = useTrailOffset, when=exitlong)

strategy.entry(id = "Short", long=false, when = shortCondition)
strategy.close(id = "Short", when = exitshort)
strategy.exit("Exit Short", from_entry = "Short", profit = useTakeProfit, loss = useStopLoss, trail_points = useTrailStop, trail_offset = useTrailOffset, when=exitshort)
Detail
https://www.fmz.com/strategy/436499
Last Modified
2023-12-25 13:20:31
