Name
双移动平均线交叉策略Dual-Moving-Average-Crossover-Strategy
Author
ChaoZhang
Strategy Description
[trans]
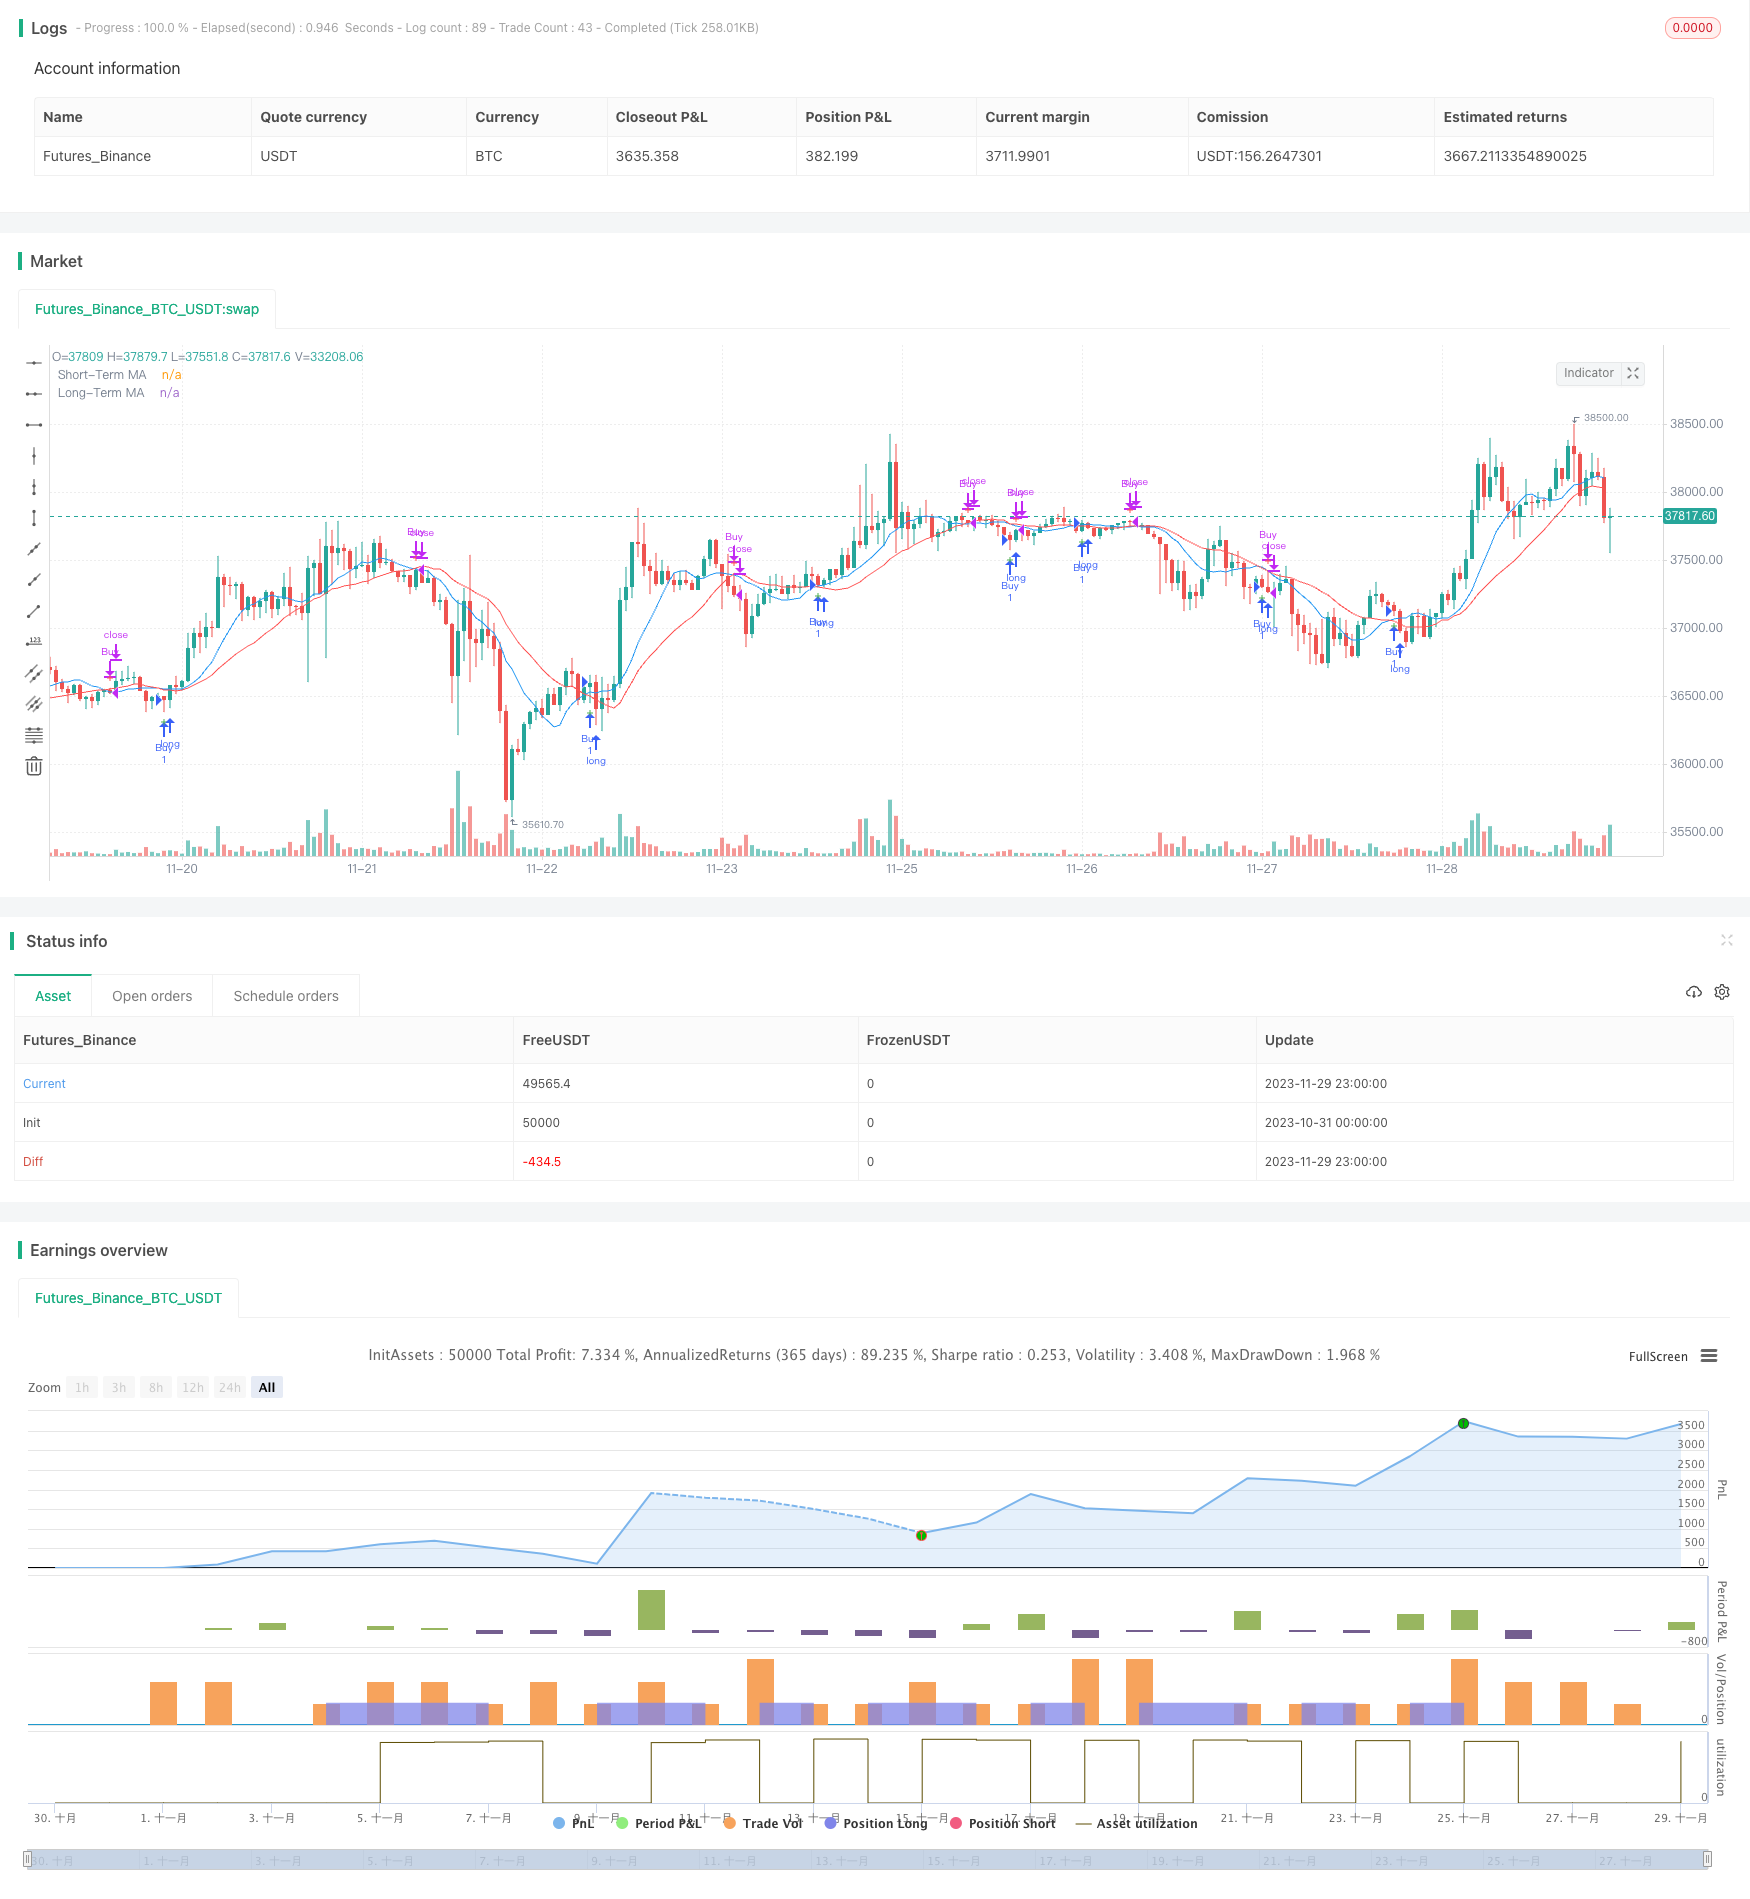
双均线交叉策略通过计算两条不同周期的移动平均线,并根据其交叉情况产生买入和卖出信号,属于技术分析中的常用策略。本策略的核心是利用短期均线上穿长期均线产生买入信号,而短期均线下穿长期均线产生卖出信号,通过捕捉短期和长期时间序列图形形态的交叉情况,来判断市场价格线的反转阶段,并据此判断何时买入或卖出。
本策略的技术原理是:长期均线可以反映长时间周期内的平均价格,是较为稳定的均线,短期均线则比较灵敏,反应短时间周期内的价格变化,属于较为活跃与强随机性的均线。当短期均线上穿长期均线时,表示短期时间周期内价格已经涨过了长期时间周期的平均水平,价格呈现加速上涨的势头,此时通过买入做多可以获得收益。而当短期均线再次下穿长期均线时,表示价格的上扬已经开始放缓,属于利润回吐的时期,这时减仓或者清仓是合理的选择。
通过对短期时间周期与长期时间周期价格的比较,本策略强调“乘势”而买入,强调“止盈”而卖出的投资理念。这种利用均线交叉形态的势头策略,与“逆势”思想对应的均线反转策略不同,属于比较主动与果决的投资策略类型。
双均线交叉策略有以下几点优势:
- 思路清晰简单,易于理解与落地实现。
- 直观反映短长时间周期价格形态变化,利于把握市场节奏。
- 买卖信号生成明确,操作决策比较果断。
- 可扩展性强,可灵活选取短长均线的周期组合。
- 可自定义买卖策略,结合其他因素决策。
双均线交叉策略也存在一定的局限性与风险:
- 当短长均线走势交替频繁时,会产生较多的错误信号与不必要的交易操作。
- 信号产生有滞后现象,无法定位价格反转的最佳时机点。
- 只关注价格本身的时间序列变化,没有综合考量其他微观与宏观因素。
- 买卖决策比较机械与死板,没有结合变化的市场环境进行调整。
对应的风险控制与优化方法包括:增加过滤条件,调整均线参数组合,结合其他指标进行决策等。
双均线交叉策略可以从以下几个方向进行优化:
- 优化均线周期参数组合,寻找最佳参数。可以通过遍历与机器学习方法寻优。
- 增加过滤条件,避免错误信号,如增加交易量条件、价格波动幅度条件等。
- 结合其他指标,如MACD、KDJ等,进行综合多因子决策。
- 利用自适应技术,实时优化均线参数,或根据市场环境切换策略组合。
- 结合深度学习等高级模型,实现更智能化的决策与资产分配。
双均线交叉策略通过比较短期均线与长期均线的交叉情况,判断价格的趋势与反转时机,属于技术分析中比较简单直接的策略。它优势在于思路清晰、易于实现,但也存在产生误信号、决策死板等问题。未来的优化方向在于参数优化、风险控制与结合更多因素和新技术进行决策。总体而言,双均线策略是量化交易的基础入门策略之一,值得深入研究与推广应用。
||
The Dual Moving Average Crossover strategy generates trading signals by calculating two moving averages of different periods and detecting their crossover situations. It belongs to a commonly used technical analysis strategy. The core of this strategy is to use the crossover of a short-term moving average above a long-term moving average to generate a buy signal, and the crossover of the short-term moving average below the long-term moving average to generate a sell signal. By capturing the crossover patterns of short-term and long-term time series, it judges the inflection point of the price curve and determines when to buy or sell.
The technical principle of this strategy is: the long-term moving average reflects the average price over a long time period and is a relatively stable line, while the short-term moving average is more sensitive and reflects price changes over a short time period, which is a more active and strongly random line. When the short-term moving average crosses above the long-term moving average, it indicates that the price in the short-term cycle has risen above the average level of the long-term cycle, showing an accelerating upward trend. At this point, going long through buying can generate profits. And when the short-term moving average crosses below the long-term moving average again, it indicates that the upward momentum of prices has begun to slow down, which is the period of profit taking. At this time, reducing positions or clearing positions is a reasonable choice.
By comparing prices over short-term and long-term time cycles, this strategy emphasizes the investment philosophy of "riding the momentum" to buy and "profit taking" to sell. Such momentum strategies utilizing moving average crossover patterns are different from mean reversion strategies based on the "contrarian" idea that utilize reversed moving average crossovers. It belongs to a more proactive and decisive type of investment strategy.
The dual moving average crossover strategy has the following advantages:
- The logic is clear and simple, easy to understand and implement.
- It intuitively reflects the changes in price patterns over short and long time cycles, which is conducive to grasping market rhythms.
- The trading signals are clear, making decision-making more decisive.
- It has strong extensibility and flexibility to select short and long moving average cycle combinations.
- Customized trading strategies can be incorporated with other factors in decision making.
The dual moving average crossover strategy also has some limitations and risks:
- When the short and long moving averages fluctuate frequently, it will generate more false signals and unnecessary trades.
- There is a lag in signal generation, unable to locate the optimal timing of price reversals.
- It only focuses on the time series changes of prices itself without comprehensively considering other micro and macro factors.
- Trading decisions are relatively mechanical and rigid without adjustments based on changing market environments.
The corresponding risk management and optimization methods include: adding filter conditions, adjusting moving average parameter combinations, incorporating other indicators for decision making, etc.
The dual moving average crossover strategy can be optimized in the following directions:
- Optimize the moving average parameter combinations to find the optimal parameters through exhaustive search and machine learning techniques.
- Add filter conditions to avoid false signals, such as trading volume conditions, price fluctuation range conditions, etc.
- Incorporate other indicators such as MACD, KDJ for multivariate decisions.
- Use adaptive techniques to dynamically optimize moving average parameters or switch strategy ensembles based on market environments.
- Incorporate advanced models like deep learning for more intelligent decisions and asset allocations.
The dual moving average crossover strategy judges the trend and inflection points of prices by comparing short and long moving averages, which is a relatively simple and direct technique in technical analysis. Its advantage lies in the clarity of logic and ease of implementation, but it also has problems such as generating false signals and rigid decisions. The future optimization directions are parameter optimization, risk control and incorporating more factors and new technologies for decision making. In general, the dual moving average strategy is one of the basic entry-level quantitative trading strategies that is worth in-depth research and application promotion.
[/trans]
Strategy Arguments
| Argument | Default | Description |
|---|---|---|
| v_input_1 | 10 | Short-Term MA Period |
| v_input_2 | 20 | Long-Term MA Period |
Source (PineScript)
/*backtest
start: 2023-10-31 00:00:00
end: 2023-11-30 00:00:00
period: 1h
basePeriod: 15m
exchanges: [{"eid":"Futures_Binance","currency":"BTC_USDT"}]
*/

//@version=4
strategy("Moving Average Crossover Strategy", overlay=true)

// Input parameters
short_term_period = input(10, title="Short-Term MA Period")
long_term_period = input(20, title="Long-Term MA Period")

// Calculate moving averages
short_term_ma = sma(close, short_term_period)
long_term_ma = sma(close, long_term_period)

// Buy signal
buy_signal = crossover(short_term_ma, long_term_ma)

// Sell signal
sell_signal = crossunder(short_term_ma, long_term_ma)

if (buy_signal)
    strategy.entry("Buy", strategy.long)

if (sell_signal)
    strategy.close("Buy")

// Plot moving averages
plot(short_term_ma, color=color.blue, title="Short-Term MA")
plot(long_term_ma, color=color.red, title="Long-Term MA")

// Plot buy and sell signals on the chart
plotshape(series=buy_signal, location=location.belowbar, color=color.green, style=shape.cross, title="Buy Signal")
plotshape(series=sell_signal, location=location.abovebar, color=color.red, style=shape.cross, title="Sell Signal")
Detail
https://www.fmz.com/strategy/433923
Last Modified
2023-12-01 14:53:05
