Name
双移动平均线和RSI指标的多空交叉策略Swing-Dual-Moving-Average-and-RSI-Crossover-Strategy
Author
ChaoZhang
Strategy Description
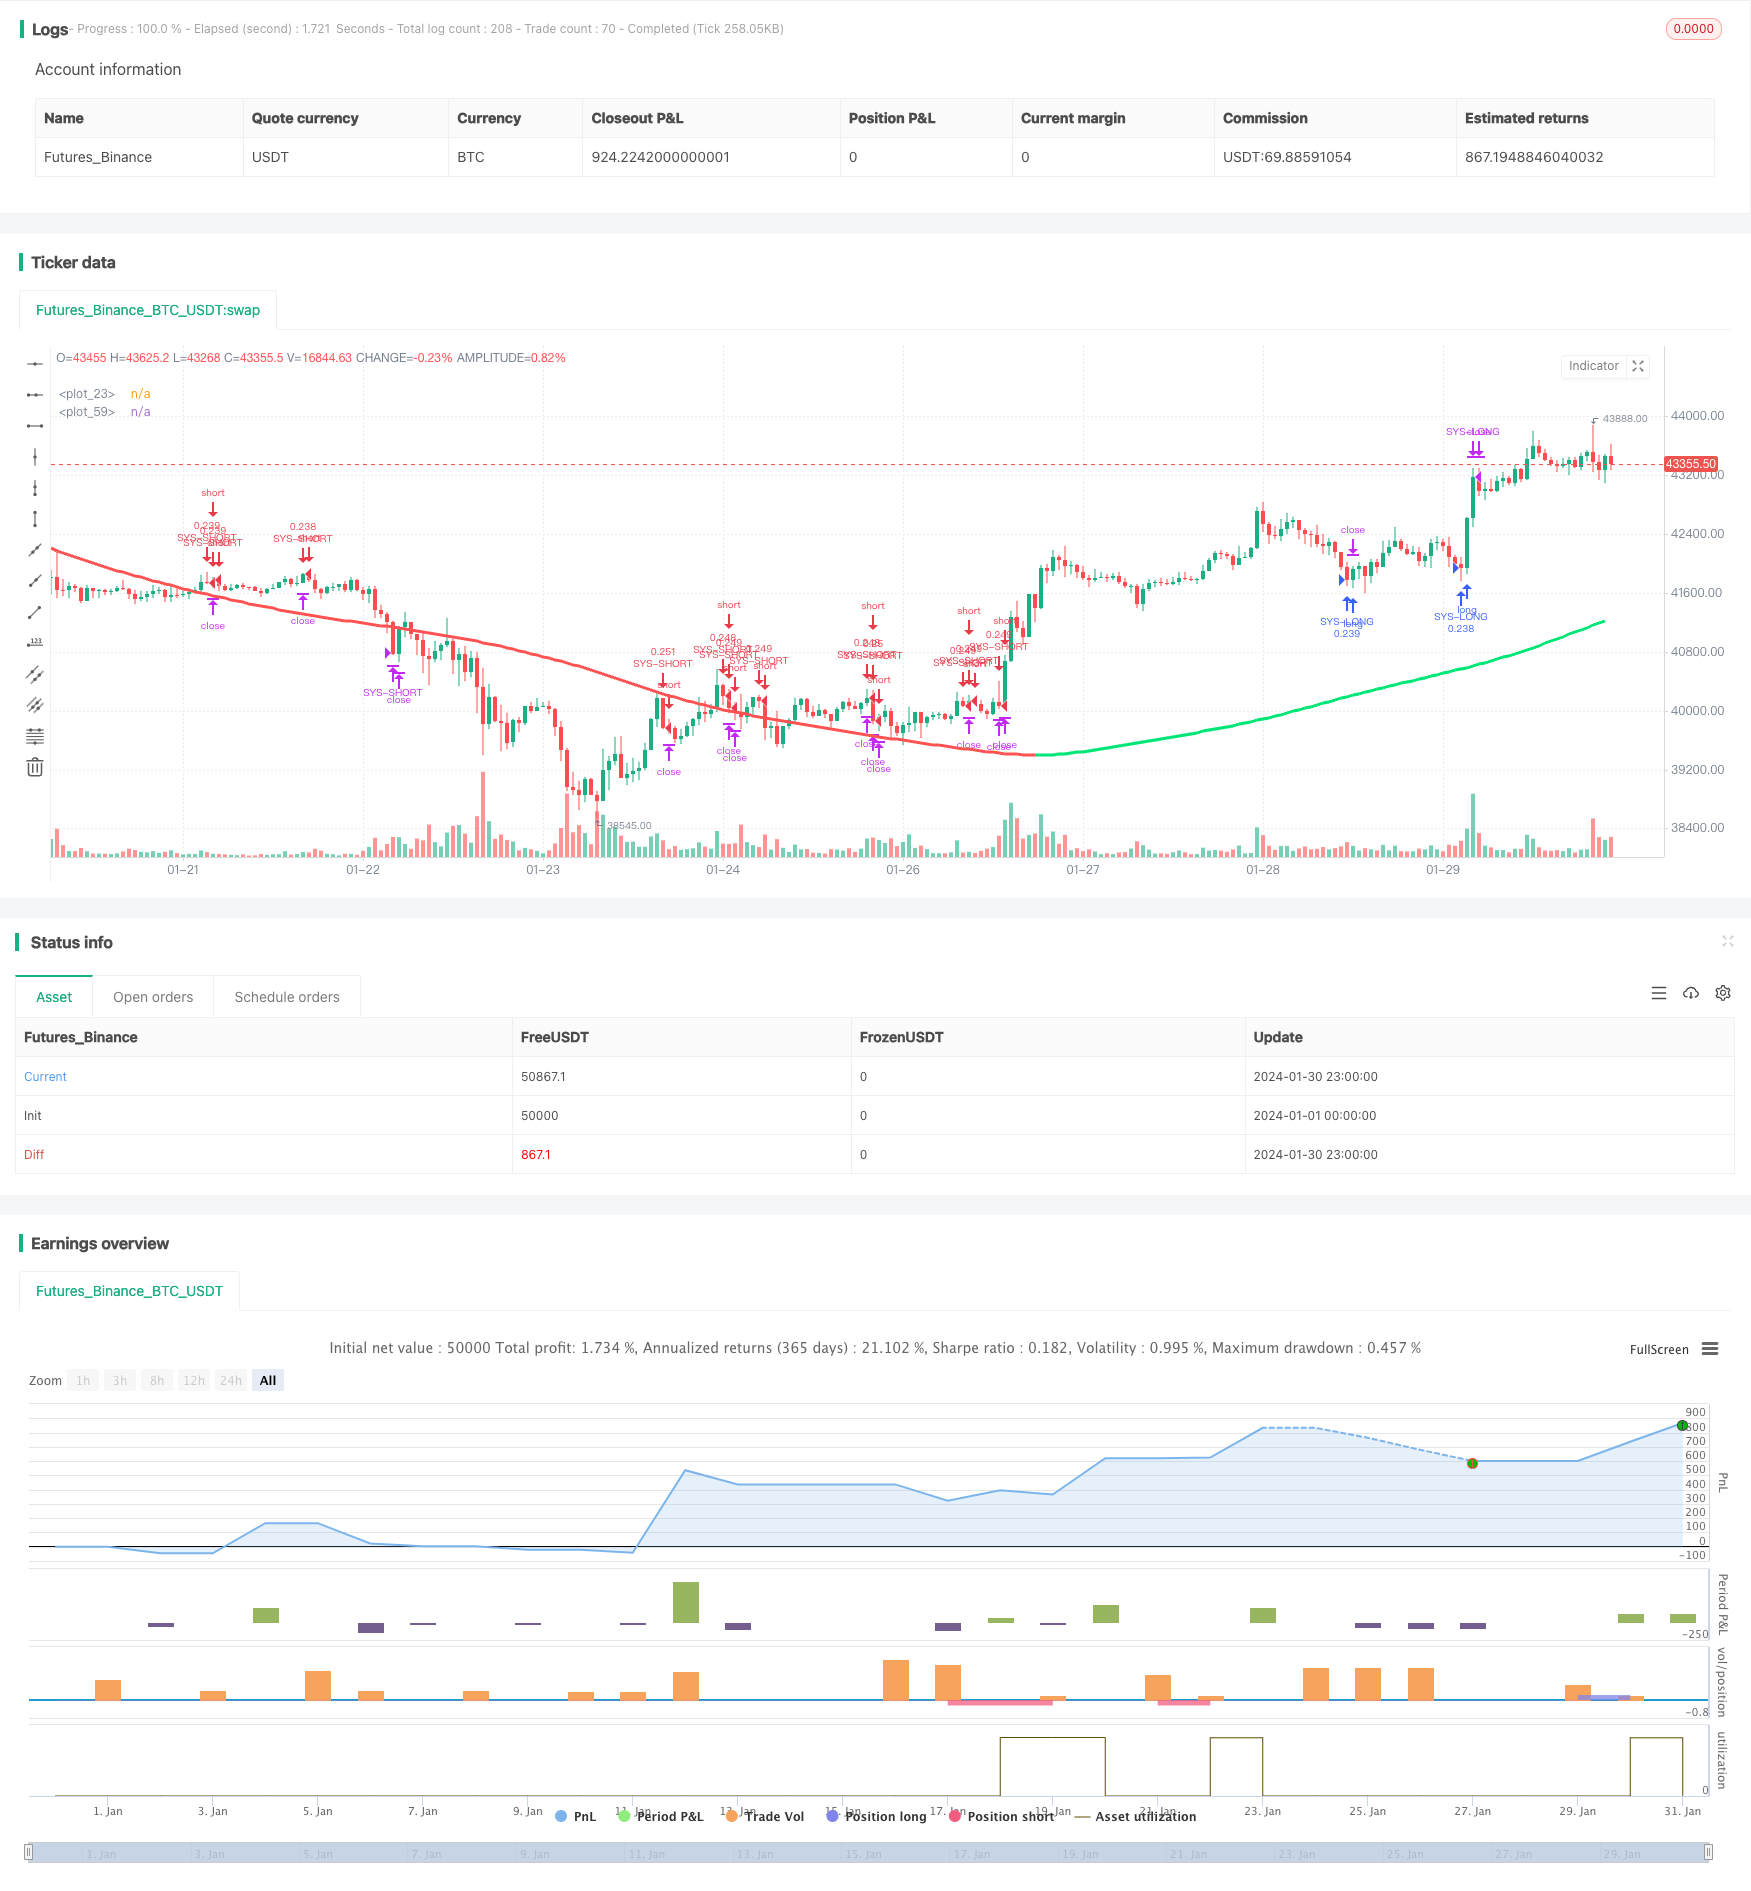
本策略综合运用双移动平均线和RSI指标构建多空交叉交易策略。该策略可以捕捉中长线趋势,同时利用短线指标避免不必要的震荡。
本策略使用两组移动平均线,分别是快速移动平均线(EMA 59和EMA 82)和慢速移动平均线(EMA 96和EMA 95)。当价格从下向上跨过快速移动平均线时,做多;当价格从上向下跨过快速移动平均线时,做空。同时,RSI指标的过买过卖区域用于确认交易信号和止损。
具体来说,当快速EMA向上突破慢速EMA时生成多头信号。此时如果RSI低于30(超卖区域),则进行多头入场。当快速EMA向下跌破慢速EMA时,产生空头信号。如果这时RSI高于70(超买区域),则进行空头入场。
使用双移动平均线的优势是可以更好地识别中长线趋势的变化。RSI指标则可以过滤掉部分假突破带来的噪音交易。
- 利用双移动平均线捕捉中长线趋势
- RSI指标过滤噪音交易
- 结合趋势跟随和反转交易
- 交易逻辑简单清晰
- 大幅度震荡市场中,移动平均线生成的交易信号可能受到欺骗
- RSI指标在某些市场情况下也会失效
- 止损点设置需要谨慎,避免过于宽松或紧迫
- 测试更长周期的移动平均线组合
- 尝试不同的参数调整,如RSI看涨看跌区间的变化
- 增加附加过滤条件,如交易量指标等
- 优化止损策略,结合ATR等指标动态止损
本策略整合双移动平均线的趋势跟随与RSI指标的反转交易。双EMA追踪中长线趋势方向,RSI用于确认交易信号有效性和止损。这是一个简单实用的多空交叉策略,通过参数调整和优化可适应不同市场环境。
||
This strategy integrates dual moving average and RSI indicator to construct a crossover trading strategy between long and short positions. It can capture mid-to-long term trends while avoiding unnecessary noise trading with short-term indicators.
This strategy adopts two sets of moving averages, consisting of fast moving average (EMA 59 and EMA 82) and slow moving average (EMA 96 and EMA 95). It goes long when price crosses above fast EMA, and goes short when price crosses below fast EMA. Meanwhile, the overbought and oversold area of RSI indicator is used to confirm trading signals and stop-loss.
Specifically, when fast EMA breaks above slow EMA, a long signal is generated. If RSI is below 30 (oversold area) at this time, go long. When fast EMA breaks below slow EMA, a short signal is produced. If RSI surpasses 70 (overbought area) at this point, go short.
The advantage of using dual moving average is to better recognize changes in mid-to-long term trends. RSI filters out some noise trading from false breakouts.
- Capture mid-to-long term trends with dual moving averages
- Filter noise trading with RSI indicator
- Combine trend following and mean reversion trading
- Simple and clear logic
- In largely range-bound markets, moving average signals may be subject to whipsaws
- RSI indicator also fails in certain market conditions
- Stop loss placement needs prudence to avoid too loose or too tight
- Test longer cycle moving average combinations
- Try different parameter tuning e.g. thresholds of RSI overbought/oversold areas
- Add additional filters like trading volume
- Optimize stop loss strategies, incorporate dynamic stop loss with ATR etc.
This strategy integrates the trend following of dual moving averages and mean reversion trading of RSI indicator. The dual EMAs track mid-to-long term trend directions, while RSI confirms validity of trading signals and stop loss. This is a simple and practical crossover strategy between long and short. It can be adapted to different market environments through parameter tuning and optimization.
[/trans]
Strategy Arguments
| Argument | Default | Description |
|---|---|---|
| v_input_1 | 500 | period |
| v_input_2 | 14 | length |
| v_input_3 | 70 | overSold |
| v_input_4 | 30 | overBought |
| v_input_5 | 59 | fastLength |
| v_input_6 | 82 | fastLengthL |
| v_input_7 | 96 | slowLength |
| v_input_8 | 95 | slowLengthL |
| v_input_9 | 75 | sl |
Source (PineScript)
/*backtest
start: 2024-01-01 00:00:00
end: 2024-01-31 00:00:00
period: 1h
basePeriod: 15m
exchanges: [{"eid":"Futures_Binance","currency":"BTC_USDT"}]
*/

//@version=2
strategy("Swing Hull/rsi/EMA Strategy", overlay=true,default_qty_type=strategy.cash,default_qty_value=10000,scale=true,initial_capital=10000,currency=currency.USD)

//A Swing trading strategy that use a combination of indicators, rsi for target, hull for overall direction enad ema for entering the martket.
// hull ma copied from syrowof HullMA who copied from mohamed982 :) thanks both
// Performance

n=input(title="period",defval=500)

n2ma=2*wma(close,round(n/2))
nma=wma(close,n)
diff=n2ma-nma
sqn=round(sqrt(n))

n2ma1=2*wma(close[1],round(n/2))
nma1=wma(close[1],n)
diff1=n2ma1-nma1
sqn1=round(sqrt(n))

n1=wma(diff,sqn)
n2=wma(diff1,sqn)
c=n1>n2?green:red
ma=plot(n1,color=c)


// RSi and Moving averages

length = input( 14 )
overSold = input( 70)
overBought = input( 30)
point = 0.0001
dev= 2

fastLength = input(59)
fastLengthL = input(82)
slowLength = input(96)
slowLengthL = input(95)
price = close

mafast = ema(price, fastLength)
mafastL= ema(price, fastLengthL)
maslow = ema(price, slowLength)
maslowL = ema(price, slowLengthL)
vrsi = rsi(price, length)
cShort =  (crossunder(vrsi, overBought))

condDown = n2 >= n1
condUp = condDown != true
closeLong =  (crossover(vrsi, overSold))
closeShort = cShort


// Strategy Logic
longCondition = n1> n2
shortCondition = longCondition != true

col =condUp ? lime : condDown ? red : yellow
plot(n1,color=col,linewidth=3)


if (not na(vrsi))
    if shortCondition
        if (price[0] < maslow[0] and price[1] > mafast[1]) //cross entry
            strategy.entry("SYS-SHORT", strategy.short, comment="short")
strategy.close("SYS-SHORT", when=closeShort) //output logic

if (not na(vrsi))
    if longCondition // swing condition
        if (price[0] < mafast[0] and price[1] > mafast[1]) //cross entry
            strategy.entry("SYS-LONG", strategy.long, comment="long")
strategy.close("SYS-LONG", when=closeLong) //output logic


// Stop Loss


sl = input(75)
Stop = sl * 10
Q = 100


strategy.exit("Out Long", "SYS-LONG", qty_percent=Q, loss=Stop)
strategy.exit("Out Short", "SYS-SHORT", qty_percent=Q, loss=Stop)


//plot(strategy.equity, title="equity", color=red, linewidth=2, style=areabr)
Detail
https://www.fmz.com/strategy/440702
Last Modified
2024-02-01 11:48:51
