Name
双移动平均线跨市交易策略Dual-Moving-Average-Cross-Market-Trading-Strategy
Author
ChaoZhang
Strategy Description
[trans]
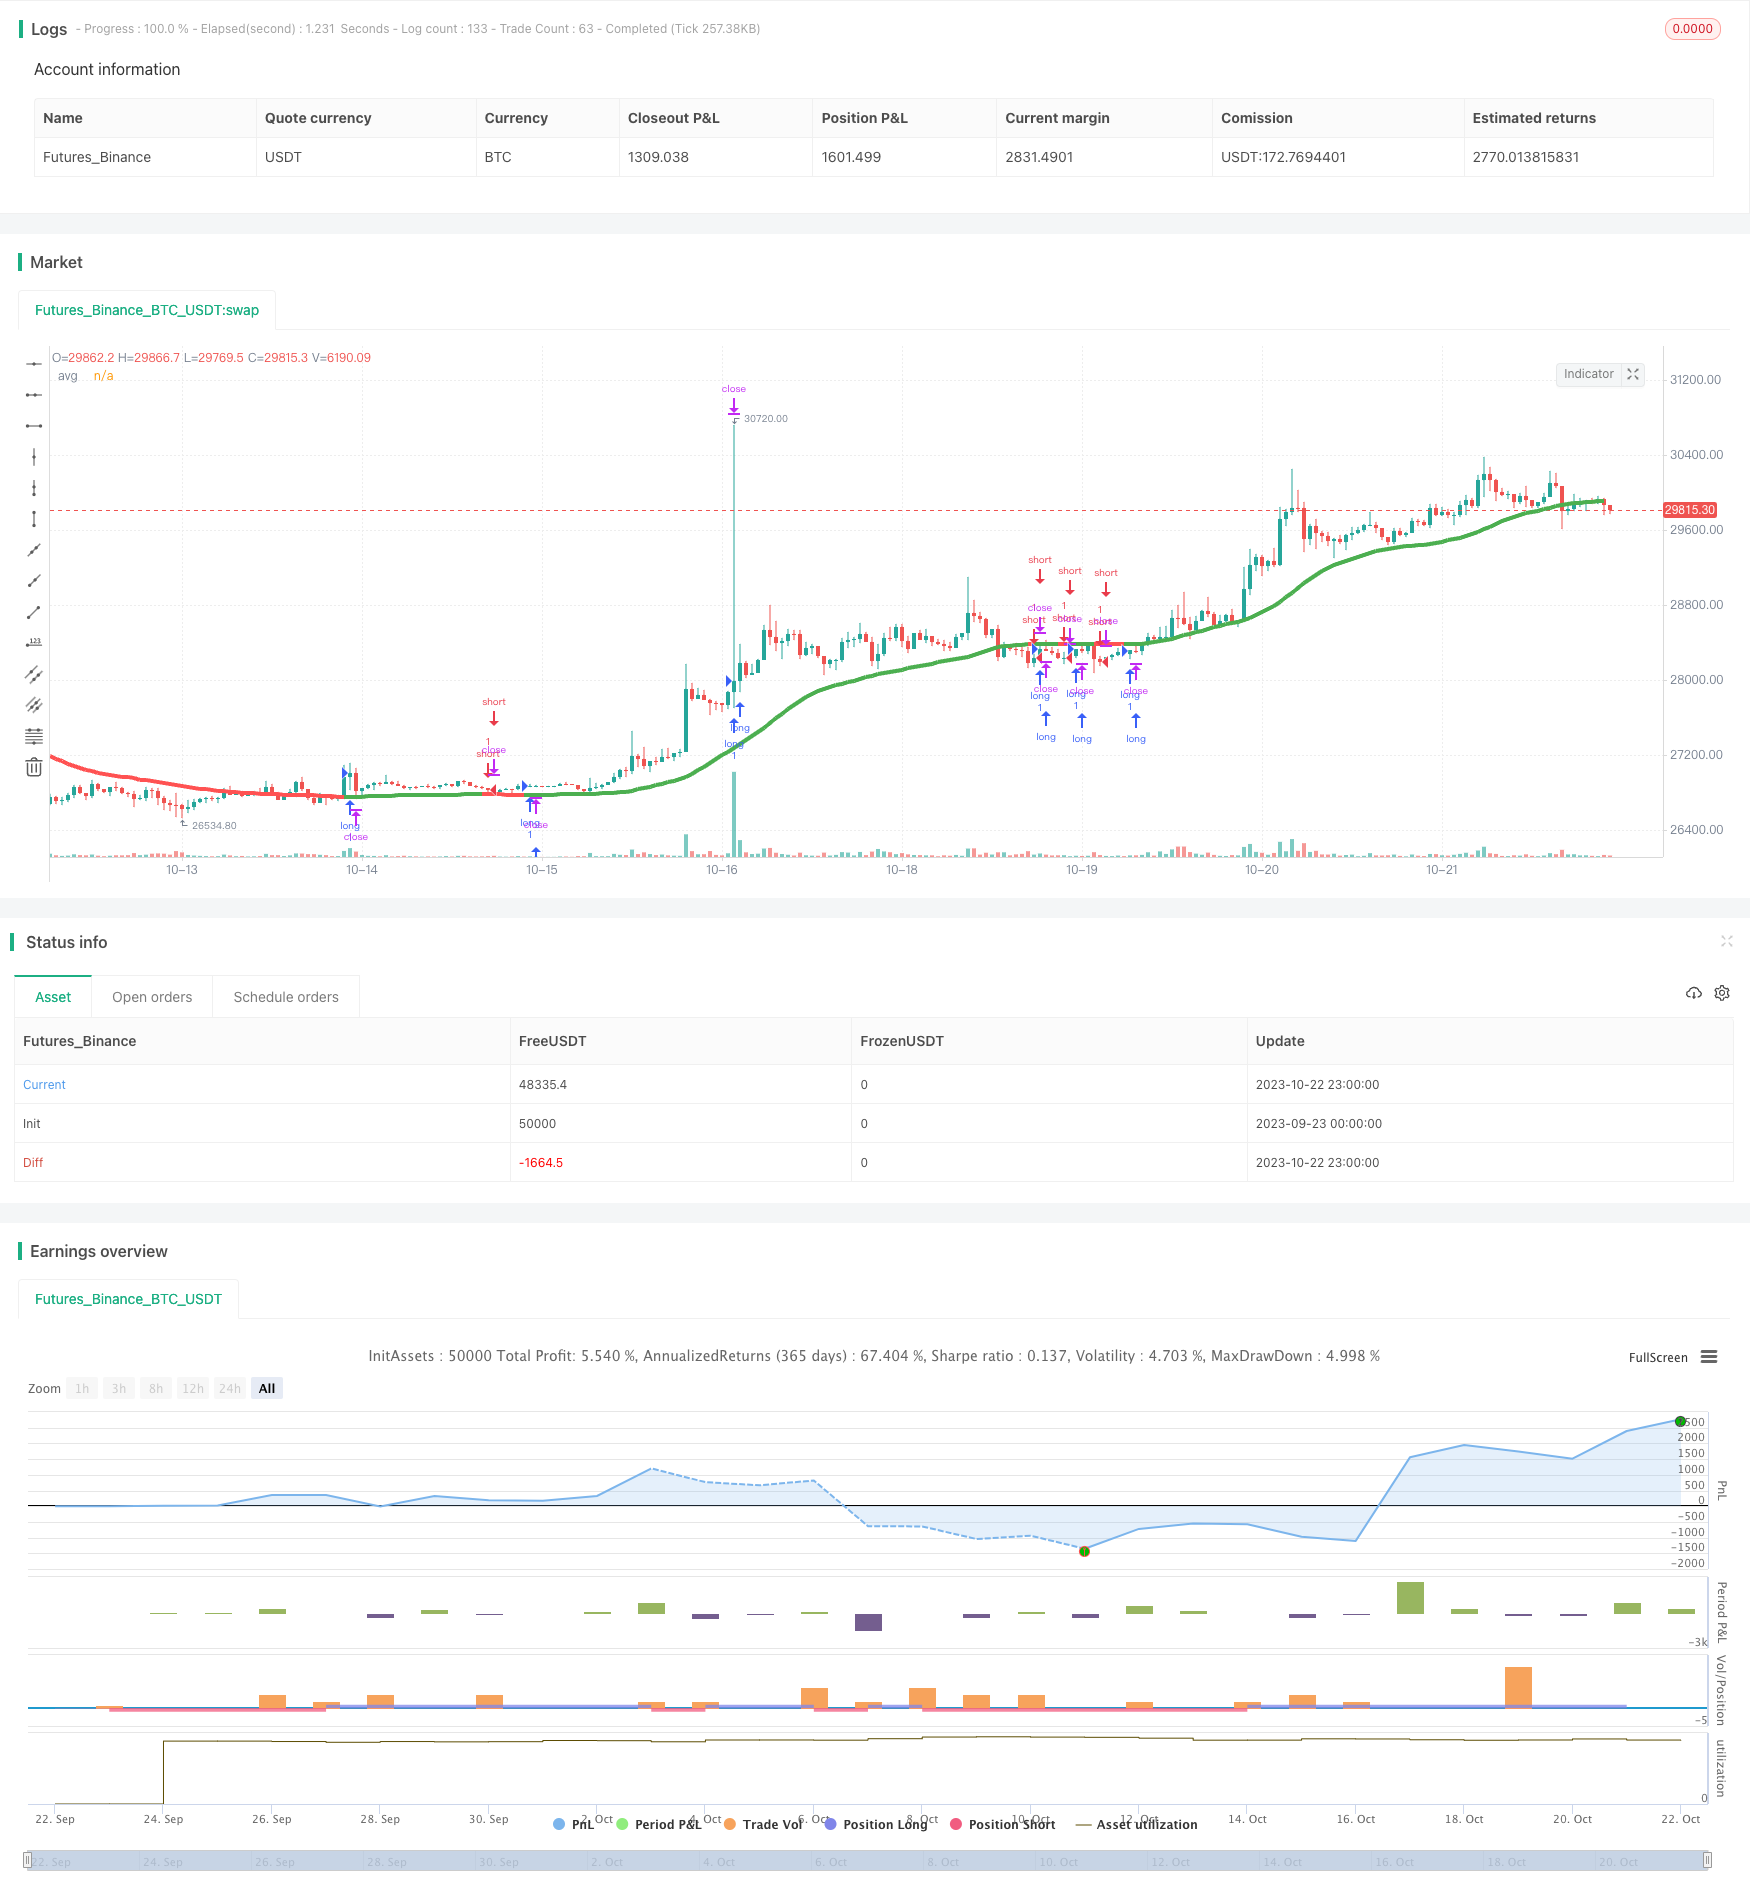
本策略结合Hull移动平均线和T3移动平均线的优点,设计了一个跨市交易的策略。该策略既可用于短线交易,也可用于中长线趋势跟踪。通过计算Hull移动平均线和T3移动平均线的均值作为主要的交易信号线,根据其方向的变化来判断入场和出场时机。
该策略主要基于Hull移动平均线和T3移动平均线的计算。
Hull移动平均线(Hull Moving Average,HMA)通过加权移动平均线的迭代计算方法,能有效滤波市场噪音,显示出价格趋势的平滑曲线。它比简单移动平均线和指数移动平均线对价格变化更敏感,同时也能有效抑制假突破。
T3移动平均线在减少滞后效应的同时,通过一定的超参数调整,可以使得移动平均线更贴近价格。它通过多次的指数平滑计算,能够更快速地响应价格变化。
本策略计算出两者的平均值,作为主要的交易指标。根据该平均线的方向判断入场时机:如果当前周期的平均线高于上一周期,则为多头入场信号;如果当前周期的平均线低于上一周期,则为空头入场信号。
对于出场规则,如果价格突破止损点或者达到止盈点,则出场;如果平均线方向发生转变,也执行出场动作。
该策略结合了Hull移动平均线和T3移动平均线的优点,既能平滑去噪,也能快速响应价格变化,从而生成一个综合性指标。其次,该策略同时适用于短线和中长线交易,通过调整计算周期参数,可以灵活地调整适用的交易周期。再者,该策略采用了移动止损和移动止盈设置,可以锁定盈利,控制风险。
该策略主要依赖均线指标,在震荡趋势中可能会产生多次虚假信号。此外,均线具有一定滞后性,可能错过价格 변化的最佳入场时点。设置止损止盈点需要谨慎,避免过于宽松或过于紧迫。最后,不同币种和交易周期需要测试优化参数,不能直接复用。
可以考虑加入其他辅助指标,如强弱指标、波动率指标等,来验证均线信号,过滤虚假信号。可以测试不同的均线组合和权重算法,优化生成均线信号的效果。可以加入自适应止损和尾随止盈来动态管理风险。可以针对不同币种和交易周期进行回测优化,找到其最佳参数组合。
本策略整合Hull移动平均线和T3移动平均线的优势,形成一个综合指标来判断趋势方向。通过参数优化,该策略可以灵活适用于不同的交易周期。策略具有一定的优势,但也存在跟随滞后,产生虚假信号等问题。通过加入其他辅助指标,优化参数以及动态止损止盈等手段,可以不断优化改进该策略,以获得更好的效果。
||
This strategy combines the advantages of Hull moving average and T3 moving average to design a cross-market trading strategy. It can be used for both short-term trading and long-term trend tracking. By calculating the mean value of Hull moving average and T3 moving average as the main trading signal line, it determines entry and exit points based on the directional changes.
The strategy is mainly based on the calculation of Hull moving average and T3 moving average.
The Hull Moving Average (HMA) uses a weighted moving average iterative calculation method to effectively filter out market noise and display a smooth price trend curve. It is more sensitive to price changes than simple moving averages and exponential moving averages, while also effectively suppressing false breakouts.
The T3 moving average responds faster to price changes while reducing lag by adjusting parameters. Through multiple exponential smoothing calculations, it can quickly respond to price changes.
This strategy takes the average of the two as the main trading indicator. It judges entry timing according to the direction of this average line: if the current period's average is higher than the previous period, it is a long entry signal; if lower, it is a short entry signal.
For exit rules, if the price breaks through the stop loss or take profit point, exit; also exit when the moving average direction changes.
This strategy combines the advantages of Hull moving average and T3 moving average to generate a comprehensive indicator. Next, this strategy is suitable for both short-term and long-term trading by adjusting the cycle parameter. Also, it adopts dynamic stop loss and take profit to lock in profits and control risks.
The strategy relies mainly on the moving average indicator, which may generate multiple false signals in ranging trends. In addition, the lagging of moving averages may miss the best entry timing. The stop loss and take profit points need careful setting to avoid being too loose or too tight. Finally, parameters need optimization for different currencies and timeframes.
Consider adding other indicators to verify the MA signal and filter out false signals. Test different MA combinations and weighting algorithms to optimize the MA signal. Add adaptive stop loss and trailing take profit to dynamically manage risks. Conduct backtesting optimization on different currencies and timeframes to find the optimal parameter sets.
This strategy integrates the strengths of Hull moving average and T3 moving average to form a comprehensive indicator for judging trend direction. Through parameter optimization, the strategy can be flexibly applied to different trading cycles. The strategy has certain advantages but also problems like lagging and false signals. By adding other indicators, optimizing parameters and dynamic stops, it can be continuously improved for better results.
[/trans]
Strategy Arguments
| Argument | Default | Description |
|---|---|---|
| v_input_1 | true | From Day |
| v_input_2 | true | From Month |
| v_input_3 | 2000 | From Year |
| v_input_4 | 31 | To Day |
| v_input_5 | 12 | To Month |
| v_input_6 | 2021 | To Year |
| v_input_7 | 50 | Length MAs |
| v_input_8 | 0.08 | TP Long |
| v_input_9 | true | SL Long |
| v_input_10 | 0.03 | TP Short |
| v_input_11 | 0.06 | SL Short |
Source (PineScript)
/*backtest
start: 2023-09-23 00:00:00
end: 2023-10-23 00:00:00
period: 1h
basePeriod: 15m
exchanges: [{"eid":"Futures_Binance","currency":"BTC_USDT"}]
*/

// This source code is subject to the terms of the Mozilla Public License 2.0 at https://mozilla.org/MPL/2.0/
// © exlux99

//@version=4


strategy(title="Swing HULL + T3 avg", shorttitle="Swing HULL T3 AVG", overlay=true)

fromDay = input(defval = 1, title = "From Day", minval = 1, maxval = 31)
fromMonth = input(defval = 1, title = "From Month", minval = 1, maxval = 12)
fromYear = input(defval = 2000, title = "From Year", minval = 1970)
 //monday and session
// To Date Inputs
toDay = input(defval = 31, title = "To Day", minval = 1, maxval = 31)
toMonth = input(defval = 12, title = "To Month", minval = 1, maxval = 12)
toYear = input(defval = 2021, title = "To Year", minval = 1970)

startDate = timestamp(fromYear, fromMonth, fromDay, 00, 00)
finishDate = timestamp(toYear, toMonth, toDay, 00, 00)
time_cond = true


////////////////////////////GENERAL INPUTS//////////////////////////////////////

length_Ma= input(defval=50, title="Length MAs", minval=1)

//==========HMA
getHULLMA(src, len) =>
    hullma = wma(2*wma(src, len/2)-wma(src, len), round(sqrt(len)))
    hullma

//==========T3
getT3(src, len, vFactor) =>
    ema1 = ema(src, len)
    ema2 = ema(ema1,len)
    ema3 = ema(ema2,len)
    ema4 = ema(ema3,len)
    ema5 = ema(ema4,len)
    ema6 = ema(ema5,len)
    c1 = -1 * pow(vFactor,3)
    c2 = 3*pow(vFactor,2) + 3*pow(vFactor,3)
    c3 = -6*pow(vFactor,2) - 3*vFactor - 3*pow(vFactor,3)
    c4 = 1 + 3*vFactor + pow(vFactor,3) + 3*pow(vFactor,2)
    T3 = c1*ema6 + c2*ema5 + c3*ema4 + c4*ema3
    T3


hullma = getHULLMA(close,length_Ma)

t3 = getT3(close,length_Ma,0.7)


avg = (hullma+t3) /2


////////////////////////////PLOTTING////////////////////////////////////////////


colorado = avg > avg[1]? color.green : color.red

plot(avg , title="avg", color=colorado, linewidth = 4)

long=avg>avg[1]
short=avg<avg[1]

tplong=input(0.08, title="TP Long", step=0.01)
sllong=input(1.0, title="SL Long", step=0.01)

tpshort=input(0.03, title="TP Short", step=0.01)
slshort=input(0.06, title="SL Short", step=0.01)


if(time_cond)
    strategy.entry("long",1,when=long)
    strategy.exit("closelong", "long" , profit = close * tplong / syminfo.mintick, loss = close * sllong / syminfo.mintick, alert_message = "closelong")

    strategy.entry("short",0,when=short)
    strategy.exit("closeshort", "short" , profit = close * tpshort / syminfo.mintick, loss = close * slshort / syminfo.mintick, alert_message = "closeshort")
Detail
https://www.fmz.com/strategy/430067
Last Modified
2023-10-24 16:55:38
