Name
双移动平均线跨度交易策略Dual-Moving-Average-Crossover-Trading-Strategy
Author
ChaoZhang
Strategy Description
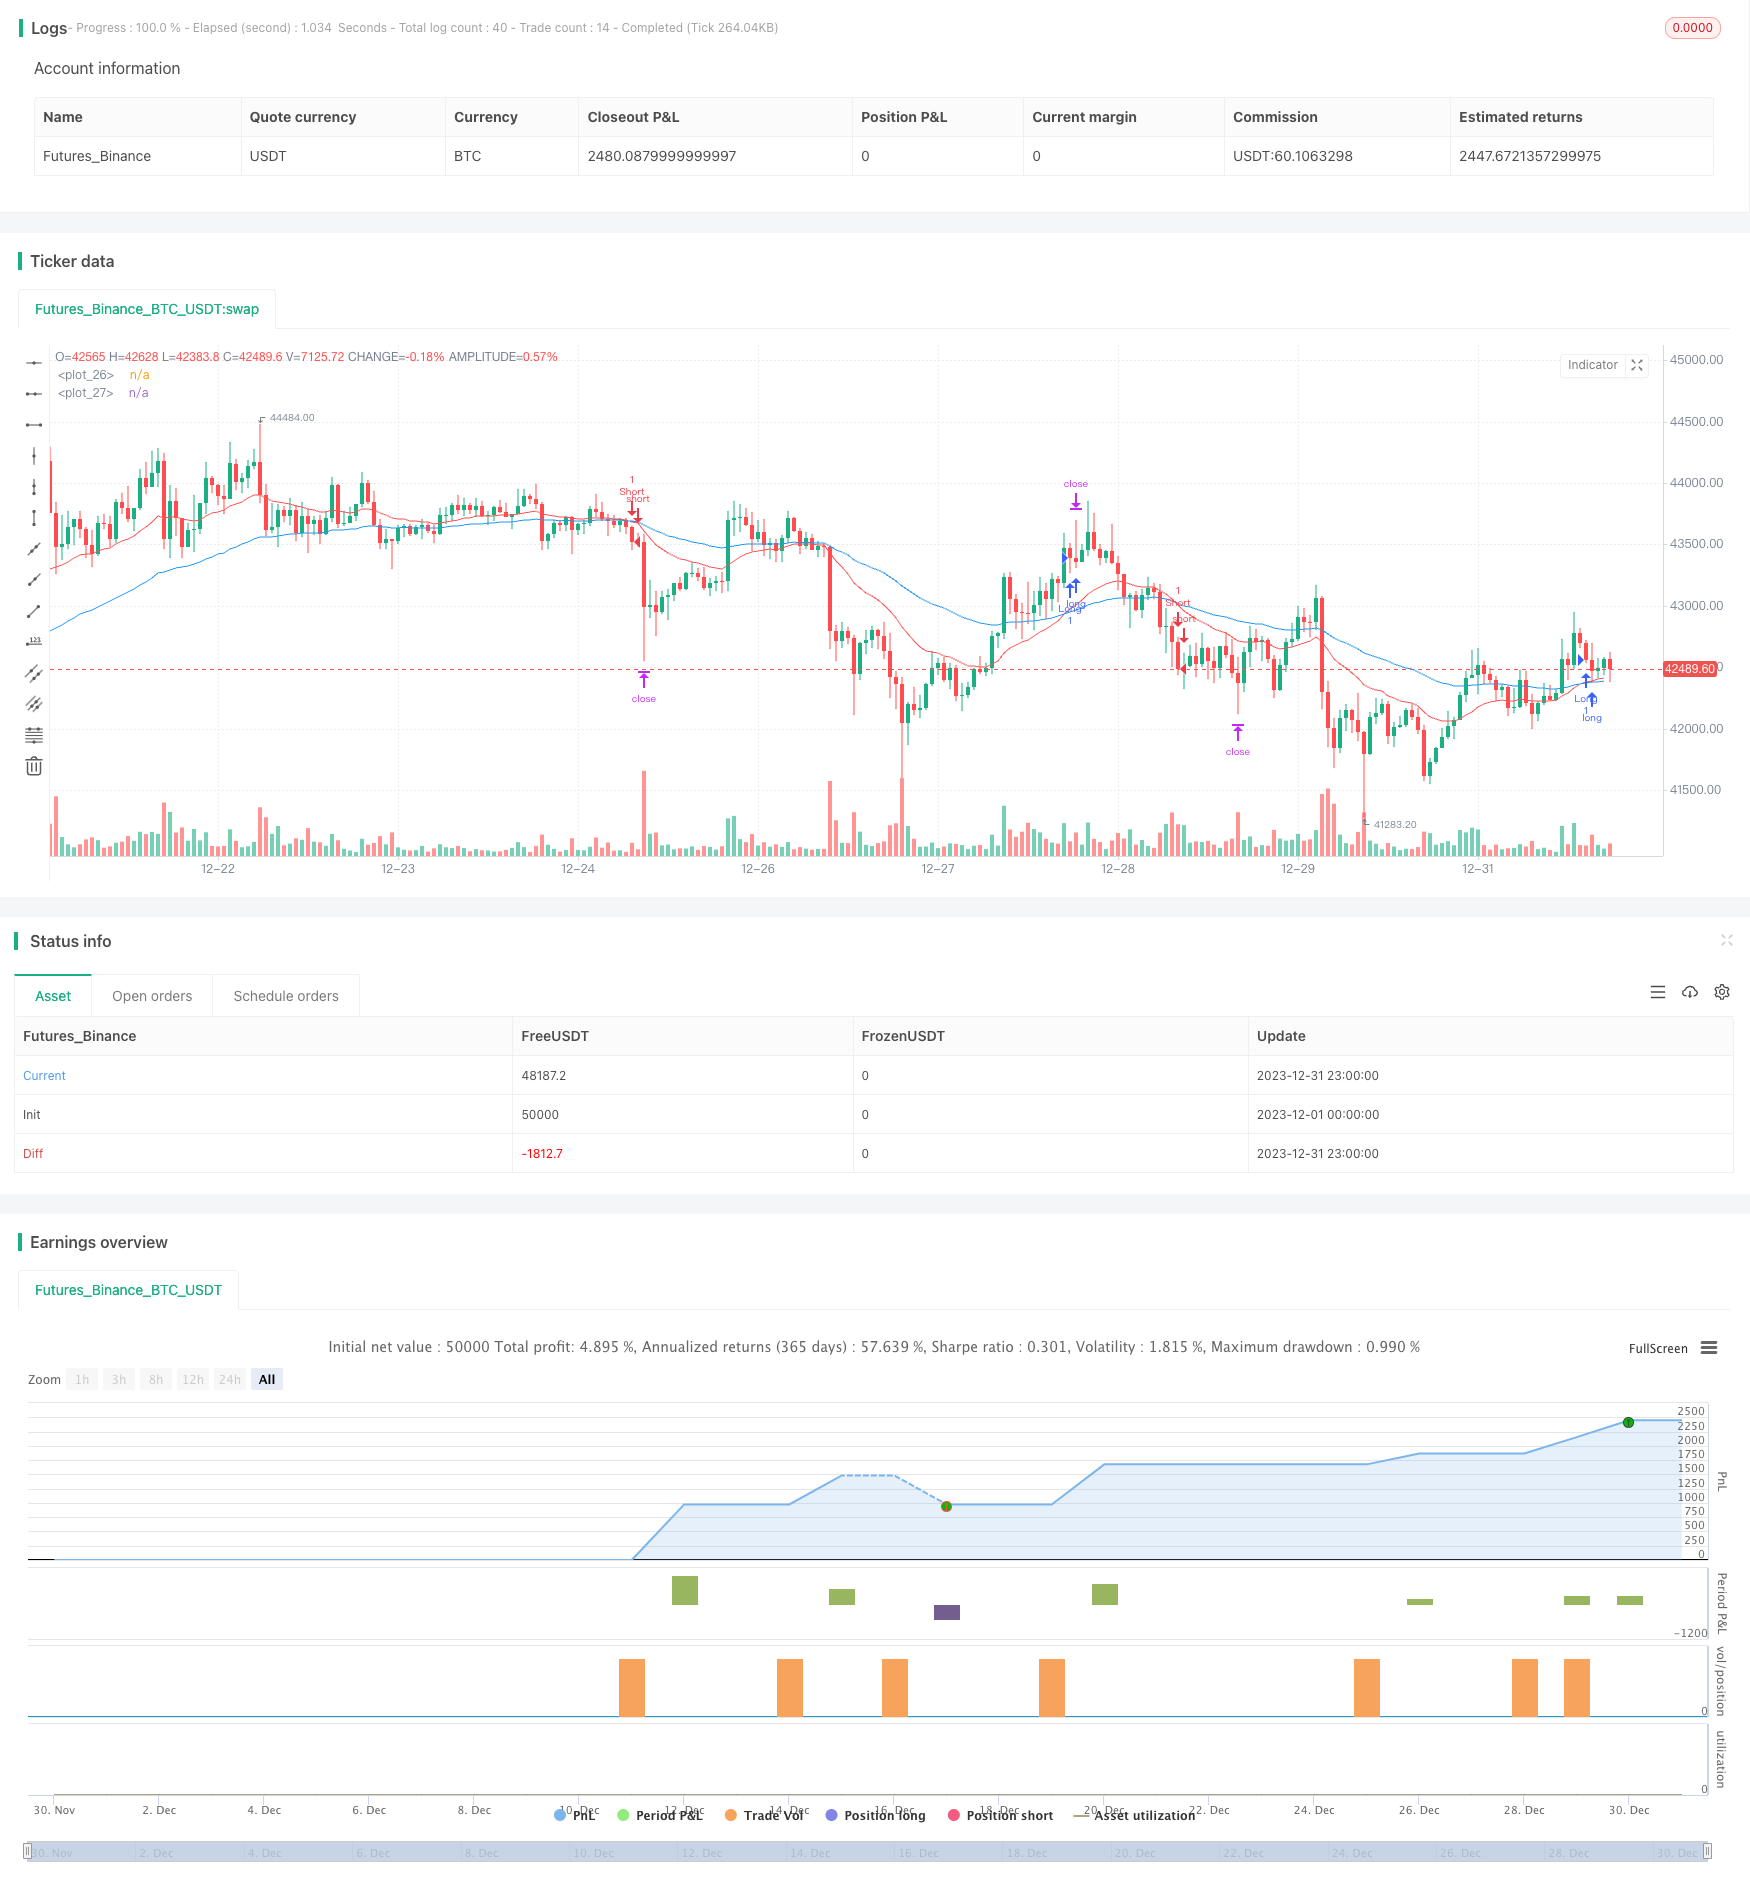
本策略的核心思想是利用快速移动平均线和慢速移动平均线的金叉死叉来判断行情趋势,实现低风险交易。当快速移动平均线上穿慢速移动平均线时,表示行情可能进入上涨趋势,此时做多;当快速移动平均线下穿慢速移动平均线时,表示行情可能进入下跌趋势,此时做空。
本策略使用的是价格的指数移动平均线。移动平均线是一种趋势分析指标,它平滑价格数据来判断价格走势。快速移动平均线参数较小,能更快速地响应价格变化;慢速移动平均线参数较大,响应价格变化较为缓慢。当快速移动平均线上穿慢速移动平均线时,表示行情可能进入多头市场,应该建立多头头寸;当快速移动平均线下穿慢速移动平均线时,表示行情可能进入空头市场,应该建立空头头寸。
具体来说,本策略中定义了两个指数移动平均线,快速移动平均线周期为21,慢速移动平均线周期为55。策略通过判断两条移动平均线的金叉死叉来决定入场出场。当快速移动平均线上穿慢速移动平均线时,做多;当快速移动平均线下穿慢速移动平均线时,做空。
此外,本策略还利用ATR这个波动率指标来设置止损和止盈。ATR可以有效地评估市场波动程度。止损设置为价格离ATR 1.5倍距离;止盈设置为价格接近ATR 1倍距离。
本策略具有以下优势:
- 思路清晰,容易理解和实现。
- 利用移动平均线指标判断价格趋势,实现低风险交易。
- 快速移动平均线和慢速移动平均线配合使用,可以有效过滤市场噪音,识别价格趋势。
- 利用ATR指标来动态设置止损止盈,可以根据市场波动程度来调整仓位。
- 无需频繁调整参数,策略稳定性较高。
本策略也存在一定的风险:
- 当价格出现剧烈波动时,移动平均线容易发出错误信号,可能导致不必要的亏损。
- 本策略仅基于技术指标,没有考虑基本面因素,在重大利空消息面前可能会损失较大。
- ATR指标设定的止损止盈并不一定适合所有的市场环境,可能会过于宽松或过于紧迫。
- 移动平均线周期的设定并不是唯一的最优方案,不同的周期参数组合会产生不同的效果。
针对以上风险,我们可以从以下几个方面进行优化:
- 结合其他指标如MACD、RSI等来确认交易信号,避免错误入场。
- 适当缩小止损幅度,降低单笔损失。
- 动态优化移动平均线周期参数,使之更加贴合不同阶段的市场环境。
本策略可以从以下几个方面进行深入优化:
-
利用机器学习方法自动优化移动平均线参数,使策略更具自适应性。
-
增加基本面因素作为过滤条件,避免在重要利空消息到来时依然盲目做多做空。例如美联储利率决议、重要宏观数据发布等。
-
设定波动率的上下限,当ATR过大或过小时,暂停交易,避免极端市场环境下的亏损。
-
结合股票基本面指标,如PE市盈率、成交量放大效应等,设定动态的止损止盈幅度。
-
增加仓位管理机制,当利润率达到一定水平时,逐步减少仓位;当出现较大亏损时,暂停交易一段时间等。
本策略整体运行思路清晰简单,通过双移动平均线交叉来判断行情趋势,属于一种典型的趋势跟踪策略。同时,策略还很好地控制了风险,利用ATR指标来动态设定止损止盈位。通过进一步的优化,可以使策略在回撤控制和顺势操盘方面都得到提升,从而获得更稳定的投资业绩。
||
The core idea of this strategy is to use the golden cross and death cross of the fast and slow moving average lines to judge the trend of the market and implement low-risk trading. When the fast moving average line crosses above the slow moving average line, it indicates that the market may be entering an uptrend, so go long; when the fast moving average line crosses below the slow moving average line, it indicates that the market may be entering a downtrend, so go short.
This strategy uses the exponential moving average of prices. The moving average is a trend analysis indicator that smooths price data to judge price trends. The fast moving average has a smaller parameter and can respond to price changes faster; the slow moving average has a larger parameter and responds to price changes more slowly. When the fast moving average crosses above the slow moving average, it indicates that the market may be entering a bull market, and a long position should be established; when the fast moving average crosses below the slow moving average, it indicates that the market may be entering a bear market, and a short position should be established.
Specifically, this strategy defines two exponential moving averages, with periods of 21 and 55 for the fast and slow moving average respectively. The strategy determines entry and exit based on the golden cross and death cross of the two moving average lines. Go long when the fast moving average crosses above the slow moving average, and go short when the fast moving average crosses below the slow moving average.
In addition, this strategy also uses the ATR volatility indicator to set stop loss and take profit. ATR can effectively assess the degree of market volatility. The stop loss is set at 1.5 times ATR distance from the price; the take profit is set close to 1 times ATR distance from the price.
This strategy has the following advantages:
- The idea is clear and easy to understand and implement.
- Use the moving average indicator to determine the price trend and implement low-risk trading.
- The combination of fast and slow moving averages can effectively filter market noise and identify price trends.
- Use the ATR indicator to dynamically set stop loss and take profit based on the degree of market volatility.
- No frequent parameter adjustment is required and the strategy is highly stable.
This strategy also has some risks:
- When prices fluctuate violently, the moving average may give wrong signals, which may lead to unnecessary losses.
- This strategy is based solely on technical indicators without considering fundamentals, and may suffer greater losses in the face of major negative news.
- The stop loss and take profit set by the ATR indicator may not suit all market environments, which may be too loose or too tight.
- The setting of moving average periods is not the only optimal scheme, and different combinations of period parameters will produce different effects.
To address the above risks, we can optimize from the following aspects:
- Combine other indicators such as MACD and RSI to confirm trading signals and avoid wrong entry.
- Slightly narrow the stop loss range to reduce per trade loss.
- Dynamically optimize moving average period parameters to adapt them better to different market stages.
This strategy can be further optimized in the following aspects:
-
Use machine learning methods to automatically optimize moving average parameters for better adaptability.
-
Add fundamentals as filtering conditions to avoid going long or short blindly when major negative news arrives, such as Fed rate decisions and important macro data releases.
-
Set upper and lower limits for volatility, pause trading when ATR gets too high or too low to avoid losses in extreme market environments.
-
Incorporate stock fundamentals like P/E ratio and trading volume expansion to set dynamic stop loss and take profit ranges.
-
Add position sizing mechanisms, gradually reducing positions when profit ratio reaches a level, suspending trading for a period when suffering relatively large losses, etc.
The overall logic of this strategy is clear and simple, using dual moving average crossovers to determine market trends, a typical trend following strategy. Meanwhile, the strategy also controls risks very well by using the ATR indicator to dynamically set stop loss and take profit. With further optimization, the strategy can be enhanced in terms of drawdown control and trend riding, thus leading to more steady investment performance.
[/trans]
Strategy Arguments
| Argument | Default | Description |
|---|---|---|
| v_input_1 | 14 | ATR Length |
| v_input_2 | 1.5 | SL |
| v_input_3 | true | TP1 |
| v_input_4 | 21 | fastInput |
| v_input_5 | 55 | slowInput |
Source (PineScript)
/*backtest
start: 2023-12-01 00:00:00
end: 2023-12-31 23:59:59
period: 1h
basePeriod: 15m
exchanges: [{"eid":"Futures_Binance","currency":"BTC_USDT"}]
*/

//@version=3
strategy(title="No-Nonsense Strategy Template [WM]", overlay = true)

price = close

//
// ATR stuff
//

atrLength = input(14, "ATR Length")
slMultiplier = input(1.5, "SL")
tpMultiplier = input(1, "TP1")

atr = atr(atrLength)

//
// Strategy under test. MA crossover
//

fastInput = input(21)
slowInput = input(55)

fast = ema(price, fastInput)
slow = ema(price, slowInput)

plot(fast, color = red)
plot(slow, color = blue)

goLong = crossover(fast, slow)
goShort = crossunder(fast, slow)

if (goLong)
    sl = price - atr * slMultiplier
    tp = price + atr * tpMultiplier
    strategy.entry("Long", strategy.long)
    strategy.exit("Long Exit", "Long", stop = sl, limit = tp)

if (goShort)
    sl = price + atr * slMultiplier
    tp = price - atr * tpMultiplier
    strategy.entry("Short", strategy.short)
    strategy.exit("Short Exit", "Short", stop = sl, limit = tp)
Detail
https://www.fmz.com/strategy/439877
Last Modified
2024-01-24 15:24:13
