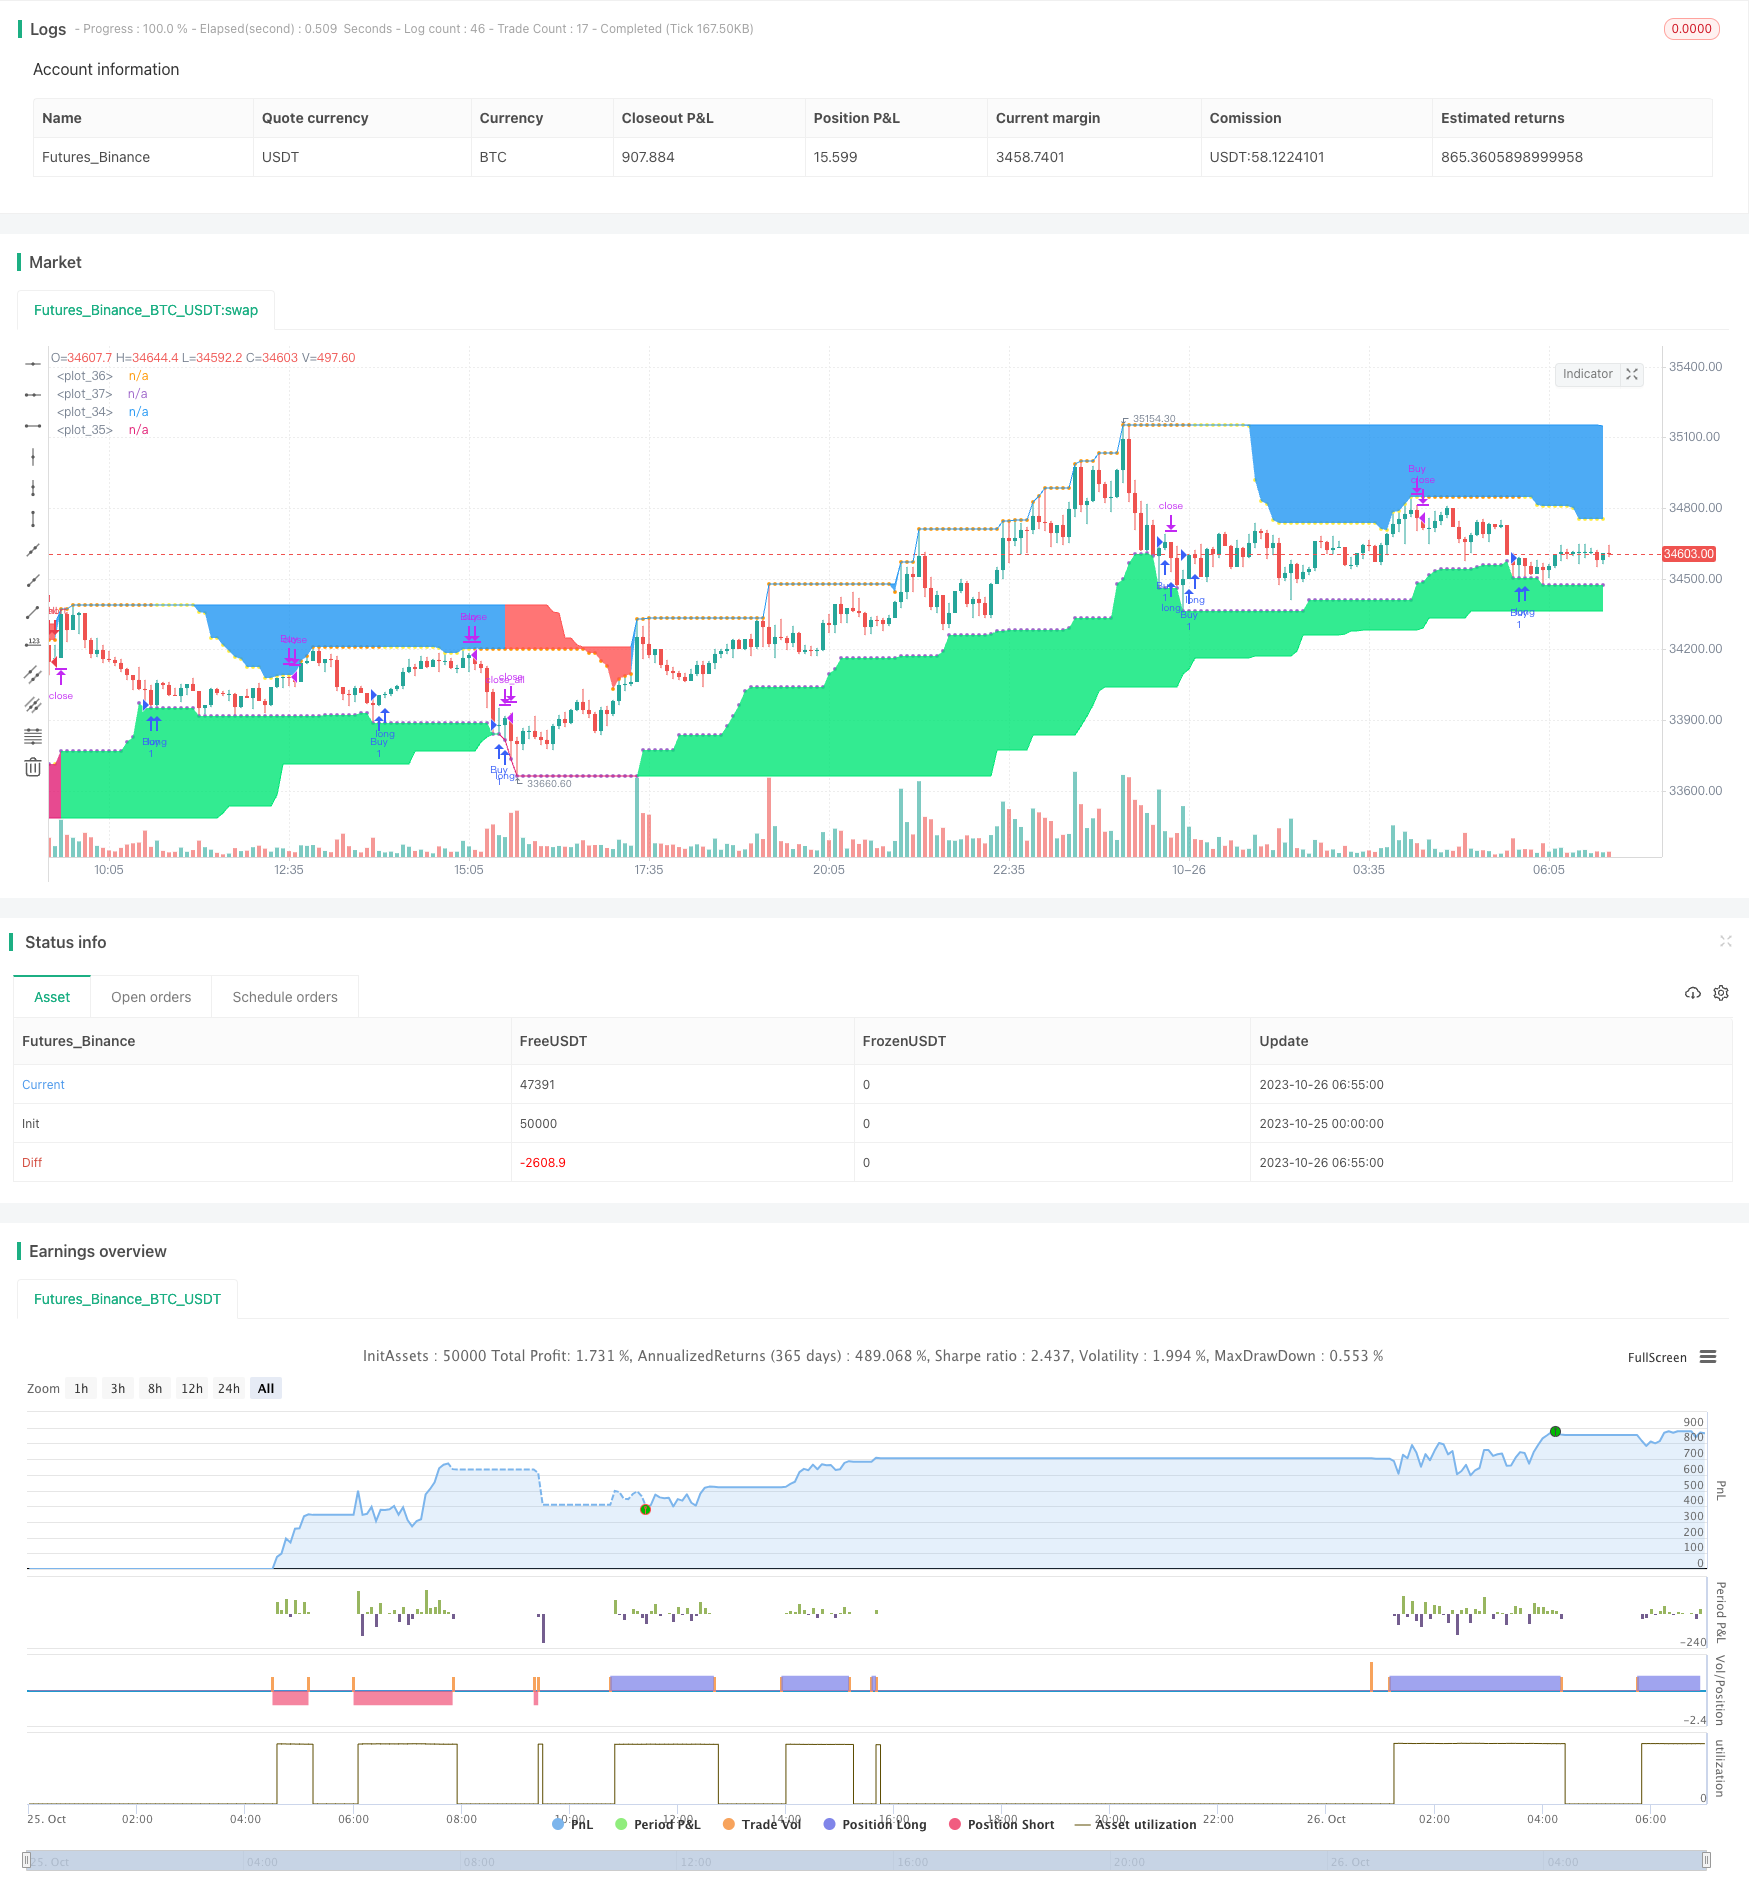
Name
双箱体制趋势追踪系统Double-Box-Trend-Following-System
Author
ChaoZhang
Strategy Description
[trans]
趋势追踪系统是一个基于双箱体制的趋势跟踪策略。它使用长期周期箱体判断整体趋势方向,并在短期箱体产生信号时,选择与长期趋势方向一致的交易信号入场。该策略追踪趋势运行,在利润最大化的同时控制风险。
该策略使用两个箱体判断趋势。长期箱体使用较长周期判断主要趋势方向,短期箱体使用较短周期判断具体交易信号。
策略首先计算长期箱体的最高价和最低价,判断主要趋势方向。趋势方向分为三种:
- 最高价上穿上一根K线的最高价,定义为上升趋势,赋值1
- 最低价下穿上一根K线的最低价,定义为下降趋势,赋值-1
- 否则维持原有趋势方向不变
在判断出主要趋势方向后,策略开始根据短期箱体入场。具体来说:
- 当主要趋势为上升,且短期箱体最低价等于上一根K线的最低价,并低于当前短期箱体最低价时,做多
- 当主要趋势为下降,且短期箱体最高价等于上一根K线的最高价,并高于当前短期箱体最高价时,做空
此外,策略还设置了止损和止盈:
- 多单止损为长期箱体最低价,空单止损为长期箱体最高价
- 多单止盈为短期箱体最高价,空单止盈为短期箱体最低价
当主要趋势发生转折时,平仓所有头寸。
该策略具有以下优势:
- 使用双箱体判断系统,能有效识别趋势方向,降低错误交易概率
- 只有短期反转信号与长期趋势方向一致时才入场,避免被短期市场噪音误导
- 采用长短周期配合,既确保了捕捉主要趋势的能力,又具备适当调整仓位的灵活性
- 设置止损止盈点较为合理,能够把握趋势运行的同时控制风险
- 在主要趋势转折时快速平仓,及时控制亏损
该策略也存在以下风险:
- 长短周期设置不当,容易造成交易频繁或错过机会
- 突发事件造成短期趋势反转不一定代表长期趋势转变,此时仍有亏损风险
- 止损点过于接近,可能会被震出市场
- 止盈点过于宽松,可能无法最大化获利
- 长期趋势判断产生错误,则后续交易亏损 expands
- 应对这些风险的方法包括:调整长短周期参数,优化止损止盈位置,增加过滤条件等。
该策略可以从以下几个方面进行优化:
- 增加过滤条件,避免被短期假突破误导信号
- 优化长短周期参数,使其更符合不同品种特性
- 动态调整止损止盈位置,让止损更精确,止盈更充分
- 增加仓位管理策略,让仓位大小更合理
- 结合volume等指标判断趋势转折的可靠性
- 利用机器学习方法自动优化参数及过滤条件
趋势追踪系统整体是一个非常实用的趋势跟踪策略。它同时兼具趋势判断和短期调整的能力,在追踪趋势的同时还能控制风险。通过不断优化,该策略可以成为一个强大的自动化趋势交易系统。它蕴含了趋势交易的核心哲学,值得深入研究。
[/trans]
||
The Trend Following System is a trend tracking strategy based on a double box system. It uses a long-term box to determine the overall trend direction and takes signals that align with the major trend when the short-term box triggers. This strategy follows trends while managing risks.
The strategy uses two boxes to determine the trend. The long-term box uses a longer period to judge the major trend direction, and the short-term box uses a shorter period to generate trading signals.
First, the strategy calculates the highest and lowest prices of the long-term box to determine the major trend direction. The trend direction can be:
- If the highest price crosses above the highest price of the previous bar, it is defined as an uptrend, assigned a value of 1
- If the lowest price crosses below the lowest price of the previous bar, it is defined as a downtrend, assigned a value of -1
- Otherwise, maintain the original trend direction
After determining the major trend, the strategy starts taking positions based on the short-term box signals. Specifically:
- When the major trend is up and the short-term box's lowest price equals the previous bar's lowest price and is lower than the current short-term box's lowest price, go long.
- When the major trend is down and the short-term box's highest price equals the previous bar's highest price and is higher than the current short-term box's highest price, go short.
In addition, stop loss and take profit are configured:
- Long stop loss is the lowest price of the long-term box, short stop loss is the highest price of the long-term box
- Long take profit is the highest price of the short-term box, short take profit is the lowest price of the short-term box
When the major trend reverses, close all positions.
The advantages of this strategy include:
- The double box system effectively identifies trend directions and reduces incorrect trades
- Only taking reversal signals that align with the major trend avoids being misled by short-term market noise
- The combination of long and short periods ensures capturing major trends while maintaining position adjustment flexibility
- Reasonable stop loss and take profit points control risk while following trends
- Quickly flattening all positions when the major trend reverses minimizes losses
The risks of this strategy include:
- Improper long and short period settings may cause overtrading or missing opportunities
- Short-term reversals may not represent long-term trend changes, still posing loss risks
- Stop loss too close may get stopped out prematurely
- Take profit too loose may not maximize profits
- Wrong judgment of the major trend leads to losses
- Solutions include adjusting periods, optimizing stops/targets, adding filters etc.
The strategy can be improved by:
- Adding filters to avoid false breakouts
- Optimizing long and short periods for different products
- Dynamically adjusting stop loss and take profit levels
- Incorporating position sizing rules
- Using volume etc. to judge reliability of trend changes
- Utilizing machine learning to auto-optimize parameters and filters
The Trend Following System is a practical trend trading strategy combining trend determination and short-term adjustments. With continuous optimizations, it can become a robust automated system that tracks trends while controlling risks. It contains the core philosophies of trend trading and is worth in-depth studying.
[/trans]
Strategy Arguments
| Argument | Default | Description |
|---|---|---|
| v_input_1 | 80 | Longterm Period |
| v_input_2 | 21 | Shortterm Period |
| v_input_3 | true | Show Target |
| v_input_4 | true | Show Trend |
Source (PineScript)
/*backtest
start: 2023-10-25 00:00:00
end: 2023-10-26 07:00:00
period: 5m
basePeriod: 1m
exchanges: [{"eid":"Futures_Binance","currency":"BTC_USDT"}]
*/

// This source code is subject to the terms of the Mozilla Public License 2.0 at https://mozilla.org/MPL/2.0/
// © LonesomeTheBlue

//@version=4
strategy("Grab Trading System", overlay = true)
flb = input(defval = 80, title = "Longterm Period", minval = 1)
slb = input(defval = 21, title = "Shortterm Period", minval = 1)
showtarget = input(defval = true, title = "Show Target")
showtrend = input(defval = true, title = "Show Trend")

major_resistance = highest(flb)
major_support = lowest(flb)
minor_resistance = highest(slb)
minor_support = lowest(slb)

var int trend = 0
trend := high > major_resistance[1] ? 1 : low < major_support[1] ? -1 : trend
strategy.entry("Buy", true, when = trend == 1 and low[1] == minor_support[1] and low > minor_support)
strategy.entry("Sell", false, when = trend == -1 and high[1] == minor_resistance[1] and high < minor_resistance)

if strategy.position_size > 0
    strategy.exit("Buy", stop = major_support, comment = "Stop Buy")
    if high[1] == minor_resistance[1] and high < minor_resistance
        strategy.close("Buy", comment ="Close Buy")

if strategy.position_size < 0
    strategy.exit("Sell", stop = major_resistance, comment = "Stop Sell")
    if low[1] == minor_support[1] and low > minor_support
        strategy.close("Sell", comment ="Close Sell")

if strategy.position_size != 0 and change(trend)
    strategy.close_all()

majr = plot(major_resistance, color = showtrend and trend == -1 and trend[1] == -1 ? color.red : na)
majs = plot(major_support, color = showtrend and trend == 1 and trend[1] == 1 ? color.lime : na)
minr = plot(minor_resistance, color = showtarget and trend == 1 and strategy.position_size > 0 ? color.yellow : na, style = plot.style_circles)
mins = plot(minor_support, color = showtarget and trend == -1 and strategy.position_size < 0 ? color.yellow : na, style = plot.style_circles)

fill(majs, mins, color = showtrend and trend == 1 and trend[1] == 1 ? color.lime : na, transp = 85)
fill(majr, minr, color = showtrend and trend == -1 and trend[1] == -1 ? color.red : na, transp = 85)
Detail
https://www.fmz.com/strategy/430901
Last Modified
2023-11-02 17:19:22
