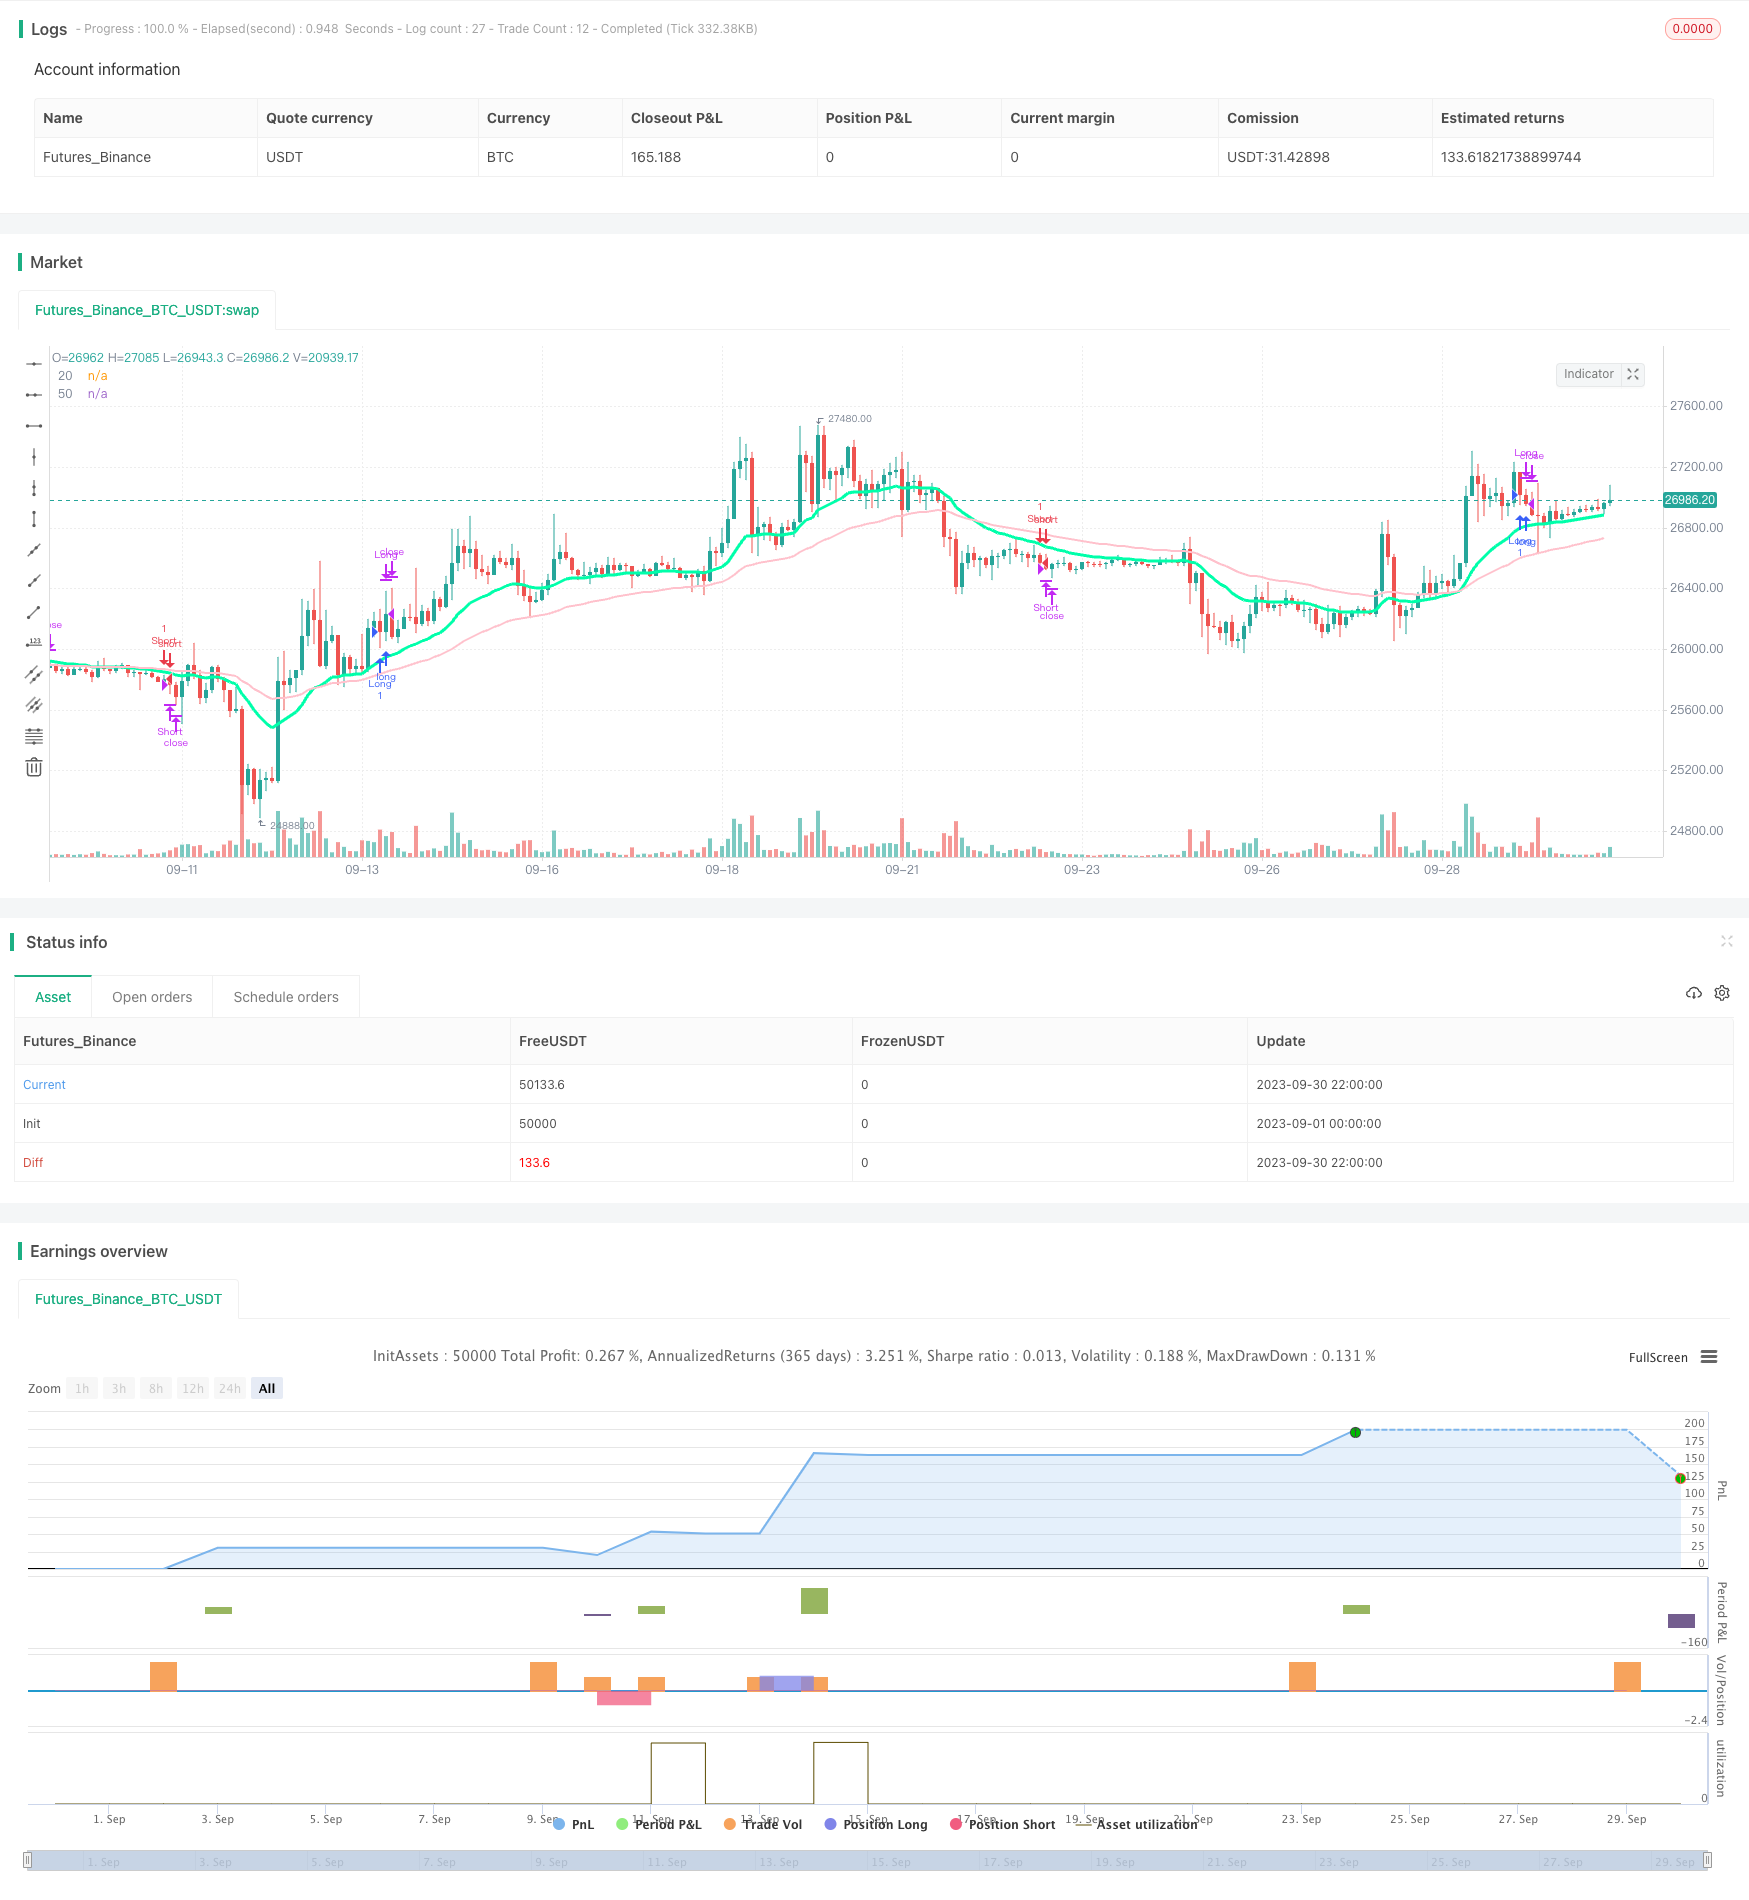
Name
双轨跟踪均线策略Double-Moving-Average-Crossover-Strategy
Author
ChaoZhang
Strategy Description
[trans]
双轨跟踪均线策略是一种典型的移动均线交叉策略。它通过计算不同周期的移动均线,判断市场趋势,利用均线交叉进行买入和卖出操作。该策略简单实用,适用于中长线持仓交易。
该策略主要利用20周期和50周期的指数移动均线(EMA)判断市场趋势。具体逻辑是:
- 计算20周期EMA和50周期EMA。
- 当20周期EMA上穿50周期EMA时,视为市场处于上涨趋势,可以买入。
- 当20周期EMA下穿50周期EMA时,视为市场处于下跌趋势,可以卖出。
- 一旦买入,如果20周期EMA重新下穿50周期EMA,应立即卖出,止损。
- 一旦卖出,如果20周期EMA重新上穿50周期EMA,应立即买入,确保不漏买点。
通过这样的逻辑,双轨均线策略能够跟踪市场趋势的变化,dynamically调整仓位,实现跟踪市场切赚取利润的目的。
双轨均线策略具有以下优势:
-
操作简单,容易实施。仅需要计算和比较两个均线的大小关系,不需要复杂的预测和建模。
-
顺应市场趋势,避免强行逆市操作。利用均线的趋势跟踪特性,只有在趋势明确时才进入场内。
-
自动止损,风险控制。当市场突然逆转时,能够快速止损,保护资金。
-
回补亏损,不漏买点。当止损后市场重新转 bull,也能及时追涨回补。
-
参数灵活,适用性强。均线参数可调,适用于不同市场环境。
-
资金利用效率高。跟踪趋势切换仓位,保持资金效率最大化利用。
双轨均线策略也存在一些风险:
-
频繁交易,容易被交易费用消耗。双均线频繁交叉可能导致过于频繁交易。
-
震荡市场虚假信号多。震荡行情中均线可能产生多个虚假交叉,导致亏损。
-
设定合理参数很关键。参数设置不当,止损幅度过大或过小都可能带来损失。
-
突发事件难以应对。重大黑天鹅事件发生时,技术指标难以应对,可能造成较大损失。
-
错过市场关键点位。双均线策略无法判断市场关键支撑与关键阻力点位。
针对以上风险,我们可以通过优化参数设定、结合其他指标过滤信号、设置止损止盈、运用资金管理等方法进行风险控制。
双轨均线策略可以从以下几个方面进行优化:
-
优化均线参数,适应不同市场环境。可以测试不同短期长期均线的组合,找到一组适合当前市场的Parameters。
-
加入成交量指标进行信号过滤。例如突破时要求成交量放大,避免无量突破。
-
结合其他指标进行信号验证。例如MACD,Stochastic等指标与均线方向一致时,Entry signal的可靠性更高。
-
动态调整止损幅度。当波动加大时,可以适当放宽止损范围,减少虚拟止损被触发的概率。
-
优化资金管理策略。例如风险评估后设定合理的仓位大小,避免单笔损失过大。
-
区分趋势市和震荡市采用不同Entry logic。在震荡市中,可以收紧Entry条件,等待更可靠Entry机会。
双轨均线策略是一个非常典型和实用的趋势跟踪策略。它具有操作简单,顺应趋势,自动止损,回补亏损等优点,非常适合中长线持仓交易。我们也要注意它存在的频繁交易,容易产生虚假信号等问题,可以通过参数优化、加入过滤器、资金管理等方法进行改进,使策略更稳定可靠。如果您希望立足趋势交易,顺应市场,双均线策略是一个不错的选择。
||
The double moving average crossover strategy is a typical trend following strategy using moving averages. It identifies market trend by comparing two moving averages of different periods and generates buy and sell signals when the averages cross over. This simple and practical strategy is suitable for medium to long term position trading.
The strategy mainly utilizes 20-period and 50-period exponential moving averages (EMA) to determine market trend. The logic is:
- Calculate 20-period EMA and 50-period EMA.
- When 20-period EMA crosses above 50-period EMA, market is considered in uptrend and long position can be taken.
- When 20-period EMA crosses below 50-period EMA, market is considered in downtrend and short position can be taken.
- If already long, close long when 20-period EMA crosses below 50-period EMA. This stop loss avoids further loss.
- If already short, close short when 20-period EMA crosses above 50-period EMA. This catches upside movements.
With this logic, the double EMA strategy is able to follow trend changes dynamically, adjusting position to maximize profit during the trend.
The double moving average crossover strategy has the following advantages:
-
Simple to implement. Only comparison between two averages is needed, without complex prediction or modeling.
-
Follows market trend, avoids trading against trend. Utilizes trend tracking ability of moving averages to only enter market when trend is clear.
-
Automatic stop loss for risk control. Quickly exits losing trades when trend suddenly reverses.
-
Makeup losing trades, catches upside. Re-enters after stop loss when trend turns bullish again.
-
Flexible parameters, adaptable. MA periods can be adjusted for different market environments.
-
High capital utilization. Frequently adjusts position based on trend, keeping capital fully utilized.
There are also some risks with this strategy:
-
Frequent trading costs. Frequent crosses may lead to excessive transactions.
-
False signals in range-bound markets. Moving averages may cross over multiple times in choppy markets, causing losses.
-
Parameter tuning critical. Inadequate stop loss or take profit setting can lead to losses.
-
Unable to respond to black swan events. Technical indicators have limited ability to capture extreme events.
-
Misses key support/resistance. Double MA strategy does not identify critical points.
To manage the risks, methods like parameter optimization, adding filters, stop loss, position sizing based on risk assessment can be applied.
The double moving average strategy can be enhanced in several aspects:
-
Optimize MA parameters for changing markets. Test different short and long term MA combinations to find best fit for current environment.
-
Add volume filter to avoid false breakouts. Require confirming volume when breakout happens.
-
Incorporate other indicators for signal validation. Higher reliability when indicators like MACD, Stochastic etc. align with MA crossover.
-
Dynamically adjust stop loss width. Widen stop loss when volatility increases to avoid premature exit.
-
Optimize capital management. Determine position size based on risk to limit loss on single trades.
-
Use different entry logic for trending vs. range-bound markets. Tighten entry rules in choppy markets, waiting for high conviction signals.
The double moving average crossover is a very typical and practical trend following strategy. It has the advantages of easy implementation, following trends, automatic stop loss, makeup losing trades etc., making it very suitable for medium/long-term position trading. We should also pay attention to the risks like over-trading and false signals. These can be improved via parameter tuning, adding filters and proper capital management. For traders looking to ride the trend, this is a simple yet solid strategy.
[/trans]
Source (PineScript)
/*backtest
start: 2023-09-01 00:00:00
end: 2023-09-30 23:59:59
period: 2h
basePeriod: 15m
exchanges: [{"eid":"Futures_Binance","currency":"BTC_USDT"}]
*/

//@version =4
strategy("Moving Average Cross", overlay=true)

ema20 =  ema(close, 20)
ema50 =ema(close, 50)

long = ema20 > ema50
short = ema20 < ema50

longcondition = long and long[10] and not long[11]
shortcondition = short and short[10] and not short[11]

closelong = ema20 < ema50 and not long[11]
closeshort = ema20 > ema50 and not short[11]


plot(ema20, title="20", color=#00ffaa, linewidth=3)
plot(ema50, title="50", color=#FFC1CC, linewidth=2)

start = timestamp(2015,6,1,0,0)

end = timestamp(2019,6,1,0,0)

if true
    strategy.entry("Long" ,strategy.long,  when = longcondition)
    strategy.entry("Short" ,strategy.short, when = shortcondition)


strategy.close("Long", when = closeshort)
strategy.close("Short", when = closelong)
Detail
https://www.fmz.com/strategy/430152
Last Modified
2023-10-25 15:14:35
