Name
双重指标震荡策略-Dual-Indicator-Oscillation-Strategy
Author
ChaoZhang
Strategy Description
[trans]
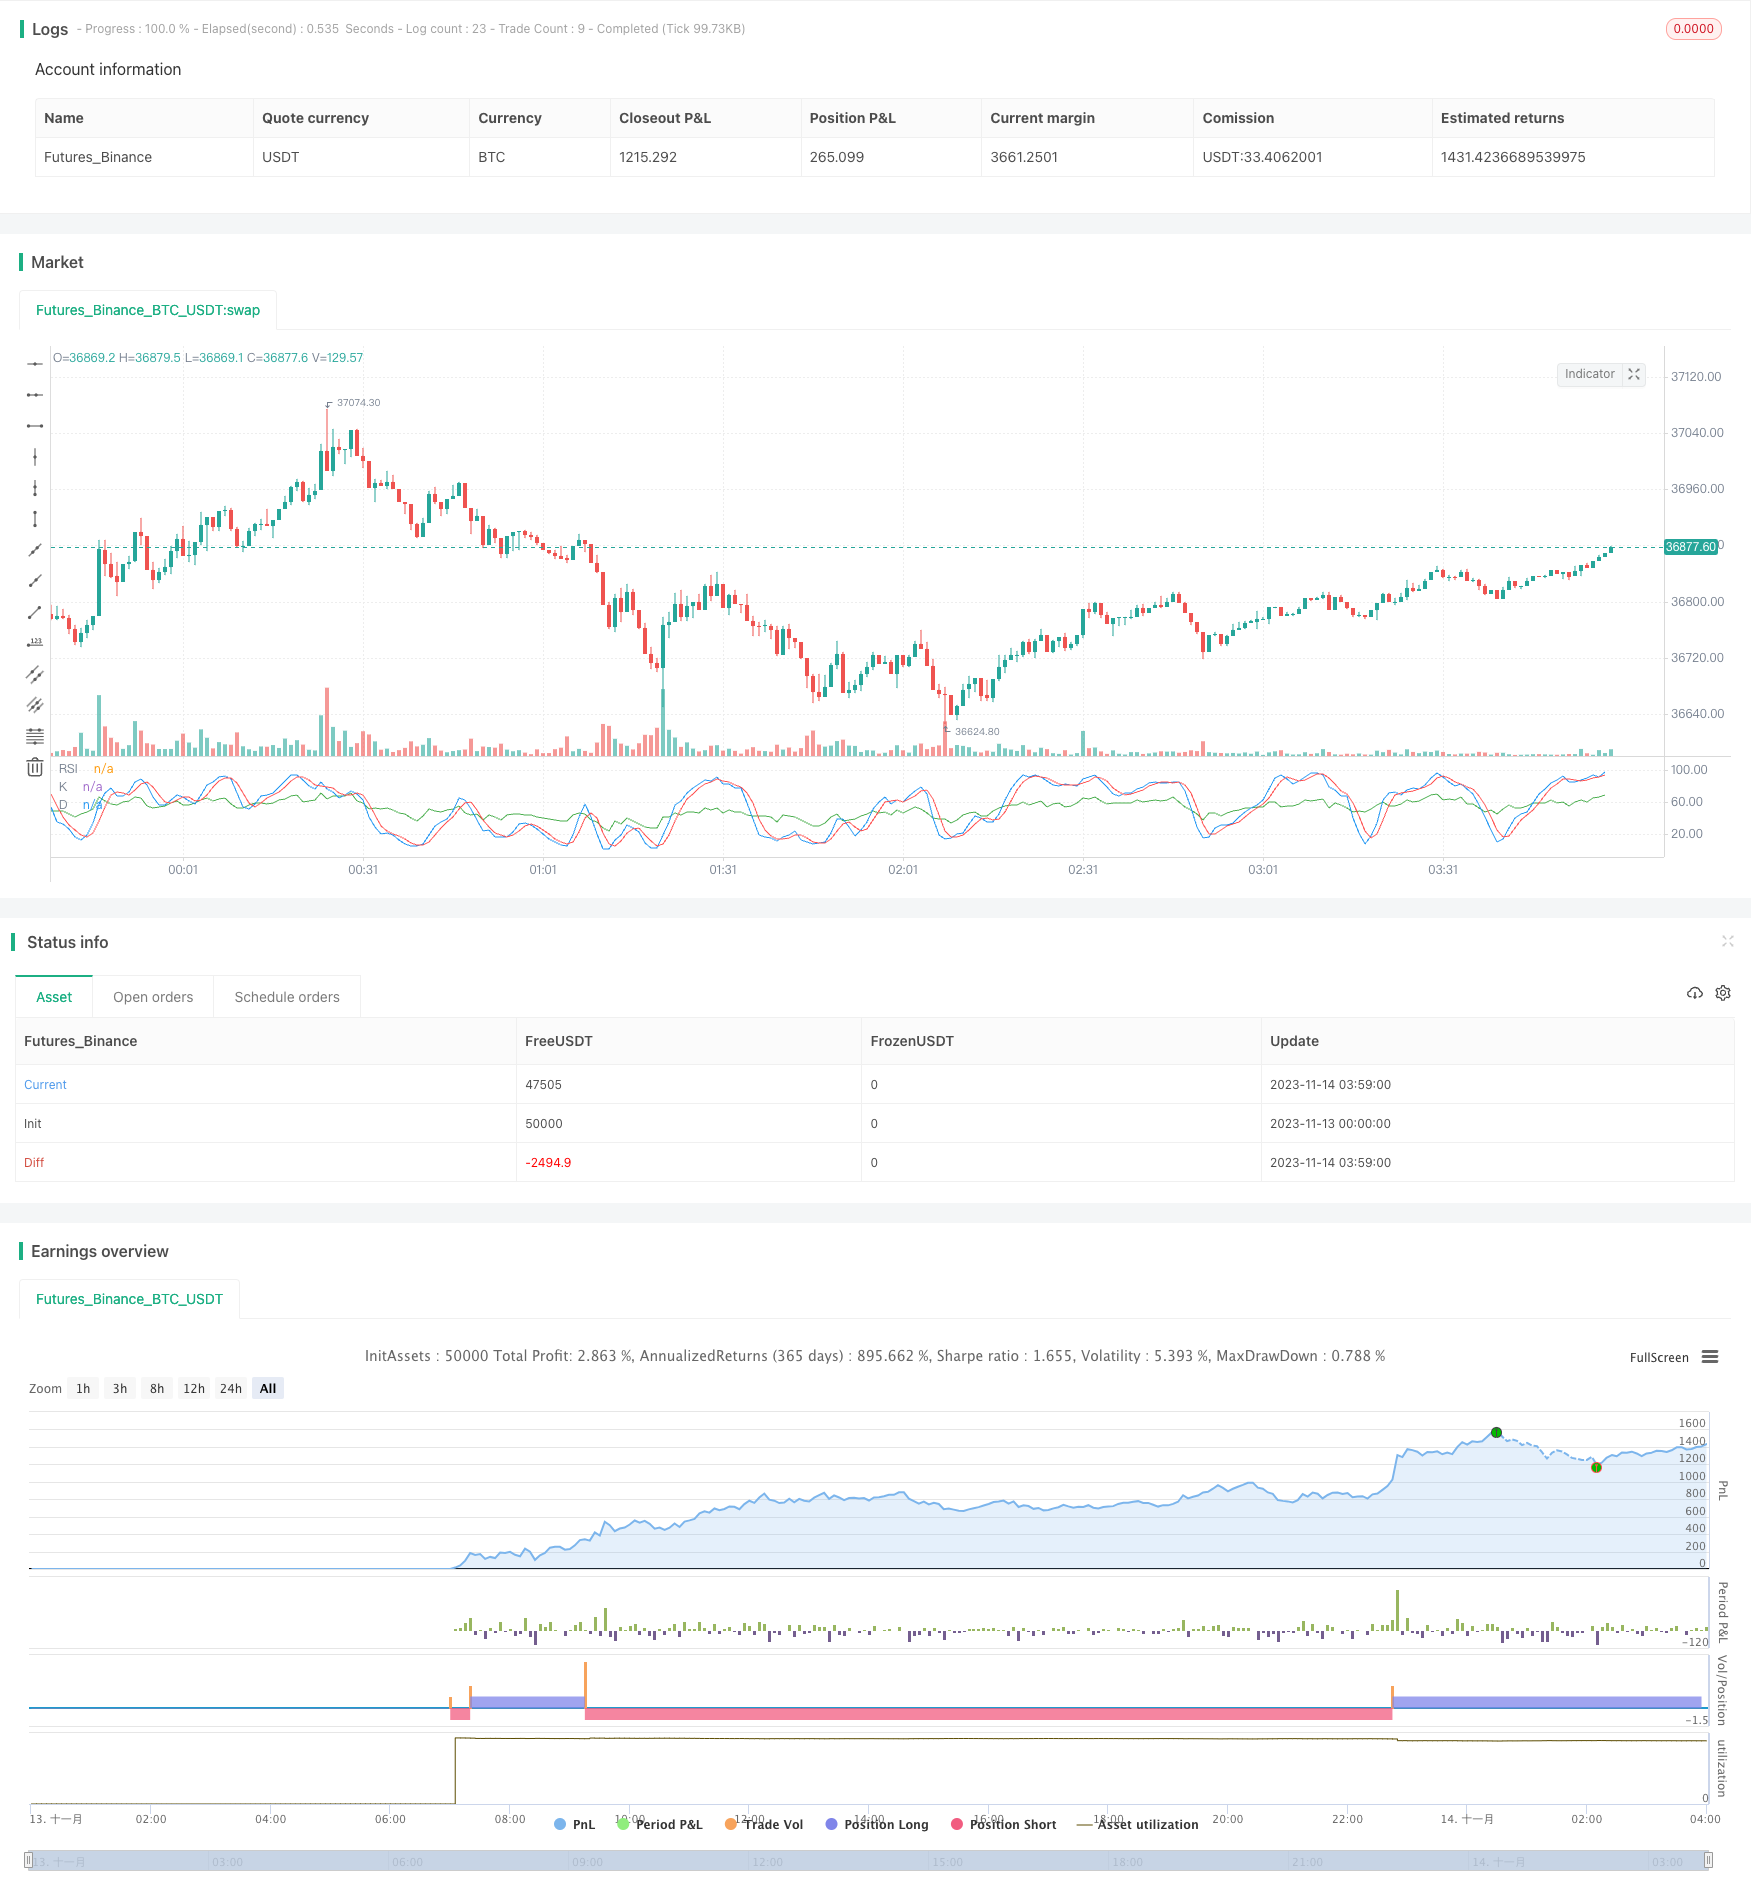
本策略通过组合使用随机指标RSI和指定参数的随机震荡指标Stochastic Oscillator,在一定震荡区间内进行买入和卖出操作。
代码中首先定义了Stochastic Oscillator的K值、D值和SD值等参数,以及RSI指标的周期参数。在每根K线计算出Stochastic Oscillator和RSI的值之后,如果RSI小于低档20并且K值也低于20时就是超买信号而做空;如果RSI大于高档80并且K值也高于80时就是超卖信号而做多。这样通过双重指标确认,可以过滤掉一些假信号。此外还设置了止损和止盈条件。
这种双重指标过滤的策略,可以有效减少普通Stochastic策略中 whipsaws 带来的不必要交易。同时结合趋势指标RSI,可以避免在没有明确趋势时盲目交易。所以这种组合指标策略可以提高信号质量,减少假信号,更好控制风险。
该策略最大的风险在于指定的参数不一定适用于所有品种和所有时间段,如在细分的时间周期内,RSI和Stochastic的参数需要调整。另外在趋势剧烈变化时,Stochastic型策略会产生较大亏损。因此这种策略更适用于震荡盘整理的市场环境。
可以测试更多指标的组合,如将MACD指标与Stochastic或RSI组合,形成多重指标过滤;调整RSI和Stochastic的具体参数值,寻找最佳参数组合;可以根据最近N天的波动情况动态调整止损止盈幅度。通过参数优化和指标优化,可以持续改进策略表现。
本策略综合运用随机震荡指标Stochastic和趋势强度指标RSI进行双重指标过滤,可以有效识别超买超卖情况,适合震荡盘整理的市场,效果优于单一Stochastic指标策略。通过参数和指标组合优化,策略效果还有进一步提升空间。
||
This strategy combines the stochastic indicator RSI and Stochastic Oscillator with specified parameters to make buy and sell operations within a certain oscillation range.
The code first defines parameters like K value, D value and SD value of the Stochastic Oscillator, and cycle parameters of the RSI indicator. After calculating the values of Stochastic Oscillator and RSI for each candlestick, if RSI is lower than the lower limit 20 and K value is also lower than 20, it is an oversold signal for going short; if RSI is higher than the upper limit 80 and K value is also higher than 80, it is an overbought signal for going long. The dual indicator confirmation can filter out some false signals. It also sets stop loss and take profit conditions.
This dual indicator filtering strategy can effectively reduce unnecessary trades caused by whipsaws in a common Stochastic strategy. Combining with the trend indicator RSI also avoids blind trading without a clear trend. So this combined indicator strategy can improve signal quality, reduce false signals, and better control risks.
The biggest risk of this strategy is that the specified parameters may not be suitable for all varieties and time periods. For example, the parameters of RSI and Stochastic need to be adjusted in subdivided time cycles. In addition, Stochastic-type strategies will incur greater losses when trends change dramatically. Therefore, this strategy is more suitable for range-bound oscillating market environments.
More combinations of indicators can be tested, such as combining MACD with Stochastic or RSI to form multiple indicator filtering. The specific parameter values of RSI and Stochastic can be adjusted to find the optimal parameter combination. The stop loss and take profit range can be adjusted dynamically based on fluctuations over the recent N days. Through parameter optimization and indicator optimization, the strategy performance can be continuously improved.
This strategy integrates the stochastic indicator Stochastic and trend strength indicator RSI for dual indicator filtering, which can effectively identify overbought and oversold situations suitable for range-bound oscillation markets, performing better than single Stochastic indicator strategies. There is further room for performance improvement through parameter and indicator combination optimization.
[/trans]
Strategy Arguments
| Argument | Default | Description |
|---|---|---|
| v_input_1 | 14 | K |
| v_input_2 | 3 | D |
| v_input_3 | 3 | SD |
| v_input_4 | 20 | Oversold |
| v_input_5 | 80 | Overbought |
| v_input_6 | 14 | RSI Period |
| v_input_7 | 100 | Stop Loss |
| v_input_8 | 100 | Take Profit |
Source (PineScript)
/*backtest
start: 2023-11-13 00:00:00
end: 2023-11-14 04:00:00
period: 1m
basePeriod: 1m
exchanges: [{"eid":"Futures_Binance","currency":"BTC_USDT"}]
*/

//@version=4
strategy("Estrategia de Oscilador Estocástico y RSI", overlay=false)

// Configuración del Oscilador Estocástico
fastK = input(14, title="K", minval=1)
slowK = input(3, title="D", minval=1)
slowD = input(3, title="SD", minval=1)
overSold = input(20, title="Oversold")
overBought = input(80, title="Overbought")

// Configuración del RSI
rsiPeriod = input(14, title="RSI Period")

// Cálculo del Oscilador Estocástico
k = sma(stoch(close, high, low, fastK), slowK)
d = sma(k, slowD)

// Cálculo del RSI
rsi = rsi(close, rsiPeriod)

// Lógica de la estrategia
if (rsi < overSold and k < overSold)
    strategy.entry("Compra", strategy.long)
if (rsi > overBought and k > overBought)
    strategy.entry("Venta", strategy.short)

// Establecer stop loss y take profit
stopLoss = input(100, title="Stop Loss")
takeProfit = input(100, title="Take Profit")
strategy.exit("Stop Loss / Take Profit", "Compra", stop=close - stopLoss, limit=close + takeProfit)
strategy.exit("Stop Loss / Take Profit", "Venta", stop=close + stopLoss, limit=close - takeProfit)

// Trama de gráfico
plot(k, color=color.blue, title="K")
plot(d, color=color.red, title="D")
plot(rsi, color=color.green, title="RSI")
Detail
https://www.fmz.com/strategy/432797
Last Modified
2023-11-21 15:50:37
